. 2015 Apr 3;11(4):653-69.
doi: 10.1080/15548627.2015.1034414.

Disruption of sphingolipid metabolism augments ceramide-induced autophagy in preeclampsia

Affiliations

Disruption of sphingolipid metabolism augments ceramide-induced autophagy in preeclampsia

Megan Melland-Smith et al. Autophagy. .

Abstract

Bioactive sphingolipids including ceramides are involved in a variety of pathophysiological processes by regulating cell death and survival. The objective of the current study was to examine ceramide metabolism in preeclampsia, a serious disorder of pregnancy characterized by oxidative stress, and increased trophoblast cell death and autophagy. Maternal circulating and placental ceramide levels quantified by tandem mass spectrometry were elevated in pregnancies complicated by preeclampsia. Placental ceramides were elevated due to greater de novo synthesis via high serine palmitoyltransferase activity and reduced lysosomal breakdown via diminished ASAH1 expression caused by TGFB3-induced E2F4 transcriptional repression. SMPD1 activity was reduced; hence, sphingomyelin degradation by SMPD1 did not contribute to elevated ceramide levels in preeclampsia. Oxidative stress triggered similar changes in ceramide levels and acid hydrolase expression in villous explants and trophoblast cells. MALDI-imaging mass spectrometry localized the ceramide increases to the trophophoblast layers and syncytial knots of placentae from pregnancies complicated by preeclampsia. ASAH1 inhibition or ceramide treatment induced autophagy in human trophoblast cells via a shift of the BOK-MCL1 rheostat toward prodeath BOK. Pharmacological inhibition of ASAH1 activity in pregnant mice resulted in increased placental ceramide content, abnormal placentation, reduced fetal growth, and increased autophagy via a similar shift in the BOK-MCL1 system. Our results reveal that oxidative stress-induced reduction of lysosomal hydrolase activities in combination with elevated de novo synthesis leads to ceramide overload, resulting in increased trophoblast cell autophagy, and typifies preeclampsia as a sphingolipid storage disorder.

Keywords: 2-OE, 2-oleoylethanolamine; 3-KDS, 3-keto dihydrosphingosine; 3-MA, 3-methyladenine; ACTB, actin β; ASAH1, N-acylsphingosine amidohydrolase (acid ceramidase) 1; BECN1, Beclin 1, autophagy related; BOK; BOK, BCL2-related ovarian killer; BafA1, bafilomycin A1; CANX, calnexin; CASP3 (caspase 3, apoptosis-related cysteine peptidase); CERs, ceramides; CT, cytotrophoblast cells; D-NMAPPD, N-[(1R,2R)-2-hydroxyl-1-(hydroxyL-methyl)-2-(4-nitrophenyl) ethyl]-tetradecanamide; DHCer, dihydro-ceramide; E2F4, E2F transcription factor 4, p107/p130-binding; HIF1A, hypoxia inducible factor 1, α, subunit (basic helix-loop-helix transcription factor); LAMP1, lysosomal-associated membrane protein 1; LC-MS/MS, liquid chromatography-tandem mass spectrometry; LC3B-II, cleaved and lipidated form of microtubule-associated protein 1 light chain 3 β (MAP1LC3B/LC3B); MALDI-MS, matrix-assisted laser desorption/ionization-mass spectrometry; MCL1; MCL1, myeloid cell leukemia 1; PE, preeclampsia; PTC, preterm control; S1P, sphingosine-1-phosphate; SM, sphingomyelin; SMPD1, sphingomyelin phosphodiesterase 1, acid lysosomal (acid sphingomyelinase); SNP, sodium nitroprusside (III); SPH, sphingosine; SPT, serine palmitoyltransferase; SQSTM1/p62, sequestosome 1; ST, syncytium/syncytiotrophoblast cells; Sa, sphinganine; TC, term control; TGFB, transforming growth factor β; autophagy; oxidative stress; placenta; preeclampsia; siRNA, small-interfering ribonucleic acid; sphingolipid metabolism.


Figures
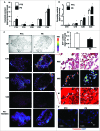
Figure 1.
Figure 1.
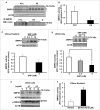
For figure legend, see page 656. Figure 1 (See previous page). Sphingolipid levels are increased in preeclamptic placentae. CER levels measured by LC-MS/MS in placental tissue (A) and sera (B) from PE women compared to normotensive PTC. Numbers indicate fatty acid chain length of CERs with d18:1 sphingosine backbone (PE, n = 45; PTC, P = 40 *P<0.05). (B, lower panel) S1P content in sera from PE and PTC women. (C, left panels) Spatial localization of CERs in placentae from PE and PTC using MALDI-MS imaging (MSI). Representative images of C16:0, C22:0; C24:0 CER and phosphatidylcholine PC-16:0/20:4 distributions in PE and PTC sections. BF: bright field image. (C, right panels) H&E and MSI of C16:0 CER. Merged image (M) of H&E and MSI shows C16:0 CER distribution in PE placental villi. Intensities of ions based on the intensity scale provided. (D) Spatial localization of ceramide immunoreactivity in placental sections from PE and PTC placentae (ST, syncytiotrophoblast cells). Ceramide (red) and nuclei counterstained with DAPI (blue). Bar: 1cm in BF; Bar: 50 μm in H&E.
Figure 2.
Figure 2.
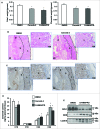
The de novo ceramide synthesis is increased in preeclampsia while acid ceramidase expression and activity is reduced. (A) SPT activity in PE and PTC placentae. (B) Sphinganine (Sa) and dihydroceramide (DHCer24) content in PE vs. PTC placentae (PE, n = 45; TC, n = 40; *P < 0.05). (C) Western blot analysis of ASAH1 following incubation with a competing peptide (CP) for ASAH1 antibody in PTC placental lysates. (D and E) ASAH1 protein expression in PE vs PTC placentae (PE, n = 23; PTC, n = 15; TC, n = 11 *P<0.0015). (F) ASAH1 enzyme activity in PE placentae compared to PTC and TC placentae. (G) ASAH1 mRNA expression in PE vs. PTC placentae (PE, n = 9; PTC, n = 10, *P < 0.002).
Figure 3.
Figure 3.
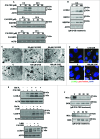
Oxidative stress reduces acid ceramidase expression and impinges on ceramide levels. (A) Representative immunoblots for E2F4 and E2F1 in PE and PTC placentae. (B) ChIP analysis of E2F4 binding to ASAH1 promoter in PE (PE; n = 6 in triplicate) vs. PTC (PTC; n = 6 in triplicate) placentae. Data expressed as % of ASAH1 qPCR of total input DNA; ChIP with nonimmune IgG served as negative control, *P<0.05 vs PTC). (C) AC mRNA expression in E2F4 siRNA-treated JEG3 cells (n = 3, *P<0.05). (D) E2F4 and ASAH1 protein expression in E2F4 siRNA-treated JEG3 cells. (E) Representative immunoblots for E2F4 and phosphorylated pSMAD2 in JEG3 cells following treatment with TGFB1/3 with and without SMAD2 RNAi. (F) Ceramide levels in explants (n = 6 *P<0.05) following SNP exposure. (G) ASAH1 protein expression in villous explants after SNP treatment.
Figure 4.
Figure 4.
Expression, glycosylation, and activity of acid sphingomyelinase are altered in preeclampsia. (A) Upper panel: Protein expression of SMPD1 (70-kDa active and 75-kDa precursor protein) in PE compared to PTC placentae. Lower panel: Immunoprecipitation of SMPD1 from PE placental lysates followed by western blot using concanavalin A (ConA) in PE vs PTC placentae. (N represents immunoprecipitation with nonimmune IgG control). (B) SMPD1 enzyme activity in PE compared to PTC placentae (PE, n = 6; PTC, n = 6 *P<0.05). (C) SMPD1 protein expression (upper panel) and enzyme activity (lower panel) in human villous explants following exposure to SNP (n = 5 *P<0.02). (D) Protein expression (upper panel) and enzyme activity (lower panel) in JEG3 cells treated with SNP (n = 6 *P<0.05). (E) SMPD1 and phosphorylated pSMAD2 in JEG3 cells following treatment with TGFB1 and TGFB3. (F) SMPD1 enzyme activity in villous explants after exposure to the TGFBR1/ALK5 inhibitor SB-431542 (n = 3, *P < 0.05). RFU, relative fluorescence units.
Figure 5.
Figure 5.
Ceramide accumulates in lysosomal fractions in preeclampsia. (A and B) PE and PTC placental tissue were subjected to subcellular fractionation. Lysosomal (L) fractions were enriched in LAMP1 (A) and ACP2/acid phosphatase activity (B) whereas microsomal (M) fractions contained CANX (A). (C upper panel) CER levels in lysosomal (L) and microsomal (M) subfractions isolated from PE and PTC placentae (PE, n = 5; PTC, n = 5 *P<0.05). (C lower panel) SM content in L subfractions from PE and PTC placentae. (D) SMPD1 and ASAH1 protein expression in L and M subfractions from PE and PTC placentae. (E) Immunofluorescence analysis of CER and LAMP1 of placental sections from PTC and PE to visualize CER compartmentalization to lysosomes. (F) CER levels in L subfractions from villous explants treated with SNP or control vehicle. CANX, calnexin.
Figure 6.
Figure 6.
Addition of Ceranib-2 or D-NMAPPD alters murine placental development. (A) Fetal (left) and placental (right) weights from CD1 mice injected with ASAH1 inhibitor, ceranib-2 or D-NMAPPD (20 mg/kg), or DMSO vehicle (DMSO, n = 9; Ceranib-2, n = 13; D-NMAPPD, n = 8, 2 separate litters, *P<0.05). (B) H&E staining of placental sections from mice injected with ceranib-2 vs DMSO. (C) Placental sections stained with angiogenesis marker, CD34, from ceranib-2-injected mice compared to DMSO (D = decidua, S = spongy layer, L = labyrinth). (D) Placental ceramide levels in mice injected with either ceranib-2 or D-NMAPPD compared to DMSO. (DMSO, n = 7; Ceranib-2, n = 13; D-NMAPPD, n = 4 *P < 0.05). (E) MCL1, BOK and LC3B-II expression in pregnant mice injected with D-NMAPPD compared to DMSO vehicle.
Figure 7.
Figure 7.
Ceramide triggers autophagy in JEG3 cells. (A) LC3B-II, SQSTM1 and cleaved CASP3 (ClCASP3) protein expression in JEG3 cells treated with C16 CER or vehicle (C). (B) Autophagy markers, LC3B-II, BECN1, and SQSTM1, in JEG3 cells cultured with ASAH1 inhibitor 2-OE (25 μM or 100 μM) or control vehicle (C). (C) Representative transmission electron micrographs of JEG3 cells treated with C16 CER or 100 μM 2-OE compared to control vehicle. Autophagy is shown by increased number of lysosomes (arrows) and formation of autophagosomal structures (arrowheads). N, nucleus. Scale bars: 2 μm. (D) JEG3 cells treated with C16 CER or 2-OE were labeled with LysoTracker® Red and stained for LC3B. LC3B (green), LysoTracker® Red and nuclear DAPI (blue). (E) LC3B-II expression in JEG3 cells treated with C16 CER (upper panel) or 2-OE (middle panel) in the presence and absence of bafilomycin A1 (Baf A1) or of 3-methyladenine (3-MA; lower panel). (F) MCL1 and BOK expression in JEG3 cells treated with 20 μM or 50 μM C16 CER (upper panel) or 25 or 50 μM 2-OE (lower panel).

Similar articles

Cited by

References

    1. Hannun YA, Obeid LM. Principles of bioactive lipid signalling: lessons from sphingolipids. Nat Rev Mol Cell Biol 2008; 9:139-50; PMID:18216770; http://dx.doi.org/10.1038/nrm2329 - DOI - PubMed
    1. Hannun YA. Functions of ceramide in coordinating cellular responses to stress. Science 1996; 274:1855-9; PMID:8943189; http://dx.doi.org/10.1126/science.274.5294.1855 - DOI - PubMed
    1. Ferlinz K, Kopal G, Bernardo K, Linke T, Bar J, Breiden B, Neumann U, Lang F, Schuchman EH, Sandhoff K. Human acid ceramidase: processing, glycosylation, and lysosomal targeting. J Biol Chem 2001; 276:35352-60; PMID:11451951; http://dx.doi.org/10.1074/jbc.M103066200 - DOI - PubMed
    1. Ferlinz K, Hurwitz R, Moczall H, Lansmann S, Schuchman EH, Sandhoff K. Functional characterization of the N-glycosylation sites of human acid sphingomyelinase by site-directed mutagenesis. Eur J Biochem 1997; 243:511-7; PMID:9030779; http://dx.doi.org/10.1111/j.1432-1033.1997.511_1a.x - DOI - PubMed
    1. Jenkins RW, Idkowiak-Baldys J, Simbari F, Canals D, Roddy P, Riner CD, Clarke JC, Hannun YA. A novel mechanism of lysosomal acid sphingomyelinase maturation: requirement for carboxyl-terminal proteolytic processing. J Biol Chem 2011; 286:3777-88; PMID:21098024; http://dx.doi.org/10.1074/jbc.M110.155234 - DOI - PMC - PubMed

Publication types