

doi: 10.1186/s13059-015-0611-7.
Average genome size estimation improves comparative metagenomics and sheds light on the functional ecology of the human microbiome
- PMID: 25853934
- PMCID: PMC4389708
- DOI: 10.1186/s13059-015-0611-7
Item in Clipboard
Average genome size estimation improves comparative metagenomics and sheds light on the functional ecology of the human microbiome
Genome Biol.
.
Abstract
Average genome size is an important, yet often overlooked, property of microbial communities. We developed MicrobeCensus to rapidly and accurately estimate average genome size from shotgun metagenomic data and applied our tool to 1,352 human microbiome samples. We found that average genome size differs significantly within and between body sites and tracks with major functional and taxonomic differences. In the gut, average genome size is positively correlated with the abundance of Bacteroides and genes related to carbohydrate metabolism. Importantly, we found that average genome size variation can bias comparative analyses, and that normalization improves detection of differentially abundant genes.
Figures
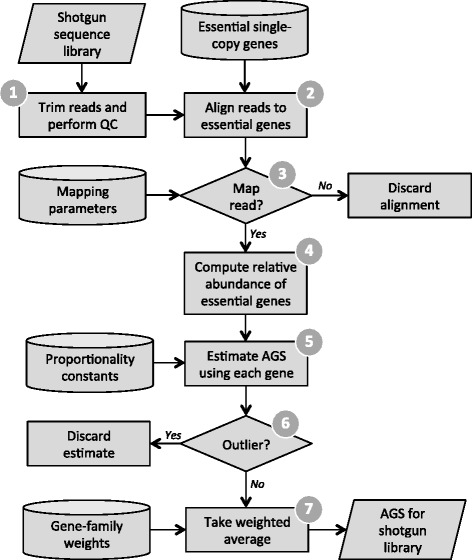
Flowchart for estimating AGS from a shotgun metagenome. 1) MicrobeCensus takes the first n reads of at least i base pairs from the shotgun metagenome and trims these reads down to i base pairs. 2) These reads are aligned against the database of essential genes using RAPsearch2. 3) A read is mapped to an essential gene family, j, if its top scoring alignment satisfies the mapping parameters, which are optimized for gene j and read length i. 4) Based on these mapped reads, the relative abundance of each essential gene family, R
j, is computed. 5) Next, we use R
j to obtain an estimate of AGS for each gene. 6) Outlier predictions are removed and 7) MicrobeCensus takes a weighted average over the remaining estimates to produce a robust estimate of AGS for the shotgun metagenome. QC, quality control.
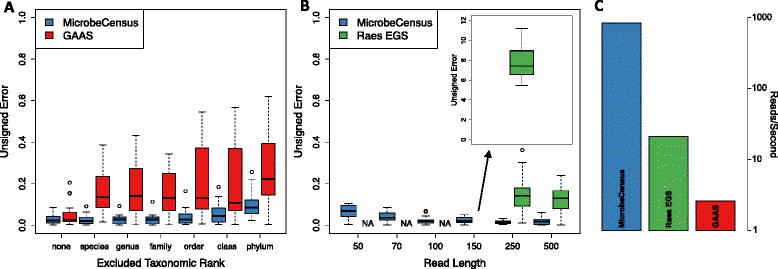
Comparison of MicrobeCensus to existing methods. (A,B) Performance of MicrobeCensus was compared with that of existing methods using 20 simulated metagenomes. Unsigned error is defined as: |AĜS - AGS|/AGS. (A) MicrobeCensus versus GAAS at different levels of taxonomic exclusion. To simulate the presence of novel taxa, we held back reference sequences belonging to organisms from the same taxonomic group as organisms in the metagenome, which is indicated on the x-axis. 'None' indicates that no reference sequences were held back. Metagenomes were composed of 100-bp reads. (B) Estimation error for MicrobeCensus versus the method described by Raes et al. [9] for metagenomes of various read length. 'NA' indicates that AGS could not be estimated. (C) Speed (reads/second) of MicrobeCensus compared with existing methods on a simulated 150-bp library.
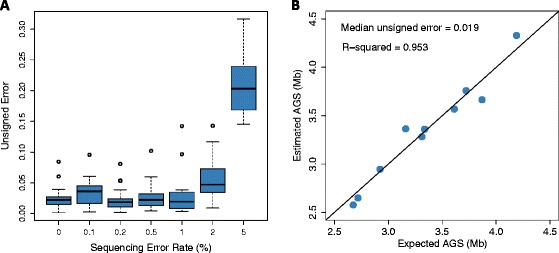
The effect of sequencing error on estimation accuracy. Unsigned error is defined as: |AĜS - AGS|/AGS. (A) MicrobeCensus was used to estimate the AGS of 20 metagenomes that were simulated with up to a 5% sequencing error rate. Metagenomes were composed of 100-bp reads from prokaryotes. (B) MicrobeCensus was used to estimate the AGS of 10 metagenomes that were composed of real Illumina reads pooled from 10 randomly chosen isolate sequencing projects.
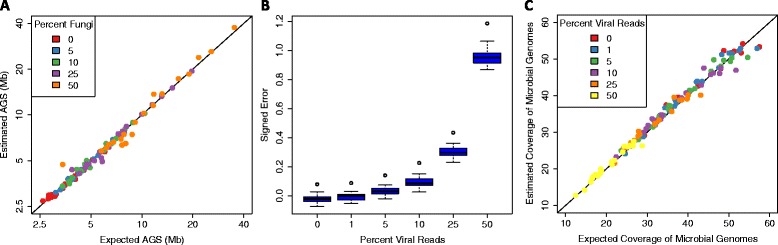
Estimation accuracy in the presence of microbial eukaryotes and viruses. (A) MicrobeCensus was used to estimate the AGS of 20 simulated 100-bp metagenomes that contained up to 50% of Fungi, representing up to 94% of total reads. Note that axes are plotted on a log scale. (B) MicrobeCensus was used to estimate the AGS of 20 simulated 100-bp metagenomes that contained up to 50% of reads from viruses. Signed error is defined as: (AĜS - AGS)/AGS. (C) AGS estimates from (B) were used to estimate the total coverage of microbial genomes present in the simulated metagenomes. Estimated coverage of microbial genomes was obtained by dividing the number of total base pairs in a metagenome by the estimated AGS for that metagenome.
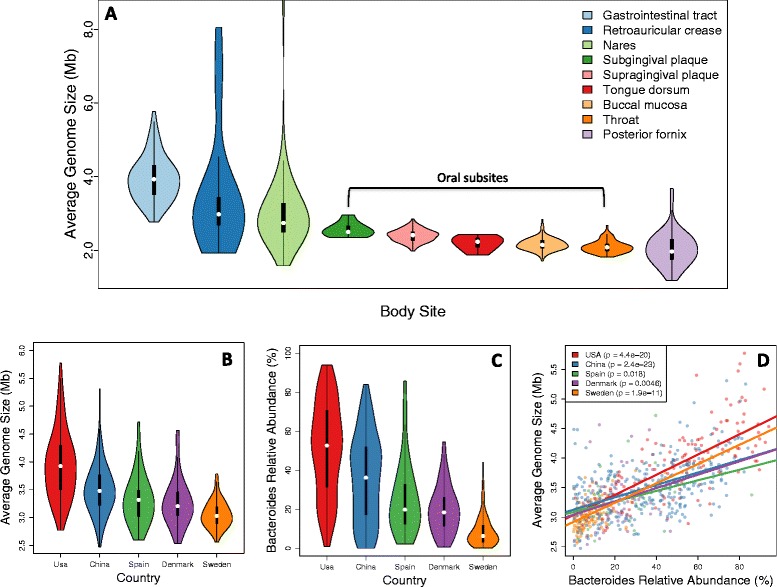
Average genome size varies systematically in human microbiome data. (A) Distribution of estimated AGS for 736 samples from the Human Microbiome Project. (B) Distribution of estimated AGS for 725 stool samples obtained from subjects originating from five different countries. (C) Estimated relative abundance of Bacteroides for the same samples shown in (B). (D) Country-specific correlations between AGS and Bacteroides relative abundance for stool samples.
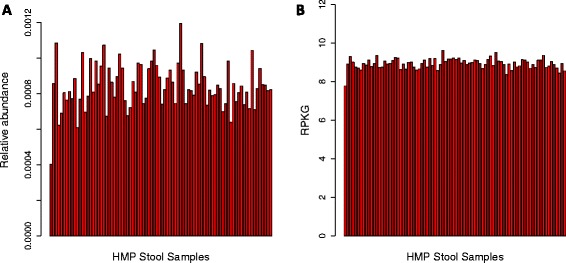
MicrobeCensus enables accurate quantification of gene family abundance. Each plot shows the median abundance of essential single-copy genes across 84 stool samples from the HMP. (A) Gene family abundance was computed using relative abundance, which is scaled so the abundance of all genes sums to 1.0 for each sample. (B) Gene family abundance was computed using RPKG (reads per kilobase per genome equivalent). RPKG leverages estimates of AGS made by MicrobeCensus to normalize gene family abundance values.
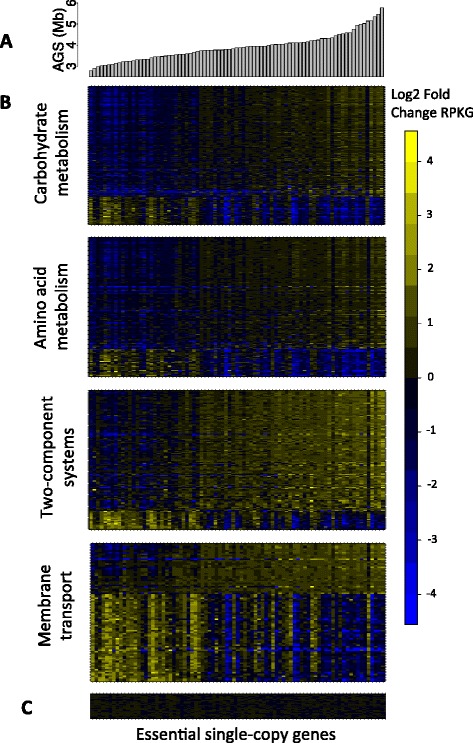
Average genome size reflects diverse modes of functional adaptation in the gut microbiome. (A) Barplot of AGS for stool metagenomes. (B) Log2 fold change of KOs across stool metagenomes. KOs were grouped according to the BRITE functional hierarchy. Only KOs that were significantly correlated with AGS (q < 1e-3) are displayed. (C) Log2 fold change of essential single-copy KOs across stool metagenomes.
Similar articles
-
Metagenomic binning and association of plasmids with bacterial host genomes using DNA methylation.Nat Biotechnol. 2018 Jan;36(1):61-69. doi: 10.1038/nbt.4037. Epub 2017 Dec 11. Nat Biotechnol. 2018. PMID: 29227468 Free PMC article.
-
Use of whole genome shotgun metagenomics: a practical guide for the microbiome-minded physician scientist.Semin Reprod Med. 2014 Jan;32(1):5-13. doi: 10.1055/s-0033-1361817. Epub 2014 Jan 3. Semin Reprod Med. 2014. PMID: 24390915 Review.
-
Functional Metagenomics of the Bronchial Microbiome in COPD.PLoS One. 2015 Dec 3;10(12):e0144448. doi: 10.1371/journal.pone.0144448. eCollection 2015. PLoS One. 2015. PMID: 26632844 Free PMC article.
-
Automated and Accurate Estimation of Gene Family Abundance from Shotgun Metagenomes.PLoS Comput Biol. 2015 Nov 13;11(11):e1004573. doi: 10.1371/journal.pcbi.1004573. eCollection 2015 Nov. PLoS Comput Biol. 2015. PMID: 26565399 Free PMC article.
-
Application of metagenomics in the human gut microbiome.World J Gastroenterol. 2015 Jan 21;21(3):803-14. doi: 10.3748/wjg.v21.i3.803. World J Gastroenterol. 2015. PMID: 25624713 Free PMC article. Review.
Cited by
-
The coral Oculina patagonica holobiont and its response to confinement, temperature, and Vibrio infections.Microbiome. 2024 Oct 29;12(1):222. doi: 10.1186/s40168-024-01921-x. Microbiome. 2024. PMID: 39472959 Free PMC article.
-
Extremely halophilic brine community manipulation shows higher robustness of microbiomes inhabiting human-driven solar saltern than naturally driven lake.mSystems. 2024 Jul 23;9(7):e0053824. doi: 10.1128/msystems.00538-24. Epub 2024 Jun 27. mSystems. 2024. PMID: 38934645 Free PMC article.
-
Fast and accurate average genome size and 16S rRNA gene average copy number computation in metagenomic data.BMC Bioinformatics. 2019 Sep 5;20(1):453. doi: 10.1186/s12859-019-3031-y. BMC Bioinformatics. 2019. PMID: 31488068 Free PMC article.
-
A most wanted list of conserved microbial protein families with no known domains.PLoS One. 2018 Oct 17;13(10):e0205749. doi: 10.1371/journal.pone.0205749. eCollection 2018. PLoS One. 2018. PMID: 30332487 Free PMC article.
-
Resistome expansion in disease-associated human gut microbiomes.Microbiome. 2023 Jul 29;11(1):166. doi: 10.1186/s40168-023-01610-1. Microbiome. 2023. PMID: 37507809 Free PMC article.
References
Publication types
MeSH terms
Grants and funding
LinkOut - more resources
Full Text Sources
Other Literature Sources
