

Automatic Dendritic Length Quantification for High Throughput Screening of Mature Neurons
- PMID: 25854493
- PMCID: PMC4600005
- DOI: 10.1007/s12021-015-9267-4
Automatic Dendritic Length Quantification for High Throughput Screening of Mature Neurons
Abstract
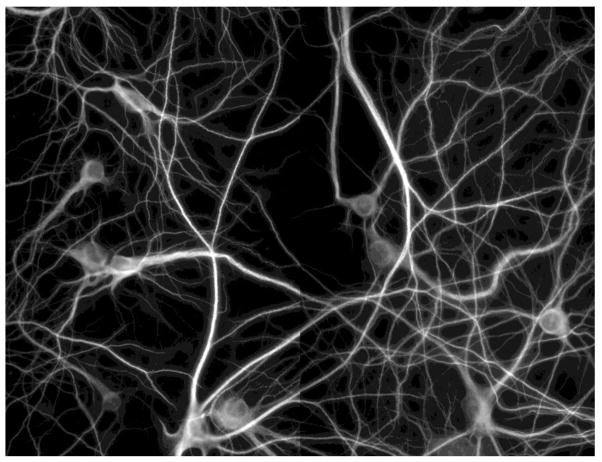
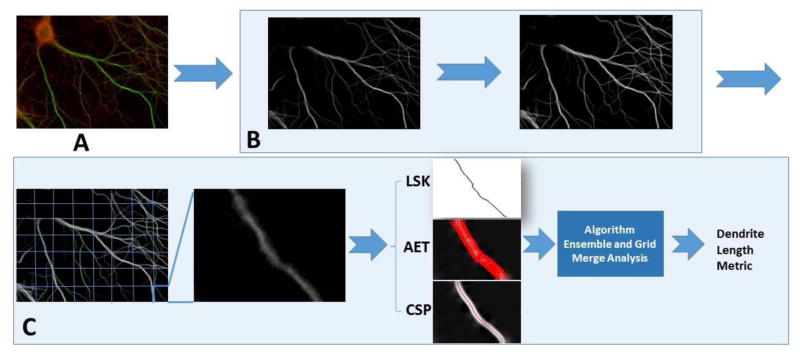
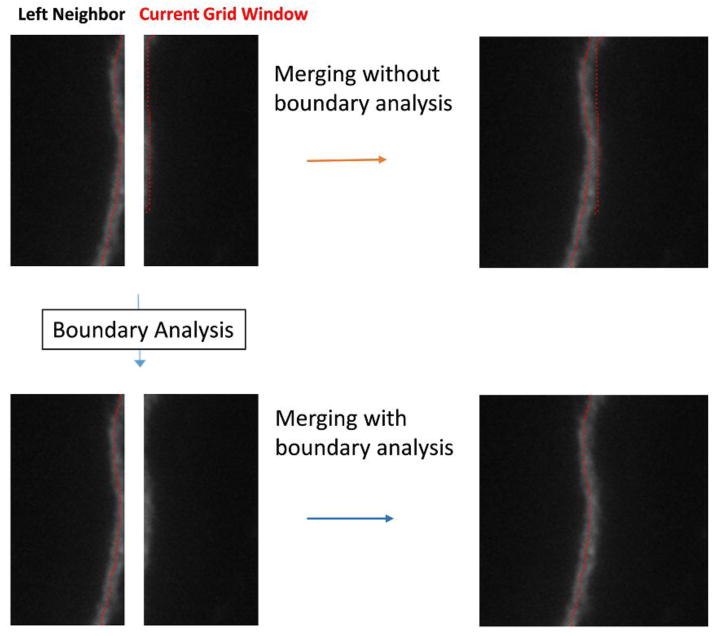
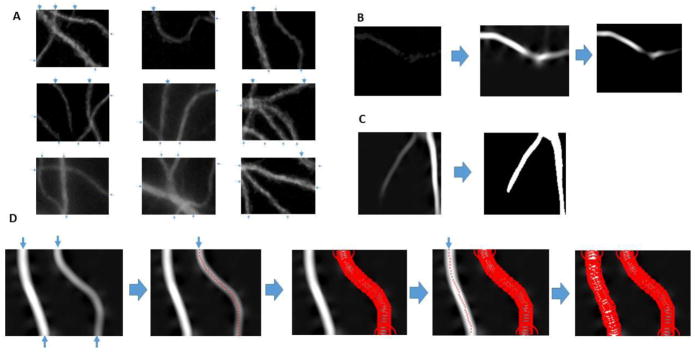
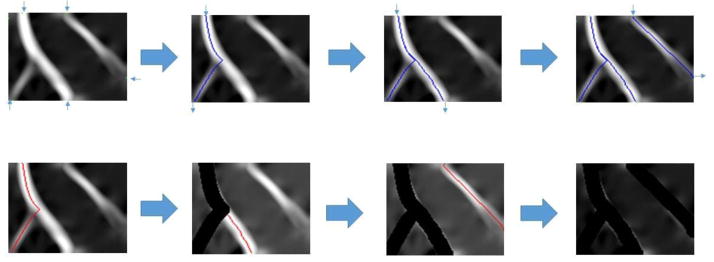
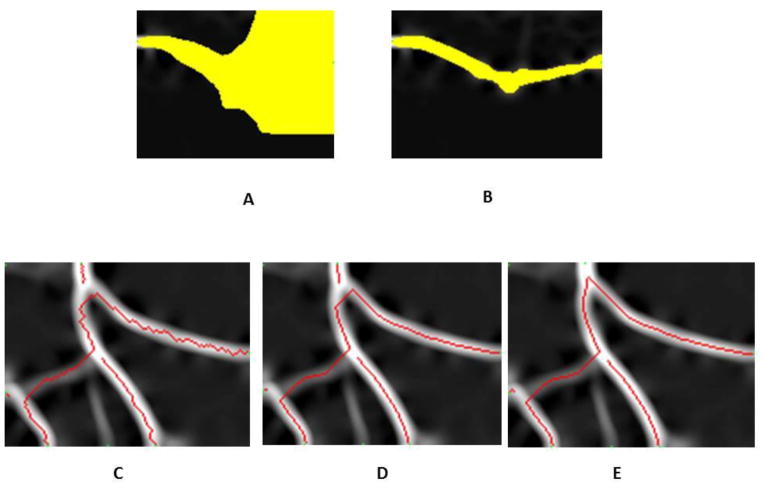
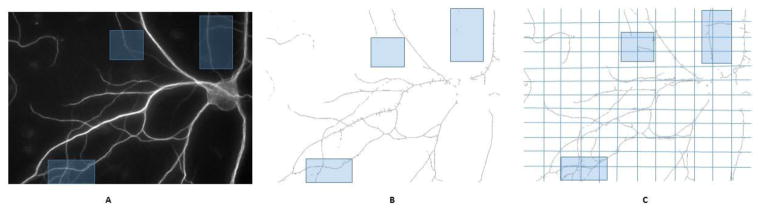
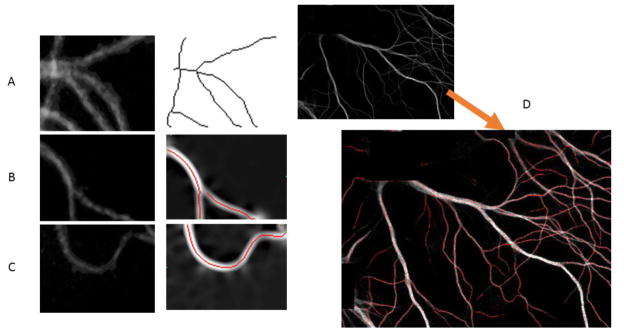
High-throughput automated fluorescent imaging and screening are important for studying neuronal development, functions, and pathogenesis. An automatic approach of analyzing images acquired in automated fashion, and quantifying dendritic characteristics is critical for making such screens high-throughput. However, automatic and effective algorithms and tools, especially for the images of mature mammalian neurons with complex arbors, have been lacking. Here, we present algorithms and a tool for quantifying dendritic length that is fundamental for analyzing growth of neuronal network. We employ a divide-and-conquer framework that tackles the challenges of high-throughput images of neurons and enables the integration of multiple automatic algorithms. Within this framework, we developed algorithms that adapt to local properties to detect faint branches. We also developed a path search that can preserve the curvature change to accurately measure dendritic length with arbor branches and turns. In addition, we proposed an ensemble strategy of three estimation algorithms to further improve the overall efficacy. We tested our tool on images for cultured mouse hippocampal neurons immunostained with a dendritic marker for high-throughput screen. Results demonstrate the effectiveness of our proposed method when comparing the accuracy with previous methods. The software has been implemented as an ImageJ plugin and available for use.
Keywords: Automatic quantification; High-throughput screening; Neuron dendrite.
Conflict of interest statement
Figures
References
-
- Al-Ali H, Blackmore M, Bixby JL, Lemmon VP. Assay Guidance Manual. Bethesda: Eli Lilly & Company and the National Center for Advancing Translational Sciences; 2013. High Content Screening with Primary Neurons. - PubMed
-
- Al-Kofahi KA, Lasek S, Szarowski DH, Pace CJ, Nagy G, Turner JN, Roysam B. Rapid Automated Three-Dimensional Tracing of Neurons From Confocal Image Stacks. IEEE transactions on information technology in biomedicine. 2002;6(2):171–187. - PubMed
-
- Arias-Castro E, Donoho DL. Does Median Filtering Truly Preserve Edges? The Annals of Statistics. 2009;37(3):1172–1206.
-
- Becker L, Armstrong D, Chan F. Dendritic atrophy in children with Down’s syndrome. Annals of neurology. 1986;10(10):981–991. - PubMed
-
- Brewer GJ, Cotman CW. Survival and growth of hippocampal neurons in defined medium at low density: advantages of a sandwich culture technique or low oxygen. Brain research. 1989;494:65–74. - PubMed
Publication types
MeSH terms
Grants and funding
LinkOut - more resources
Full Text Sources
Other Literature Sources
