. 2015 Aug;62(2):600-14.
doi: 10.1002/hep.27841. Epub 2015 May 29.

Damage-associated molecular pattern-activated neutrophil extracellular trap exacerbates sterile inflammatory liver injury

Affiliations

Damage-associated molecular pattern-activated neutrophil extracellular trap exacerbates sterile inflammatory liver injury

Hai Huang et al. Hepatology. 2015 Aug.

Abstract

Innate immunity plays a crucial role in the response to sterile inflammation such as liver ischemia/reperfusion (I/R) injury. The initiation of liver I/R injury results in the release of damage-associated molecular patterns, which trigger an innate immune and inflammatory cascade through pattern recognition receptors. Neutrophils are recruited to the liver after I/R and contribute to organ damage and innate immune and inflammatory responses. Formation of neutrophil extracellular traps (NETs) has been recently found in response to various stimuli. However, the role of NETs during liver I/R injury remains unknown. We show that NETs form in the sinusoids of ischemic liver lobes in vivo. This was associated with increased NET markers, serum level of myeloperoxidase-DNA complexes, and tissue level of citrullinated-histone H3 compared to control mice. Treatment with peptidyl-arginine-deiminase 4 inhibitor or DNase I significantly protected hepatocytes and reduced inflammation after liver I/R as evidenced by inhibition of NET formation, indicating the pathophysiological role of NETs in liver I/R injury. In vitro, NETs increase hepatocyte death and induce Kupffer cells to release proinflammatory cytokines. Damage-associated molecular patterns, such as High Mobility Group Box 1 and histones, released by injured hepatocytes stimulate NET formation through Toll-like receptor (TLR4)- and TLR9-MyD88 signaling pathways. After neutrophil depletion in mice, the adoptive transfer of TLR4 knockout or TLR9 knockout neutrophils confers significant protection from liver I/R injury with a significant decrease in NET formation. In addition, we found inhibition of NET formation by the peptidyl-arginine-deiminase 4 inhibitor and that DNase I reduces High Mobility Group Box 1 and histone-mediated liver I/R injury.

Conclusion: Damage-associated molecular patterns released during liver I/R promote NET formation through the TLR signaling pathway. Development of NETs subsequently exacerbates organ damage and initiates inflammatory responses during liver I/R.


Figures

Figure 1
Figure 1
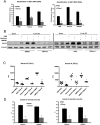
Liver I/R induces NET formation. (A) NETs form after either 1 hour or 1.5 hour ischemia time followed by 6 hours reperfusion, or after 1 hour ischemia time followed by 1 hour, 3 hours, 6 hours, or 24 hours of reperfusion, as assessed by serum level of MPO-DNA complex. Results are expressed as the relative folds increase of MPO-DNA complex compared with sham; mean ± SE (n=6). *P<0.05 versus sham. (B) Representative immunofluorescence images by confocal microscopy of liver sections after 60 min ischemia and 6 h reperfusion in mice (magnification ×40; n=6) with staining for Ly6G (red), nuclei (blue), histone H2AX (green), and F-actin (gray). Arrows: released histone H2AX from neutrophils. (C) Three-dimensional reconstructed image of Cit-H3-positive cells associated with Ly6G antigen. Liver sections after 60 min of ischemia and 6 hours of reperfusion in mice (magnification ×40; n=6) with staining for Ly6G (red), nuclei (blue), Cit-histone H3 (green), and F-actin (gray). (D) Representative 2-photon microscopy images reveal DNA expulsion from neutrophils in real-time after liver I/R with SYTOX Green staining in LysMeGFP knockin mice compared with sham LysMeGFP knockin mice. Green: SYTOX Green; red: neutrophil; blue: sinusoids. Arrows: released DNA from neutrophils. (E) Cit-histone H3 protein levels were determined by Western blot in sham-treated mice and mice that underwent 1 hour or 1.5 hour ischemia followed by 6 hours reperfusion, or 1 hour ischemia followed by 1 hour, 3 hours, 6 hours, and 24 hours of reperfusion. For Western blotting results, each lane represents a separate animal. The blots shown are representative of three experiments with similar results.
Figure 2
Figure 2
Inhibition of NET formation by PAD4 inhibitors (YW3-56 or YW4-03) or DNase I protects the liver from I/R injury in mice. (A) Serum MPO-DNA complex levels were assessed in control-, YW3-56-, YW4-03-, or DNase I-treated mice after either sham laparotomy or 1 hour of ischemia and 6 hours of reperfusion. Data represent the mean ± SE (n = 6). *P < 0.05 vs. DMSO-treated group after liver I/R. **P < 0.05 vs. controltreated group after liver I/R. (B) Cit-H3 protein levels were determined by Western blot in control-, YW3-56- , YW4-03-, or DNase I treated-mice after 1 hour of ischemia and 6 hours of reperfusion. Hepatic protein lysates from ischemic lobes were obtained; each lane represents a separate animal. The blots shown are representative of three experiments with similar results. (C) Serum ALT levels were assessed in control-, YW3-56-, YW4-03-, or DNase I-treated mice after either sham laparotomy or 1 hour of ischemia and 6 hours of reperfusion. Data represent the mean ± SE (n = 6). *P < 0.05 vs. DMSO-treated group after liver I/R. **P < 0.05 vs. control-treated group after liver I/R. (D) Quantification of necrotic hepatocytes in H&Estained liver sections from control-, YW3-56-, YW4-03-, or DNase I-treated mice 6 hours after reperfusion. *P < 0.05 vs. DMSO-treated group after liver I/R. **P < 0.05 vs. control-treated group after liver I/R.
Figure 3
Figure 3
NETs damage hepatocytes and initiate inflammatory responses both in vitro and in vivo. (A) Cell damage, as measured by flow cytometry for propidium iodide (PI) staining, in normal primary hepatocytes cultured for 4 hours with media from PMA-stimulated neutrophils or from non-stimulated neutrophils. (B) mRNA levels of TNF-α, IL-6, IL-1β and MCP-1, CXCL10 were determined in normal KCs cultured for 4 hours with media from PMA-stimulated neutrophils or from non-stimulated neutrophils. Results are expressed as the relative increase of mRNA expression compared with sham group. *P < 0.05 compared to control neutrophil media group. (C) Cell damage, as measured by flow cytometry for PI staining, in hepatocytes obtained from control-, YW4-03-, or DNase I-treated mice after 1 hour of ischemia and 6 hours of reperfusion. (D) Tissue mRNA levels of TNF-α, IL-6, IL-1β and MCP-1 were determined in control-, YW3-56-, YW4-03-, or DNase Itreated mice after 1 hour of ischemia and 6 hours of reperfusion. Results are expressed as the relative increase of mRNA expression compared with sham group. *P < 0.05 compared to control-treated liver I/R group. Data represent the mean ± SE and are representative of three experiments with similar results.
Figure 4
Figure 4
Histones and HMGB1 induce NET formation. (A) Media level of MPO-DNA complex was assessed for NET formation after stimulation by negative control normal media, positive control PMA, conditioned media from necrotic hepatocytes, conditioned media from hypoxic hepatocytes for 4 hours in normal neutrophils. Results are expressed as the relative fold increase of MPO-DNA complex from three experiments compared with negative control. *P<0.05 when compared with negative control. (B) Cithistone H3 protein levels wereobtained from WT neutrophils stimulated with exogenous histones at dosages ranging from 0 to 50 μg/mL for 4 hours or with rHMGB1 at dosages ranging from 0 to 5 μg/mL for 4 hours. (C) Immunofluorescent staining of NETs was assessed by confocal microscopy in neutrophils co-cultured with exogenous histones (25 μg/mL), or rHMGB1 (1 μg/mL) for 4 hours or PMA respectively, or co-stimulated with histones or HMGB1 together with YW3-56, YW4-03 or DNase I. Blue: nuclei; green: cit-histone H3; red: F-actin. (D) NETs were identified by 2-photon microscopy in the representative images of NETs generated 4 hours by stimulation of histones and HMGB1 with SYTOX Green staining. Yellow: SYTOX Green. Arrows: released DNA from neutrophils. Results shown are representative of three experiments with similar results.
Figure 5
Figure 5
Histones and HMGB1 induce NET formation through TLR9 or TLR4 signaling. (A) Cit-H3 protein levels were determined by Western blot in WT control, TLR4 KO, TLR9 KO or TLR4/TLR9 double KO neutrophils stimulated with negative control PBS, or exogenous histones (25 μg/mL) for 4 hours. (B) Cit-H3 protein levels were determined by Western blot in WT control, TLR4 KO, TLR9 KO or TLR4/TLR9 double KO neutrophils stimulated with negative control PBS, or rHMGB1 (1 μg/mL) for 4 hours. (C) Immunofluorescent stain of NETs was assessed by confocal microscopy in TLR4 WT or TLR4 KO, TLR9 WT or TLR9 KO neutrophils co-cultured for 4 hours with exogenous histones or rHMGB1. Figure is representative of three experiments with similar results. Blue: nuclei; green: cit-histone H3; red: F-actin. (D) Media level of MPODNA complex was assessed as NETs formation after stimulation by negative control PBS, positive control PMA, exogenous histones (25 μg/mL), rHMGB1 (1 μg/mL) for 4 hours in WT, TLR4 KO, TLR9 KO neutrophils. Results are expressed as the relative fold increase of MPO-DNA complex from three experiments compared with negative control. *P<0.05 when compared with sham. The blots shown are representative of three experiments with similar results.
Figure 6
Figure 6
(A) Cit-H3 protein levels were determined by Western blot in PBS- or rHMGB1- or histone-treated TLR4 WT or TLR4 KO mice 6 hours after reperfusion. Hepatic protein lysates from ischemic lobes were obtained; each lane represents a separate animal. (B) Cit-H3 protein levels were determined by Western blot in PBS- or HMGB1- or histone-treated TLR9 WT or TLR9 KO mice 6 hours after reperfusion. Hepatic protein lysates from ischemic lobes were obtained; each lane represents a separate animal. (C) Cit-H3 protein levels were determined by Western blot in PBS- or histones-, or rHMGb1 treated MyD88 WT or MyD88 KO mice 6 hours after reperfusion. Hepatic protein lysates from ischemic lobes were obtained; each lane represents a separate animal. (D) Serum MPO-DNA complex levels and Cit-H3 protein levels were assessed in neutrophildepleted- WT mice, and neutrophil-depleted-WT mice with adoptive transfer of WT, TLR4 KO, or TLR9 KO neutrophils after either sham laparotomy or 1 h of ischemia and 6 h of reperfusion. Data represent the mean ± SE (n = 6 mice per group). *P < 0.05 vs. WT neutrophil adoptive transferred-WT group after liver I/R. (E) Serum ALT levels were assessed in neutrophil-depleted-WT mice, and neutrophil-depleted-WT mice with adoptive transfer of WT, TLR4 KO, or TLR9 KO neutrophils after either sham laparotomy or 1 hour of ischemia and 6 hours of reperfusion. Data represent the mean ± SE (n = 6 mice per group). *P < 0.05 vs. WT neutrophils adoptive transferred-WT group after liver I/R. (F) Quantification of necrotic hepatocytes in H&E-stained liver sections (Supplementary Figure 6) from neutrophil-depleted-WT mice, and neutrophildepleted WT mice with adoptive transfer of WT, TLR4 KO, or TLR9 KO neutrophils after either sham laparotomy or 1 hour of ischemia and 6 hours of reperfusion. The graph is representative of liver sections from six mice per group. *P < 0.05 vs. WT neutrophils adoptive transferred-WT group after liver I/R. The blots shown are representative of three experiments with similar results.
Figure 7
Figure 7
Inhibition of NET formation reduces HMGB1 and histone-mediated liver I/R injury. (A) Serum MPO-DNA complex levels were assessed in WT mice treated with control PBS, exogenous histones (20 mg/kg),rHMGB1 (10 μg/mouse) co-treated with control DMSO or YW4-03; or WT mice treated with control PBS,exogenous histones (20 mg/kg), rHMGB1 (10 μg/mouse) co-treated with control PBS or DNase I after 1hour of ischemia and 6 hours of reperfusion. Data represent the mean ± SE (n = 6). *P < 0.05 vs. controltreated group after liver I/R. (B) Cit-H3 levels were assessed in WT mice treated with control PBS, exogenous histones (20 mg/kg), HMGB1 (10 μg/mouse) co-treated with control DMSO or YW4-03, or WT mice treated with control PBS, exogenous histones (20 mg/kg), HMGB1 (10 μg/mouse) co-treated with control PBS or DNase I after 1 hour of ischemia and 6 hours of reperfusion. Hepatic protein lysates from ischemic lobes were obtained; each lane represents a separate animal. The blots shown are representative of three experiments with similar results. (C) Serum ALT levels were assessed in WT mice treated with control PBS, exogenous histones (20 mg/kg), HMGB1 (10 μg/mouse) co-treated with control DMSO or YW4-03, or WT mice treated with control PBS, exogenous histones (20 mg/kg), HMGB1 (10 μg/mouse) co-treated with control PBS or DNase I after 1 hour of ischemia and 6 hours of reperfusion. Data represent the mean ± SE (n = 6 mice per group). *P < 0.05 vs. control treated group after liver I/R. (D) Quantification of necrotic hepatocytes in H&E-stained liver sections from WT mice treated with control PBS, exogenous histones (20 mg/kg), HMGB1 (10 μg/mouse) co- treated with control DMSO or YW4-03, or WT mice treated with control PBS, exogenous histones (20 mg/kg), HMGB1 (10 μg/mouse) co-treated with control PBS or DNase I after 1hour of ischemia and 6 hours of reperfusion. The graph is representative of liver sections from six mice per group. *P < 0.05 vs. control treated group after liver I/R.
Figure 8
Figure 8
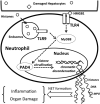
Schematic representation of DAMPs released from damaged hepatocytes inducing NET formation during liver I/R injury. During liver I/R injury, Histones and HMGB1 released from damaged hepatocytes function as DAMPs to promote PAD4 activation via Toll-like receptor (TLR4 and TLR9) signaling pathways, which subsequently activate NET formation. Development of NETs during liver I/R injury is detrimental, as NETs initiate pro-inflammatory responses.

References

    1. Kubes P, Mehal WZ. Sterile inflammation in the liver. Gastroenterology. 2012;143:1158–1172. - PubMed
    1. Klune JR, Tsung A. Molecular biology of liver ischemia/reperfusion injury: established mechanisms and recent advancements. Surg Clin North Am. 2010;90:665–677. - PubMed
    1. van Golen RF, Reiniers MJ, Olthof PB, van Gulik TM, Heger M. Sterile inflammation in hepatic ischemia/reperfusion injury: present concepts and potential therapeutics. J Gastroenterol Hepatol. 2013;28:394–400. - PubMed
    1. Huang H, Evankovich J, Yan W, Nace G, Zhang L, Ross M, Liao X, et al. Endogenous histones function as alarmins in sterile inflammatory liver injury through toll-like receptor 9. Hepatology. 2011 - PMC - PubMed
    1. Tsung A, Sahai R, Tanaka H, Nakao A, Fink MP, Lotze MT, Yang H, et al. The nuclear factor HMGB1 mediates hepatic injury after murine liver ischemia-reperfusion. J.Exp.Med. 2005;201:1135–1143. - PMC - PubMed

Publication types

MeSH terms