. 2015 Apr 8;35(14):5537-48.
doi: 10.1523/JNEUROSCI.3825-14.2015.

Single-unit activity during natural vision: diversity, consistency, and spatial sensitivity among AF face patch neurons

Affiliations

Single-unit activity during natural vision: diversity, consistency, and spatial sensitivity among AF face patch neurons

David B T McMahon et al. J Neurosci. .

Abstract

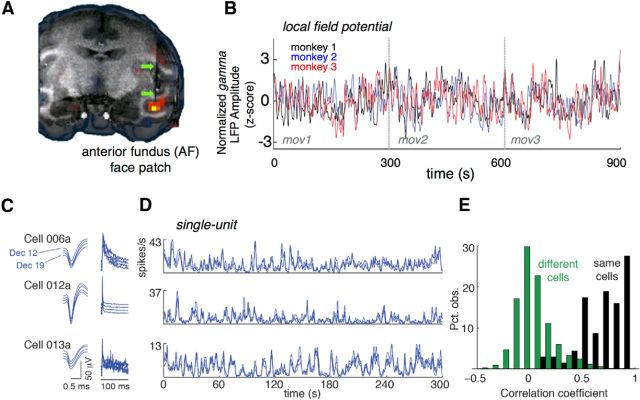
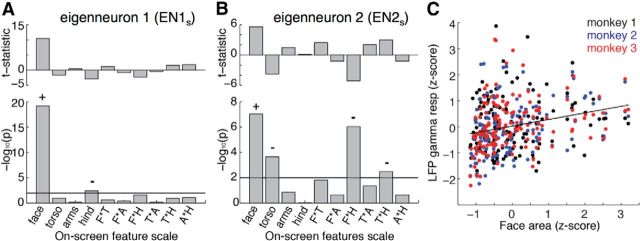
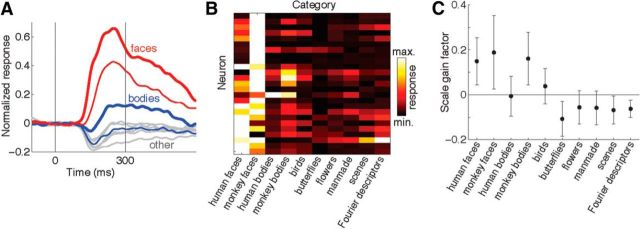
Several visual areas within the STS of the macaque brain respond strongly to faces and other biological stimuli. Determining the principles that govern neural responses in this region has proven challenging, due in part to the inherently complex stimulus domain of dynamic biological stimuli that are not captured by an easily parameterized stimulus set. Here we investigated neural responses in one fMRI-defined face patch in the anterior fundus (AF) of the STS while macaques freely view complex videos rich with natural social content. Longitudinal single-unit recordings allowed for the accumulation of each neuron's responses to repeated video presentations across sessions. We found that individual neurons, while diverse in their response patterns, were consistently and deterministically driven by the video content. We used principal component analysis to compute a family of eigenneurons, which summarized 24% of the shared population activity in the first two components. We found that the most prominent component of AF activity reflected an interaction between visible body region and scene layout. Close-up shots of faces elicited the strongest neural responses, whereas far away shots of faces or close-up shots of hindquarters elicited weak or inhibitory responses. Sensitivity to the apparent proximity of faces was also observed in gamma band local field potential. This category-selective sensitivity to spatial scale, together with the known exchange of anatomical projections of this area with regions involved in visuospatial analysis, suggests that the AF face patch may be specialized in aspects of face perception that pertain to the layout of a social scene.

Keywords: eigenneurons; fMRI; macaque; movies; natural vision; single units.


Figures

Figure 1.
Figure 1.
Stimulus presentation paradigm. Three 5 min movies, consisting of a range of scenes extracted from nature movies, were presented to each of the three animals repeatedly. A typical recording session, in which other experiments were also conducted, involved 12–16 movie presentations.
Figure 2.
Figure 2.
Consistency of gaze behavior during movie viewing. A, Eye position as a function of time recorded from monkey 1 during eight different viewings of Movie 1 (single trials shown by gray lines; mean in black). Top, Representative movie frames with overlaid x-y plot (magenta) showing eye-position signals recorded over the preceding 14 frames (468 ms). B, Correlation matrices assessing consistency in eye position across trials for each of the three monkeys. Each element in the matrix represents the correlation coefficient obtained for a pair of trials. Sorting trials by movie revealed that the eye-movement patterns within the movies were consistent (red squares along the diagonal) but that the eye-movement patterns across movies were not (white fields off the diagonal).
Figure 3.
Figure 3.
Neural responses in AF. A, Localization of the AF face patch in monkey 3 using fMRI. The shadow of the microwire electrode bundle can be seen inside the face-selective fMRI responses in AF. B, Mean gamma band of the LFP activity recorded from three monkeys across the three concatenated movies. The time course reveals that the LFP in the three monkeys' AF face patches is similarly modulated by the movies. C, Longitudinally recorded spike waveforms (left) and interspike interval histograms (right) for three neurons recorded over 8 d in monkey 2. D, Activity of the same three neurons in C over the entire run of Movie 1. Each line represents the mean firing rate obtained on a single day (3 or 4 trials per day). While the intersession modulation for each neuron is highly similar, the movie-driven time courses are very different in the three neurons. E, Distribution of split-halves correlation coefficients obtained between odd and even trials. Sample sizes: 69 neurons (same cells) and 2346 pairs (different cells).
Figure 4.
Figure 4.
Structure in the responses of single units to movies revealed by principal components analysis. A, Heat map showing the mean responses of 69 different neurons to multiple presentations of all three 5 min movies. Each row corresponds to the modulation of a single neuron. The rows are sorted based on their decreasing PC1 eigenvalue. Horizontal lines indicate the boundaries between three groups of neurons (c1, c2, and c3) derived from the principal components analysis (see text and C). Vertical dashed lines indicate the points of concatenation of the three movies. B, Cumulative variance accounted for by all 69 principal components derived from the mean responses of 69 neurons analyzed in this study. C, Scatterplot of PC1 versus PC2 for all 69 neurons. Neurons showing similar response characteristics in A appear coarsely divided into clusters, designated as c1, c2, and c3. D, Correlation matrix of firing rate over time for 69 neurons, sorted first by membership in clusters shown in C and second by PC1 coefficient. Each element in the matrix represents the correlation coefficient in the mean firing rates of two neurons over the three movies concatenated together.
Figure 5.
Figure 5.
Scene-based comparison of spiking and movie content. A, Raster plots contrasting the spikes fired by two neurons (cell 102a from c1, and cell 114a from c3). Background colors correspond to those introduced in C. B, Classification of the 22 scenes from Movie 1 into near (red), intermediate (green), and far (blue) viewing distances. Numbers refer to the scenes whose still images are shown in C. C, The still images corresponding to the middle frame of each scene identified in B. D, Time course of first two eigenneurons (EN1, EN2) during the same scenes depicted above.
Figure 6.
Figure 6.
Detailed analysis of scene-based eigenneuron versus face area. A, For each scene in the three movies (175 scenes total) the mean area of the four body compartments (face, arm, torso, and hindquarters) was computed, forming a 175-element vector (see Materials and Methods). B, Spiking activity was similarly computed in a scene-based fashion for each cell, with the mean firing rate computed for each scene. PCA was then performed on the 69 arrays of 175-element spiking rate vectors. The resulting scene-based eigenvectors (e.g., EN1s) could then be analyzed for correspondence with the scale of the body parts, and particularly the face. C, Strong correspondence between the mean face size for each scene and scene-based eigenneuron activity.
Figure 7.
Figure 7.
Impact of on-screen feature scale on neuronal activity. A, Outcome of multivariate regression analysis modeling the influence of four main effects of on-screen feature scale (face, torso, arms, and hindquarters) plus the six combinations of pairwise interaction effects (face X torso, face X arms, etc.) on activity of the first eigenneuron. The sign of statistically significant effects (p < 0.01) is indicated by + and − marks, as determined by the sign of the t statistic (tmain) in the case of main effects and by the sign of the product of tint(tmain1 * tmain2) for interaction effects. Positive effects are associated with enhanced eigenneuron activity, and negative effects with reduced activity. While faces showed a strong and positive influence on responses of EN1s, other features showed either no influence or, in the case of hindquarters, a negative influence. B, Results of the same multivariate regression analysis applied to the second eigenneuron. Faces again showed a significant positive influence on EN2s. Weaker effects, primarily negative, were observed for torso and two interaction terms. C, Positive relation between on-screen face scale and the gamma component of the LFP. F, face; T, torso; A, arms; H, hands.
Figure 8.
Figure 8.
Category selectivity of AF neurons assessed with static images. A, Normalized population firing rate histograms for 25 AF neurons with positive responses. Red lines indicate mean population responses to monkey faces (thick line) and human faces (thin line). Blue lines indicate mean population responses to images of whole monkey bodies (thick line) and whole human bodies (thin line). Gray lines indicate responses to six other stimulus categories: birds, butterflies, flowers, man-made objects, scenes, and Fourier descriptors. B, Heat map showing mean responses of the same 25 neurons to the 10 stimulus categories. The color of each pixel indicates the mean response of single neuron evoked by all the stimuli within each category based on spikes counted within an 80–300 ms window after stimulus onset. C, Category dependency of image scale gain factor. The y-axis values indicate change in neuronal response in normalized (z-transformed) units per octave change in stimulus size. For categories with positive gain factors (such as faces and monkey bodies) larger stimuli induce stronger neuronal responses, whereas for categories with negative gain factors larger stimuli induce weaker responses.

Similar articles

Cited by

References

    1. Barraclough NE, Perrett DI. From single cells to social perception. Philos Trans R Soc Lond B Biol Sci. 2011;366:1739–1752. doi: 10.1098/rstb.2010.0352. - DOI - PMC - PubMed
    1. Bell AH, Hadj-Bouziane F, Frihauf JB, Tootell RB, Ungerleider LG. Object representations in the temporal cortex of monkeys and humans as revealed by functional magnetic resonance imaging. J Neurophysiol. 2009;101:688–700. doi: 10.1152/jn.90657.2008. - DOI - PMC - PubMed
    1. Bell AH, Malecek NJ, Morin EL, Hadj-Bouziane F, Tootell RB, Ungerleider LG. Relationship between functional magnetic resonance imaging-identified regions and neuronal category selectivity. J Neurosci. 2011;31:12229–12240. doi: 10.1523/JNEUROSCI.5865-10.2011. - DOI - PMC - PubMed
    1. Bondar IV, Leopold DA, Richmond BJ, Victor JD, Logothetis NK. Long-term stability of visual pattern selective responses of monkey temporal lobe neurons. PLoS One. 2009;4:e8222. doi: 10.1371/journal.pone.0008222. - DOI - PMC - PubMed
    1. Brainard DH. The Psychophysics Toolbox. Spat Vis. 1997;10:433–436. doi: 10.1163/156856897X00357. - DOI - PubMed

Publication types

LinkOut - more resources