. 2015 Apr 8;35(14):5724-42.
doi: 10.1523/JNEUROSCI.0632-14.2015.

α-Synuclein-independent histopathological and motor deficits in mice lacking the endolysosomal Parkinsonism protein Atp13a2

Affiliations

α-Synuclein-independent histopathological and motor deficits in mice lacking the endolysosomal Parkinsonism protein Atp13a2

Lauren R Kett et al. J Neurosci. .

Abstract

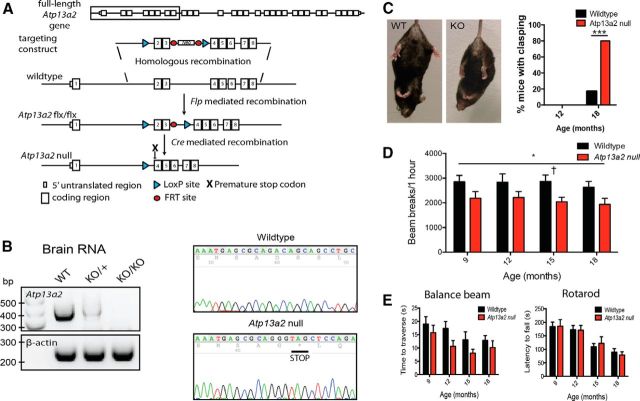
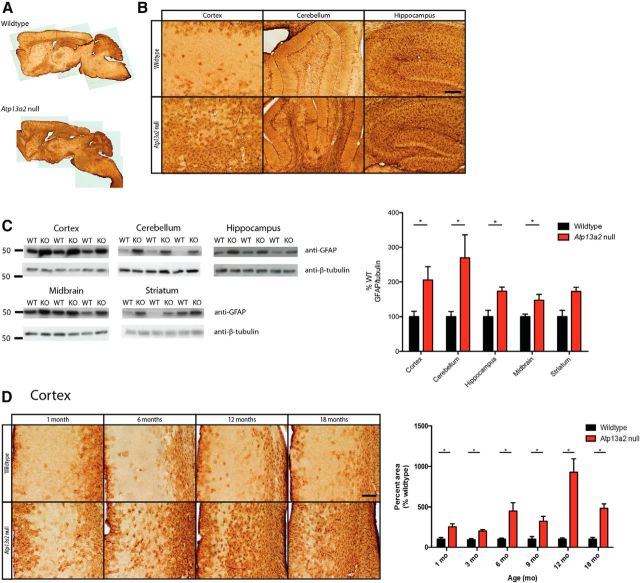
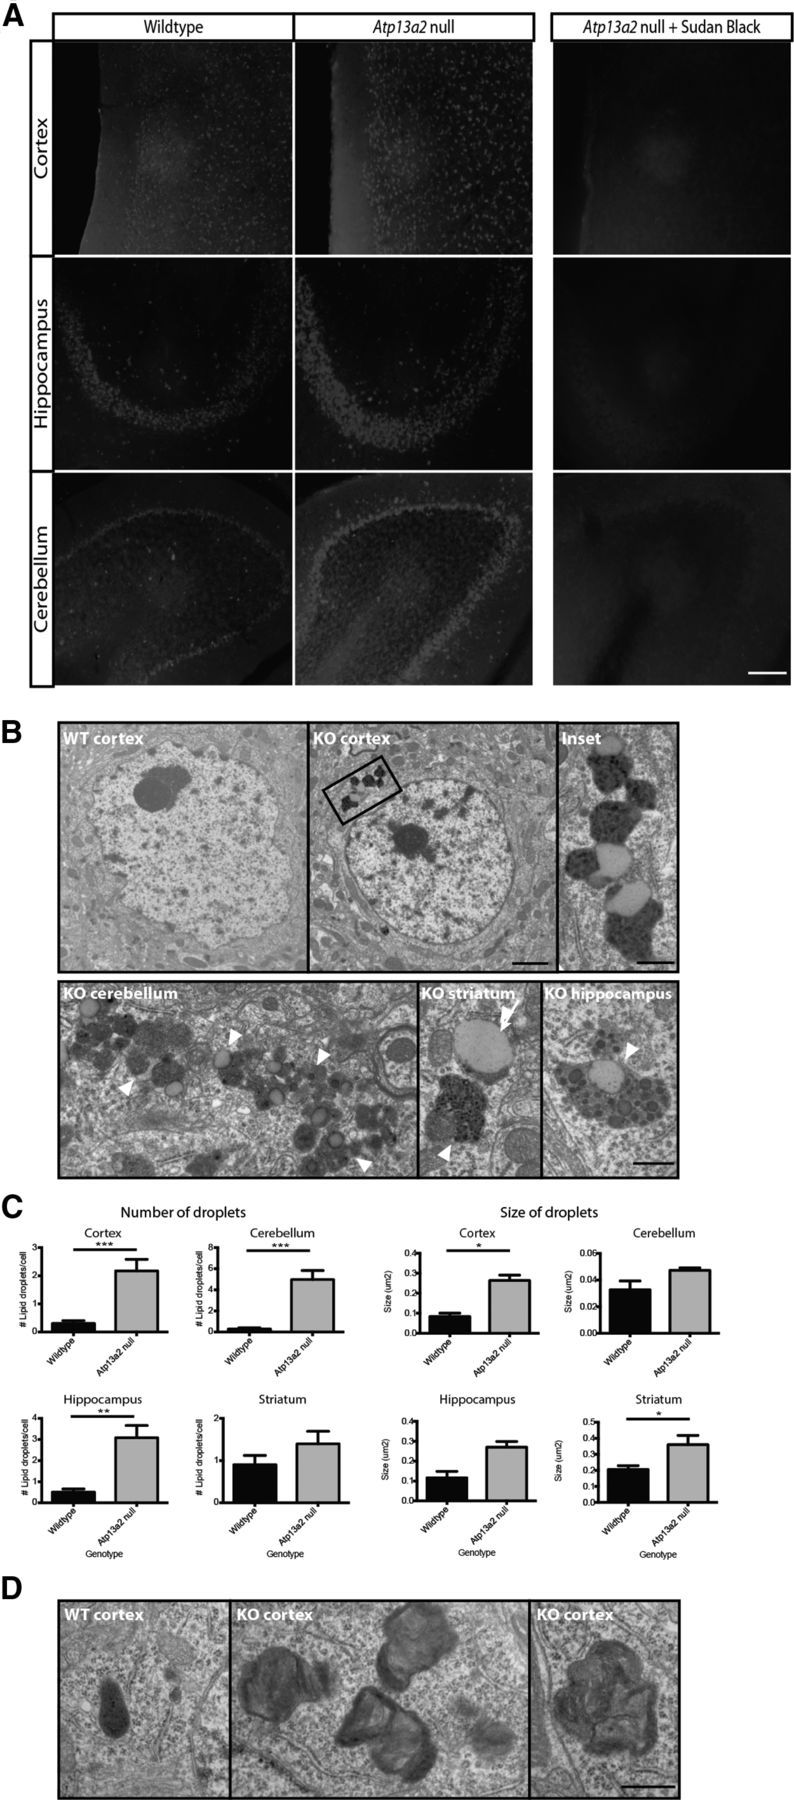
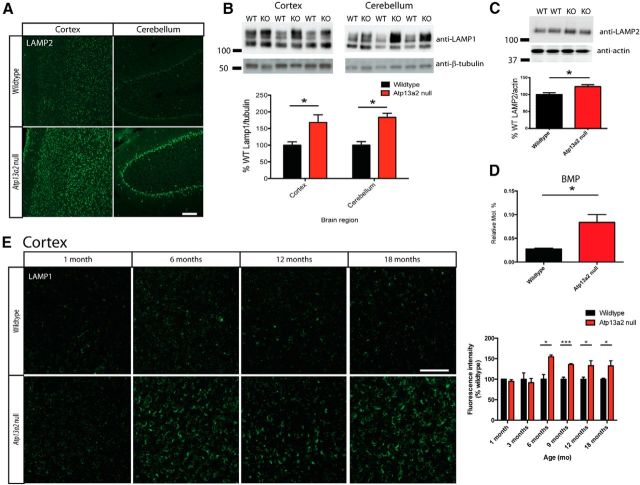
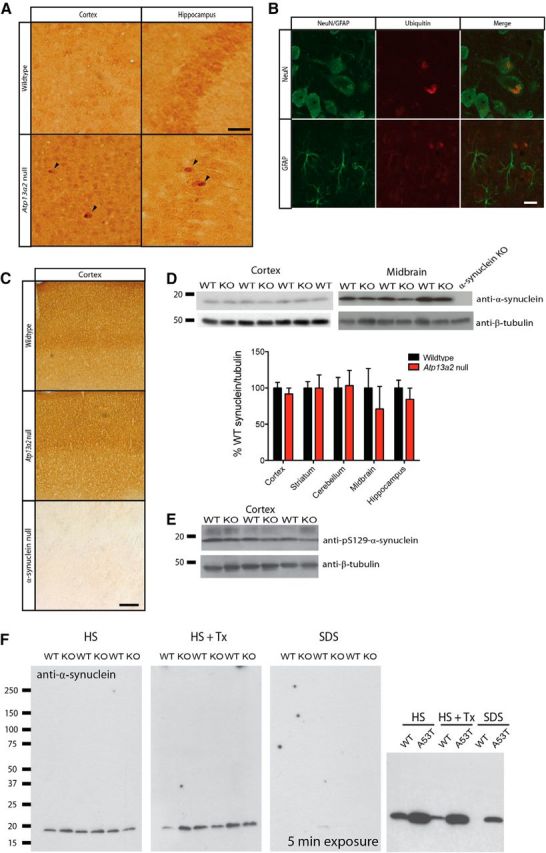
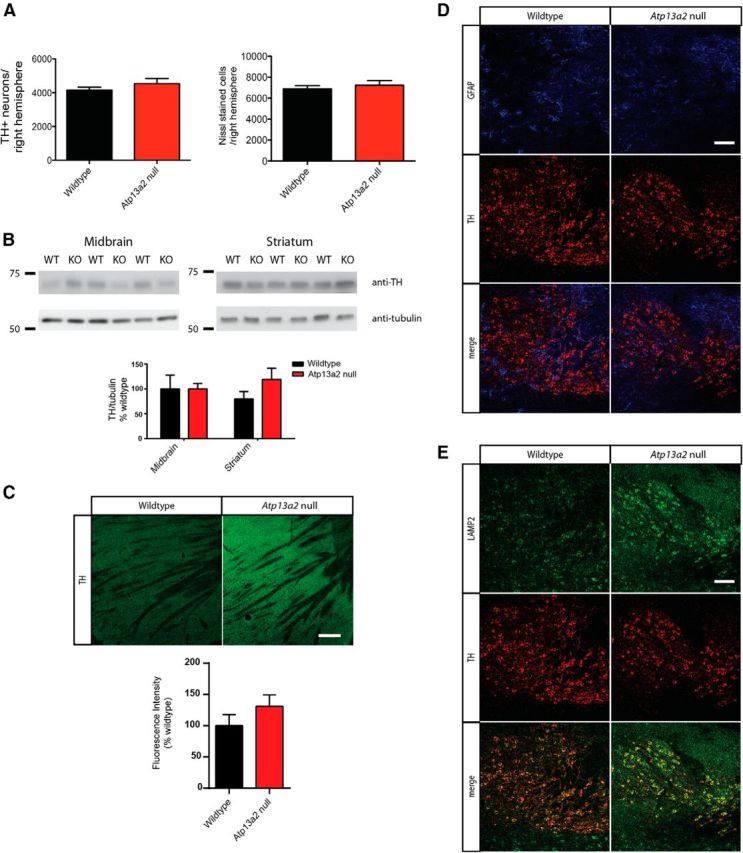
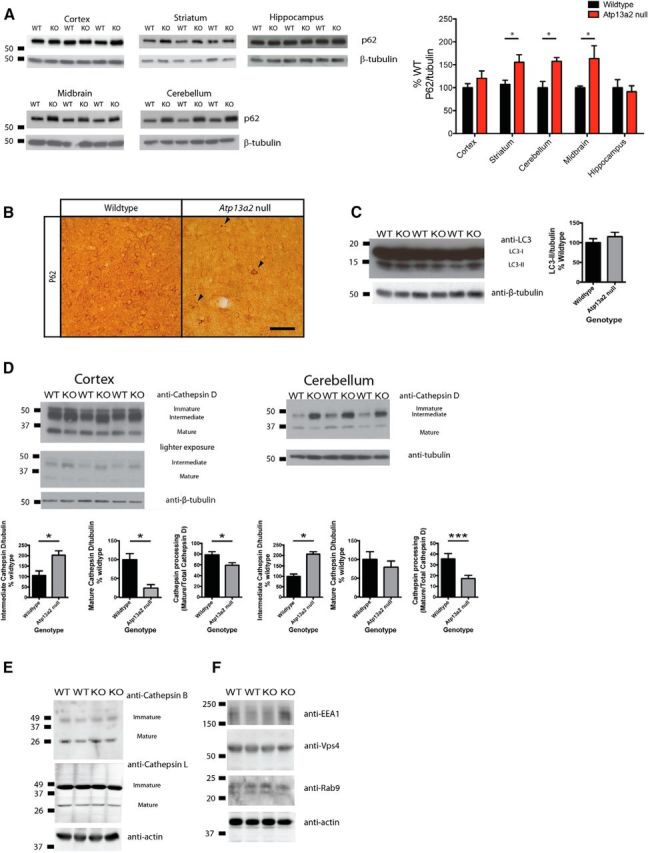
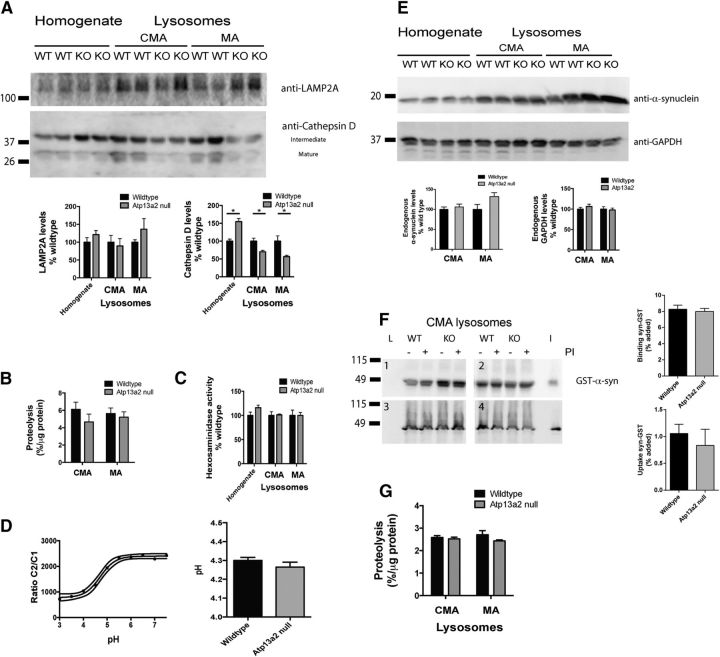
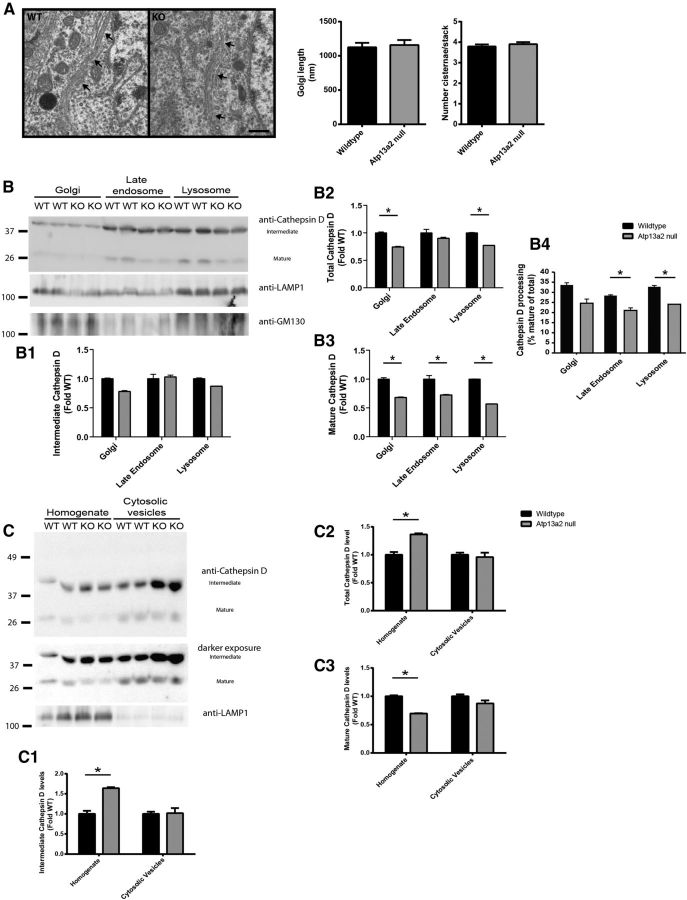
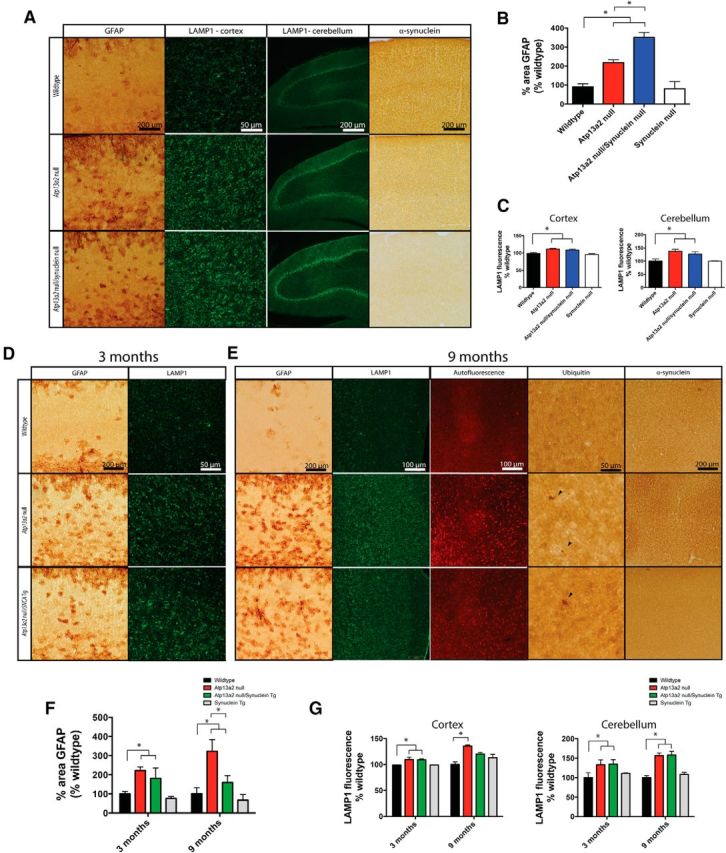
Accumulating evidence from genetic and biochemical studies implicates dysfunction of the autophagic-lysosomal pathway as a key feature in the pathogenesis of Parkinson's disease (PD). Most studies have focused on accumulation of neurotoxic α-synuclein secondary to defects in autophagy as the cause of neurodegeneration, but abnormalities of the autophagic-lysosomal system likely mediate toxicity through multiple mechanisms. To further explore how endolysosomal dysfunction causes PD-related neurodegeneration, we generated a murine model of Kufor-Rakeb syndrome (KRS), characterized by early-onset Parkinsonism with additional neurological features. KRS is caused by recessive loss-of-function mutations in the ATP13A2 gene encoding the endolysosomal ATPase ATP13A2. We show that loss of ATP13A2 causes a specific protein trafficking defect, and that Atp13a2 null mice develop age-related motor dysfunction that is preceded by neuropathological changes, including gliosis, accumulation of ubiquitinated protein aggregates, lipofuscinosis, and endolysosomal abnormalities. Contrary to predictions from in vitro data, in vivo mouse genetic studies demonstrate that these phenotypes are α-synuclein independent. Our findings indicate that endolysosomal dysfunction and abnormalities of α-synuclein homeostasis are not synonymous, even in the context of an endolysosomal genetic defect linked to Parkinsonism, and highlight the presence of α-synuclein-independent neurotoxicity consequent to endolysosomal dysfunction.

Keywords: ATP13A2; Parkinson's disease; autophagy; endolysosomal system; genetics.


Figures

Figure 1.
Figure 1.
Atp13a2 null mice display age-related motor abnormalities. A, Targeting strategy to generate Atp13a2 null mice. Diagram shows the Atp13a2 locus and insertion of LoxP sites around exons 2 and 3. Crossing to a mouse that expresses Cre recombinase in the germline resulted in deletion of exons 2 and 3 and the insertion of a premature stop codon in exon 4. B, Left, Levels of Atp13a2 cDNA generated from RNA isolated from 6-month-old wild-type, heterozygous, or Atp13a2 null mouse brain. Right, cDNA sequencing of Atp13a2 locus shows successful recombination resulting in a premature stop codon. C, Eighteen-month-old wild-type (left) or Atp13a2 null mouse (right) during tail suspension. Atp13a2 null mice adopted an abnormal clasping position, which was quantified as the percentage of mice displaying clasping at 12 and 18 months (χ2 = 7.27, N = 18 wild-type, 15 Atp13a2 null, p < 0.05). D, Spontaneous beam breaks during 1 h in the open field apparatus. Wild-type and Atp13a2 null mice were tested every 3 months from 9 to 18 months of age, with beam breaks measured in 5 min bins for 1 h. There was an effect of genotype, but not of time (repeated-measures ANOVA, Fgenotype(1,21) = 7.09, p = 0.015; Ftime(3,63) = 1.31, p = 0.28; Finteraction(3,63) = 0.16, p = 0.92). t = 2.42, p = 0.024; a Bonferroni's post hoc test showed a decrease in movements at 15 months. E, Wild-type and Atp13a2 null mice were tested for time to traverse a 5 mm balance beam (left) and latency to fall from an accelerating rotarod (right) every 3 months from 9 to 18 months old. Error bars represent SEM. *p < 0.05; ***p < 0.001.
Figure 2.
Figure 2.
Atp13a2 null CNS tissue exhibits widespread age-dependent gliosis. A, B, Forty micrometer sagittal sections from 18-month-old wild-type (top) or Atp13a2 null (bottom) mouse brains show diffuse GFAP immunoreactivity throughout the brain, including in the cortex, cerebellum, and hippocampus. C, Quantitative Western blot analysis of GFAP expression in the cortex, cerebellum, hippocampus, midbrain, and striatum of 18-month-old mice (5 μg protein loaded/lane; n = 11 wild-type, 10 Atp13a2 null mice). D, Immunohistochemistry for GFAP in the cortex of wild-type and Atp13a2 null mice at the indicated ages. Quantification (right) shows the percentage area of the cortex that is GFAP-positive normalized to wild-type tissue of the same age (n = 4 to 8 animals/genotype at each time point). *p < 0.05. Error bars indicate SEM. Scale bars: B, D, 200 μm.
Figure 3.
Figure 3.
Atp13a2 null neurons accumulate lipofuscin and lipid droplets. A, Autofluorescence in 40 μm sagittal sections from wild-type or Atp13a2 null mice (18 months old). Right, Ten-minute incubation with 0.3% Sudan Black in 70% ethanol quenched autofluorescence. B, Ultrastructural analyses of 12-month-old wild-type (top left) and Atp13a2 null mouse cortex (top middle, right), Purkinje cell layer of the cerebellum (bottom left), striatum (bottom middle), and hippocampus (bottom right). Lipofuscin is indicated with white arrowheads, whereas lipid droplets associated with lipofuscin is indicated with white arrows. C, Quantification of the number and size of lipid droplets associated with lipofuscin in neurons from 12-month-old wild-type and Atp13a2 null mice (n = 40 neurons/genotype). D, Ultrastructural analyses of cortex from 1-month-old wild-type (left) and Atp13a2 null mice (middle, right). Scale bars: A, 200 μm; B, left, middle, 2 μm; B, inset, bottom, D, 500 nm.
Figure 4.
Figure 4.
Age-dependent accumulation of lysosomal proteins and lipids in the Atp13a2 null CNS. A, Forty micrometer sections from 18-month-old Atp13a2 null or littermate control mouse brain sections stained for LAMP2 immunofluorescence in cortex and cerebellum. B, Quantitative Western blot analysis of LAMP1 expression in the cortex and cerebellum of 18-month-old mice. Top and bottom bands indicate glycosylated and unglycosylated forms of LAMP1, respectively (20 μg protein loaded/lane; n = 7 wild-type, 6 Atp13a2 null mice). C, Quantitative Western blot analysis of LAMP2 expression in the cortex of 18-month-old-mice (30 μg protein loaded/lane; n = 4 per genotype). D, Total levels of the lysosomal lipid BMP measured in 18-month-old cortical lipid extracts from wild-type and Atp13a2 null animals (n = 3 per genotype). Data are shown as the mean relative mole percentage, which was calculated by normalizing BMP levels to the total moles of all lipid species measured. E, LAMP1 immunofluorescence of cortex from wild-type and Atp13a2 null mice at the indicated ages. Immunofluorescence was quantified as mean fluorescence intensity for images taken from five cortical fields per animal and normalized to wild-type tissue of the same age (n = 4 animals/genotype at each time point). *p < 0.05; ***p < 0.001. Error bars indicate SEM. Scale bars: A, E, 100 μm.
Figure 5.
Figure 5.
Accumulation of ubiquitin-positive aggregates, but absence of α-synuclein-related pathology in Atp13a2 null mice. A, Forty micrometer sections of cortex and hippocampus from Atp13a2 null or littermate control mouse brains stained for ubiquitin. B, Ubiquitin inclusions (red) from Atp13a2 null mice colocalize with the neuronal marker NeuN, but not GFAP (green). C, Forty micrometer sections from 18-month-old wild-type or Atp13a2 null mouse brains stained for α-synuclein with tissue from α-synuclein null brain shown as a control. D, Quantitative Western blotting of α-synuclein protein levels from multiple brain regions of Atp13a2 null mice (5 μg protein loaded/lane; n = 12 wild-type, 10 Atp13a2 null mice). Error bars indicate SEM. E, Western blotting of pS129-α-synuclein protein from cortex of 18-month-old wild-type and Atp13a2 null mice (30 μg protein loaded/lane). F, Sequential extraction of cortical lysates from 18-month-old wild-type or Atp13a2 null mice in either HS, HS plus 1% Triton X-100 (HS + Tx), or 1% SDS lysis buffer (n = 3 per genotype). Sequential extraction from A53T-synuclein transgenic mice at 6 months of age is shown as a control (far right). Scale bars: A, 200 μm; B, 50 μm; C, 400 μm.
Figure 6.
Figure 6.
Midbrain dopaminergic neurons do not degenerate in Atp13a2 null mice. A, Stereological analysis of SNpC neurons with TH immunostaining or Nissl staining. The number of dopaminergic neurons in the SNpC was identified by TH immunoreactivity at 18 months of age (n = 10 wild-type, 7 Atp13a2 null mice). B, Semiquantitative Western blotting of TH levels from midbrain and striatum of 18-month-old mice (5 μg protein loaded/lane; n = 12 wild-type, 10 Atp13a2 null mice). C, Immunofluorescence of TH of striata from 18-month-old wild-type or Atp13a2 null mice. D, E, Immunofluorescence of midbrain structures for GFAP (blue), TH (red), or LAMP2 (green) of 18-month-old wild-type or Atp13a2 null mice. Scale bars: C, 20 μm; D, E, 100 μm.
Figure 7.
Figure 7.
Lysosomal processing of p62 and cathepsin D is abnormal in Atp13a2 null CNS tissue. A, Quantitative Western blotting of p62 levels from 18-month-old mice (5 μg protein loaded/lane; n = 12 wild-type, 10 Atp13a2 null mice). B, P62 immunohistochemistry of 18-month-old wild-type or Atp13a2 null cortex. Scale bar, 100 μm. C, Western blotting of LC3-II from 18-month-old mice; quantitation shown on the right (30 μg protein loaded/lane; n = 7 wild-type, 6 Atp13a2 null mice). D, Quantitative Western blot of cathepsin D levels in the cortex and cerebellum of 18-month-old mice (30 μg protein loaded/lane; n = 7 wild-type, 6 Atp13a2 null mice). Cathepsin D processing was defined as the ratio of mature cathepsin D to total cathepsin D. E, F, Western blotting of cathepsin B and cathepsin L (E) and of markers of early, late, and multivesicular endocytic compartments (F) from whole brain homogenates from 18-month-old mice (n = 4 samples of 2 pooled brains from wild-type and Atp13a2 null mice). *p < 0.05; **p < 0.01. Error bars indicate SEM.
Figure 8.
Figure 8.
Isolated lysosomes from Atp13a2 null tissue have decreased cathepsin D levels, but normal proteolytic activity. Lysosomes were isolated from two pooled brains of 18-month-old wild-type or Atp13a2 null mice and probed for ALP proteins and substrates. A, Western blotting of the indicated proteins of lysosomal compartments preferentially related with either CMA or with MA. Protein levels were determined by densitometry (bottom). B, Proteolytic activity of freshly isolated lysosomes. Proteolysis was measured by incubating a pool of radiolabeled cytosolic proteins with the two subpopulations of lysosomes after disruption of their membranes by a hypotonic shock. Results are expressed as the percentage of degradation per microgram of protein and are the average values of triplicate samples from four samples pooled from eight brains of either wild-type or Atp13a2 null mice. C, Hexosaminidase activity in total homogenates and the two subpopulations of lysosomes isolated from the same animals as in B. Values are expressed as percentages of those in wild-type control samples. D, Lysosomal pH, measured by ratiometric imaging following uptake of Oregon Green dextran. The calibration curve (left) was generated by holding wild-type cells at set pH values, and it allowed the conversion of the C2/C1 ratio to pH (right) for wild-type and Atp13a2 null fibroblasts (n = 174 cells for wild-type, 151 cells for Atp13a2 null cells). E, Endogenous levels of α-synuclein and GAPDH in intact lysosomes from brains of wild-type or Atp13a2 null mice. Levels of the indicated proteins were calculated by densitometry (bottom). F, Association of recombinant GST-α-synuclein with CMA active lysosomes previously incubated or not with protease inhibitors (PIs) to determine binding and uptake via CMA. L, Lysosomes incubated without GST-α-synuclein; I, input (1/10 of added protein). Samples correspond to lysosomes isolated from four different preparations. The percentage of monomeric GST-α-synuclein bound and taken up by lysosomes is shown at the right. G, Degradation of a pool of radiolabeled cytosolic proteins by the two subpopulations of lysosomes isolated from brains of wild-type or Atp13a2 null mice was performed as in B but using intact, instead of disrupted, lysosomes. *p < 0.05. Error bars indicate SEM.
Figure 9.
Figure 9.
Selective alteration to cathepsin D processing in lysosomes and late endosomes, but not Golgi or cytosolic vesicles. A, Ultrastructural analysis of Golgi from 12-month-old wild-type (left) or Atp13a2 null (right) neurons. Golgi are indicated by black arrows. Quantitation of Golgi length (in nanometers) and numbers of cisternae per stack are shown. Scale bar: 500 nm. B, Subcellular fractions enriched in Golgi, late endosomes, and lysosomes were isolated from five preparations of 10 pooled brains of 18-month-old wild-type or Atp13a2 null mice and probed for cathepsin D, Golgi, and endosome/lysosome markers. Total (B2), mature (B3), and intermediate (B1) cathepsin D were determined by densitometry. Cathepsin D processing (B4) was defined as mature cathepsin D divided by total protein level. C, Cytosolic carrier vesicles were isolated from five preparation of 10 pooled brains of 18-month-old wild-type or Atp13a2 null mice and probed for cathepsin D and LAMP1 as a marker of lysosomes. Total (C2), mature (C3), and intermediate (C1) cathepsin D were determined by densitometry. *p < 0.05.
Figure 10.
Figure 10.
Genetic modulation of α-synuclein levels does not affect the onset or extent of histopathology in Atp13a2 null mice. A, Forty micrometer sections from cortex or cerebellum of 3-month-old wild-type, Atp13a2 null, or Atp13a2 null/SNCA null mice stained for GFAP, LAMP1, or α-synuclein. B, Quantification of percentage area of the cortex positive for GFAP immunoreactivity, as in Figure 2D (one-way ANOVA, F = 33.99, p < 0 .0001; n = 6/genotype). Tukey's multiple comparisons tests were performed to detect differences between individual genotypes. C, Quantification of average fluorescence intensity of the cortex (left) or Purkinje cell layer of the cerebellum (right), as in Figure 4D (one-way ANOVA, Fcortex = 8.24, p = 0.001; Fcerebellum = 5.50, p = 0.008). Tukey's multiple comparisons tests were used to detect differences between individual genotypes. D, E, Forty micrometer sections from cortex of 3-month-old (D) or 9-month-old (E) wild-type, Atp13a2 null, or Atp13a2 null/SNCA transgenic (Tg) mice either unstained or stained for GFAP, LAMP1, ubiquitin, or α-synuclein (n = 9/genotype). F, Quantification of percentage area of the cortex positive for GFAP immunoreactivity, as in Figure 2D (one-way ANOVA, F = 4.71, p = 0.01). Tukey's multiple comparisons tests were used to detect differences between individual genotypes. G, Quantification of fluorescence intensity of the cortex (left) or Purkinje cell layer of the cerebellum (right) as in Figure 4D (one-way ANOVA, Fcortex = 23.20, p < 0.0001; Fcerebellum = 18.03, p = 0.0001). Tukey's multiple comparisons tests were used to detect differences between individual genotypes. *p < 0.05. Scale bars are as indicated in A, D, and E.

References

    1. Ahmed I, Liang Y, Schools S, Dawson VL, Dawson TM, Savitt JM. Development and characterization of a new Parkinson's disease model resulting from impaired autophagy. J Neurosci. 2012;32:16503–16509. doi: 10.1523/JNEUROSCI.0209-12.2012. - DOI - PMC - PubMed
    1. Behrens MI, Brüggemann N, Chana P, Venegas P, Kägi M, Parrao T, Orellana P, Garrido C, Rojas CV, Hauke J, Hahnen E, González R, Seleme N, Fernández V, Schmidt A, Binkofski F, Kömpf D, Kubisch C, Hagenah J, Klein C, Ramirez A. Clinical spectrum of Kufor-Rakeb syndrome in the Chilean kindred with ATP13A2 mutations. Mov Disord. 2010;25:1929–1937. doi: 10.1002/mds.22996. - DOI - PubMed
    1. Bible E, Gupta P, Hofmann SL, Cooper JD. Regional and cellular neuropathology in the palmitoyl protein thioesterase-1 null mutant mouse model of infantile neuronal ceroid lipofuscinosis. Neurobiol Dis. 2004;16:346–359. doi: 10.1016/j.nbd.2004.02.010. - DOI - PubMed
    1. Brüggemann N, Hagenah J, Reetz K, Schmidt A, Kasten M, Buchmann I, Eckerle S, Bähre M, Münchau A, Djarmati A, van der Vegt J, Siebner H, Binkofski F, Ramirez A, Behrens MI, Klein C. Recessively inherited Parkinsonism: effect of ATP13A2 mutations on the clinical and neuroimaging phenotype. Arch Neurol. 2010;67:1357–1363. - PubMed
    1. Castellino F, Germain RN. Extensive trafficking of MHC class II-invariant chain complexes in the endocytic pathway and appearance of peptide-loaded class II in multiple compartments. Immunity. 1995;2:73–88. doi: 10.1016/1074-7613(95)90080-2. - DOI - PubMed

Publication types

MeSH terms

Supplementary concepts

LinkOut - more resources