. 2015 Apr 8;35(14):5754-71.
doi: 10.1523/JNEUROSCI.1035-14.2015.

Miro's N-terminal GTPase domain is required for transport of mitochondria into axons and dendrites

Affiliations

Miro's N-terminal GTPase domain is required for transport of mitochondria into axons and dendrites

Milos Babic et al. J Neurosci. .

Abstract

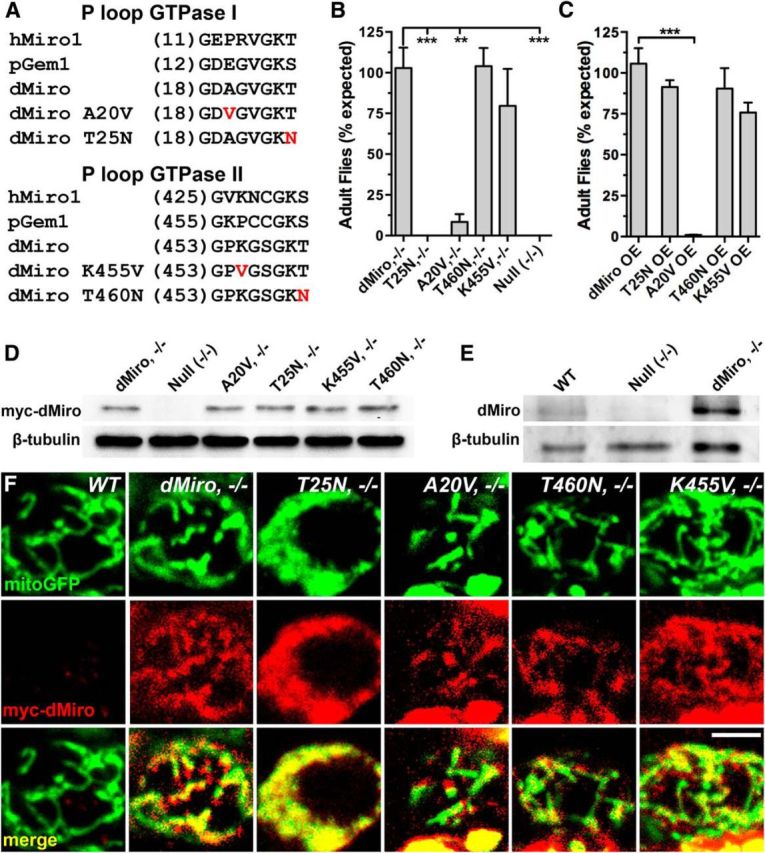
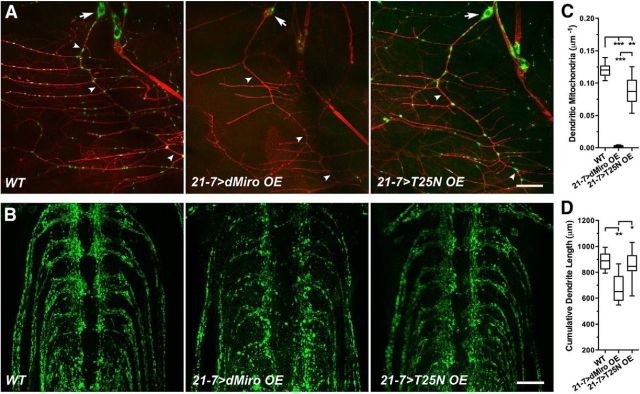
Mitochondria are dynamically transported in and out of neuronal processes to maintain neuronal excitability and synaptic function. In higher eukaryotes, the mitochondrial GTPase Miro binds Milton/TRAK adaptor proteins linking microtubule motors to mitochondria. Here we show that Drosophila Miro (dMiro), which has previously been shown to be required for kinesin-driven axonal transport, is also critically required for the dynein-driven distribution of mitochondria into dendrites. In addition, we used the loss-of-function mutations dMiroT25N and dMiroT460N to determine the significance of dMiro's N-terminal and C-terminal GTPase domains, respectively. Expression of dMiroT25N in the absence of endogenous dMiro caused premature lethality and arrested development at a pupal stage. dMiroT25N accumulated mitochondria in the soma of larval motor and sensory neurons, and prevented their kinesin-dependent and dynein-dependent distribution into axons and dendrites, respectively. dMiroT25N mutant mitochondria also were severely fragmented and exhibited reduced kinesin and dynein motility in axons. In contrast, dMiroT460N did not impair viability, mitochondrial size, or the distribution of mitochondria. However, dMiroT460N reduced dynein motility during retrograde mitochondrial transport in axons. Finally, we show that substitutions analogous to the constitutively active Ras-G12V mutation in dMiro's N-terminal and C-terminal GTPase domains cause neomorphic phenotypic effects that are likely unrelated to the normal function of each GTPase domain. Overall, our analysis indicates that dMiro's N-terminal GTPase domain is critically required for viability, mitochondrial size, and the distribution of mitochondria out of the neuronal soma regardless of the employed motor, likely by promoting the transition from a stationary to a motile state.

Keywords: Miro; mitochondria; transport.


Figures

Figure 1.
Figure 1.
Transgenic expression of GTPase mutant dMiro proteins. A, Amino acid sequence of the P loop in the N-terminal (top) and C-terminal GTPase domain (bottom) of human Miro1 (hMiro1), yeast Miro (pGem1), and dMiro. The point mutations (T25N, T460N, A20V, K455V) introduced into the GTPase domains of myc-tagged dMiro (RC-transcript, FlyBase) are highlighted in red. B, C, Normal myc-dMiro (control) and mutant myc-dMiroA20V, myc-dMiroT25N, myc-dMiroK455V, and myc-dMiroT460N were pan-neuronally expressed in dmiro-null mutants (−/−, B) or (C) overexpressed (OE) in otherwise wild-type animals (w1118) using an elav-Gal4 driver. Viability was assayed daily by counting freshly hatched adult flies. Data represent means ± SEM of three independent matings. Only significant differences between control and mutant genotypes are indicated by asterisks (p < 0.05, N > 3, n > 100; 1-way ANOVA, Tukey's post test). D, E, Protein expression levels of myc-tagged GTPase-mutant dMiro proteins that were transgenically expressed in dmiro-null mutant (−/−) neurons. Immunoblots of larval brain protein extracts were stained with anti-Myc (D) or anti-dMiro (E) antibodies. β-Tubulin was used as loading control to normalize mutant protein levels to control (dMiro, 1.0; dMiroA20V, 0.9; dMiroT25N, 0.8; dMiroK455V, 1.1; dMiroT460N, 0.9; n = 3). Genotypes are indicated. F, Coimmunolocalization of the mitochondrial marker mitoGFP (green, top row) with myc-tagged dMiro proteins (red, middle row) in MN cell bodies of third-instar larvae. Wild-type control (WT) neurons lack transgenic expression of myc-dMiro. Transgenes encoding dMiroA20V, dMiroT25N, dMiroK455V, dMiroT460N, and normal dMiro were coexpressed with a transgene encoding mitoGFP in motor neurons of dmiro-null mutants with an Ok6-Gal4 driver. Scale bar, 2 μm.
Figure 2.
Figure 2.
dMiro's N-terminal GTPase domain is required for a normal distribution of mitochondria in motor neurons. A–J, mitoGFP was transgenically coexpressed with normal myc-dMiro (control), myc-dMiroA20V, myc-dMiroT25N, myc-dMiroK455V, or myc-dMiroT460N in MNs of dmiro-null mutants (Null) using an Ok6-Gal4 driver. Mitochondria in larval MNs were visualized by confocal live imaging (A, H–J) or immunostainings using anti-GFP and anti-HRP antibodies (B–G). Graph bars represent mean ± SEM. Box whisker plots represent median (line), 25th–75th percentile (box) range, and 10th–90th percentile (whisker) range. Significant differences among indicated genotypes are indicated by asterisks (1-way ANOVA and Tukey's post-test or Kruskal–Wallis and Dunn's post-test). A, Mitochondria (green) in the soma of larval MNs (arrow) that are located along the midline of the ventral nerve cord (VNC), and axons (arrow) of segmental nerves exiting the VNC. Scale bar, 25 μm. B, Distribution of mitochondria (green) in motor axons (red) of segmental nerves proximal to the VNC. Genotypes are indicated. Arrowheads indicate abnormally elongated mitochondria with thin protrusions that often connect mitochondria of normal width. Scale bar, 5 μm. C, Distribution of presynaptic mitochondria (green) at larval NMJs (red) on muscle 6/7 of the indicated genotypes. Scale bar, 20 μm. D, Overall density of mitochondria in motor axons of proximal segmental nerves (p < 0.01, N > 7). E, Percentage of synaptic boutons containing mitochondria at larval NMJs (p < 0.001, N > 4). F, Mitochondrial area of synaptic boutons (p < 0.05, N > 5, n > 56). G, Mitochondrial area of terminal synaptic boutons (p < 0.05, N > 5, n > 56). H, Length of motile mitochondria in proximal motor axons of the indicated genotypes (p < 0.05, N > 18). I, Number of stationary mitochondria that were longer than 6 μm in proximal motor axons (50-μm-long ROI; p < 0.05, N > 7). J, Normalized TMRM fluorescence (ΔF/F; ΔF = FpolFdepol.) of stationary mitochondria at larval NMJs. Genotypes are indicated (p < 0.05, N > 111).
Figure 3.
Figure 3.
Effects of mutations in dMiro's GTPase domains on the distribution of synaptic components. A–H, Normal (control) and GTPase mutant myc-dMiro proteins (A20V, T25N, K455V, or T460N) were expressed in dmiro-null mutant (Null, −/−) neurons using an elav-Gal4 driver. Neuronal membranes, synaptic vesicles, and active zones at larval NMJs on muscle 6/7 were visualized by confocal imaging of immunostainings using anti-HRP, anti-CSP and anti-Brp antibodies, respectively. Asterisks indicate significant differences among indicated genotypes (Kruskal–Wallis, Dunn's post-test). A, B, Distribution of synaptic vesicle-associated CSP (A) and the active-zone component Brp (B) at synaptic boutons of larval NMJs visualized by HRP stainings. Genotypes are indicated. Scale bar, 20 μm. C, Accumulations of CSP (green) and HRP (red) in sensory and motor axons of larval nerves proximal to the VNC. Scale bar, 10 μm. D–F, Quantification of CSP (D), Brp (E), and HRP (F) fluorescence at immunostained synaptic boutons of larval NMJs that were normalized to dMiro control levels. Genotypes are indicated (p < 0.05, n > 56, N > 4). G. Quantification of protein accumulations that were immunopositive for CSP and HRP in sensory and motor axons of larval nerves proximal to the VNC (p > 0.05, N > 10).
Figure 4.
Figure 4.
dMiro's N-terminal GTPase domain is required for normal motility of axonal mitochondria. A–E, mitoGFP was coexpressed with myc-dMiro (control, dMiro, −/−), myc-dMiroA20V, myc-dMiroT25N, myc-dMiroK455V, or myc-dMiroT460N in MNs of dmiro-null mutants (Null, (−/−)) using an Ok6-Gal4 driver. Confocal time-lapse images visualizing mitochondria in motor axons of the segmental larval nerve exiting the VNC were acquired at a rate of 1 s−1. Asterisks indicate significant differences of indicated mutant genotypes from controls (Kruskal–Wallis and Dunn's post-test). A, Distribution of mitochondria that were motile (green or magenta) or stationary (white) in proximal axons of motor neurons during the 2-min-long imaging period. Scale bar, 5 μm. B, C, Overall density of motile (B) and stationary (C) mitochondria in proximal axons of motor neurons (p < 0.05, N > 7). D, E, Mitochondrial flux of anterograde (D) and retrograde (E) transport in motor axons of proximal larval nerves (p < 0.05, N > 15).
Figure 5.
Figure 5.
Effects of dMiroT25N and dMiroT460N on kinesin-driven motility during anterograde axonal transport of mitochondria. A–I, mitoGFP was coexpressed with myc-dMiro (control, dMiro, −/−), myc-dMiroT25N, or myc-dMiroT460N in motor neurons of dmiro-null mutants [Null (−/−)] using an Ok6-Gal4 driver. Confocal time-lapse images of mitoGFP-tagged mitochondria in motor axons in the segmental larval nerves exiting the VNC were acquired at a rate of 1 s−1 immediately after photobleaching a 50-μm-long ROI to track motions of mitochondria moving into the bleached area. Asterisks indicate significant differences among indicated genotypes (Kruskal–Wallis and Dunn's post-test). A, Each plot shows typical tracks of movements by an individual mitochondrion for 180 s. For comparison, the start of individual tracks was set to zero. Net-positive and net-negative movements represent anterograde and retrograde transport, respectively. B, Net velocity of anterograde mitochondrial transport in motor axons (p < 0.001, N > 20). C, D, Fraction of time mitochondria spent on MT plus end-directed trips (C) and short stops (D) during anterograde transport (p < 0.05, N > 20). E, Average duration of stops of mitochondria during anterograde transport (p < 0.05, N > 18). F, G, Distance of MT plus end-directed cRuns (F) and trips (G) during anterograde mitochondrial transport (p < 0.001, N > 20). H, Number of MT plus end-directed cRuns during anterograde mitochondrial transport (p < 0.01, N > 20). I, Fraction of MT plus end-directed trips that exhibited cRuns (p < 0.05, N > 29).
Figure 6.
Figure 6.
Effects of dMiroT25N and dMiroT460N on dynein-driven motility during retrograde axonal transport of mitochondria. A–H, mitoGFP was coexpressed with myc-dMiro (control, dMiro, −/−), myc-dMiroT25N, or myc-dMiroT460N in MNs of dmiro-null mutants [Null (−/−)] using an Ok6-Gal4 driver. Confocal time-lapse images of mitoGFP-tagged mitochondria in motor axons were acquired at a rate of 1 s−1 as described previously. Asterisks indicate significant differences among indicated genotypes (Kruskal–Wallis and Dunn's post-test). A, Net velocity of retrograde axonal mitochondrial transport (p < 0.05, N > 36). B, C, Fraction of time mitochondria spent on MT minus end-directed trips (B) and short stops (C) during retrograde transport (p < 0.05, N > 20). D, Average duration of stops of mitochondria during retrograde transport (p < 0.01, N > 18). E, F, Distance of MT minus end-directed cRuns (E) and trips (F) during retrograde transport (p < 0.05, N > 36). G, Number of MT minus end-directed cRuns during retrograde transport (p > 0.05, N > 40). H, Fraction of MT minus end-directed trips that exhibited cRuns (p > 0.05, N > 29).
Figure 7.
Figure 7.
Comparison of dMiroT25N-induced and dMiroT460N-induced phenotypes in the absence and presence of endogenous dMiro. A–I, myc-dMiro (control), myc-dMiroT25N, or myc-dMiroT460N were coexpressed with mitoGFP in MNs of dmiro-null mutants (−/−) or overexpressed (OE) in MNs of wild-type control (w1118) using an Ok6-Gal4 driver. Confocal time-lapse images of mitoGFP-tagged mitochondria in motor axons were acquired at a rate of 1 s−1. Asterisks indicate significant differences for the pairwise comparison between effects induced by expression in a null and wild-type background (Mann–Whitney) and differences from wild type (WT) and dMiro OE among all indicated genotypes (Kruskal–Wallis and Dunn's post-test). A, Confocal images of mitoGFP-tagged mitochondria (green) in the soma of larval MNs, their dendrites located in the neuropil of the VNC (arrowheads), and axons (arrows) of segmental nerves exiting the VNC. Scale bar, 25 μm. B. Mitochondrial flux of anterograde transport in motor axons of proximal larval nerves (p < 0.05, N > 8). C, Net velocity of anterograde mitochondrial transport in axons (p < 0.05, N > 20). D, Percentage of time mitochondria spent on plus end-directed trips during anterograde transport (p < 0.01, N > 20). E, F, Distance of MT plus end-directed cRuns (E) and trips (F) during anterograde mitochondrial transport (p < 0.001, N > 20). G, Number of MT plus end-directed cRuns during anterograde transport (p < 0.01, N > 20). H, Fraction of MT plus end-directed trips that exhibited cRuns during anterograde transport (p < 0.001, N > 29). I, Number of cRuns per MT plus end-directed trips (p < 0.01, N > 62).
Figure 8.
Figure 8.
Effects of dMiroT25N on the distribution of mitochondria in dendrites of sensory neurons. A–H, mitoGFP was transgenically coexpressed with normal myc-dMiro (control), myc-dMiroT25N, or dmiro promoter-driven genomic transgene expressing only dMiro-PC in vpda SNs of dmiro-null mutants [Null (−/−)] using the indicated 21-7 and C380 Gal4 drivers. Mitochondria in larval SNs were visualized by confocal imaging of immunostained larval body wall preparations using anti-GFP and anti-HRP antibodies. Asterisks indicate significant differences among indicated genotypes (Kruskal–Wallis and Dunn's post-test). A, Mitochondria (green) in dendrites and soma of vpda SNs. Arrows and arrowheads indicate the soma and primary dendrite of the SN. Scale bar, 20 μm. B, Mitochondria (green) in vpda SN axons of segmental nerves proximal to the VNC. Arrowheads denote abnormally small mitochondria of dmiro-null and dMiroT25N mutants. Scale bar, 10 μm. C–E, Density of mitochondria in primary (C), secondary (D), and all (E) dendrites of vpda neurons (p < 0.05, N > 7). F, G, Average length of primary (F) and secondary (G) vpda SN dendrites (p < 0.05, N > 7). F, Cumulative length of vpda SN dendrites (p < 0.05, N > 7).
Figure 9.
Figure 9.
Effects of dMiro and dMiroT25N OE on the distribution of mitochondria in dendrites of sensory neurons. A–D, mitoGFP was coexpressed with normal myc-dMiro (dMiro OE) or myc-dMiroT25N (T25N OE) in vpda SNs of wild-type control (WT, w1118) using a 21-7-Gal4 driver. Mitochondria were visualized by confocal imaging of immunostained larval preparations using anti-GFP and anti-HRP antibodies. Asterisks indicate significant differences among indicated genotypes (Kruskal–Wallis and Dunn's post-test). A, Mitochondria (green) in dendrites and soma of vpda SNs. Arrows and arrowheads indicate the soma and primary dendrite of the SN. Scale bar, 20 μm. B, Mitochondria (green) in distal SN axons of the larval nerve and the VNC. Scale bar, 20 μm. C, Density of mitochondria in dendrites of vpda SN neurons (p < 0.01, N > 7). D, Cumulative length of vpda SN dendrites (p < 0.05, N > 7).
Figure 10.
Figure 10.
Effects of dMiroA20V and dMiroK455V on kinesin-driven motility during anterograde axonal transport of mitochondria. A–F, myc-dMiro (control), myc-dMiroA20V, or myc-dMiroK455V were coexpressed with mitoGFP in MNs of dmiro-null mutants (−/−) or overexpressed (OE) in MNs of wild-type control (w1118) using an Ok6-Gal4 driver. Confocal time-lapse images of mitoGFP-tagged mitochondria in motor axons were acquired at a rate of 1 s−1. Asterisks indicate significant differences for the pairwise comparison between effects induced by expression in a null and wild-type background (Mann–Whitney), and differences from WT and dMiro OE among all indicated genotypes (Kruskal–Wallis and Dunn's post-test). A, Mitochondrial flux of anterograde transport in motor axons of proximal larval nerves (p < 0.001, N > 6). B, Net velocity of anterograde mitochondrial transport in axons (p < 0.05, n > 29, N > 6). C, Fraction of time mitochondria spent on MT plus end-directed trips during anterograde transport (p < 0.05, n > 29, N > 6). D, E, Distance of MT plus end-directed runs (D) and trips (E) during anterograde mitochondrial transport (p < 0.001, n > 29, N > 6). F, Number of MT plus end-directed cRuns during anterograde transport (p < 0.01, n > 29, N > 6).
Figure 11.
Figure 11.
Effects of dMiro GTPase double-mutant proteins on the distribution and transport of mitochondria in axons. A–I, mitoGFP was coexpressed with normal myc-dMiro (control), myc-dMiroA20V, myc-dMiroT25N, myc-dMiroT25N-T460N, myc-dMiroT25N-K455V, myc-dMiroA20V-K455V, or myc-dMiroA20V-T460N in MNs of dmiro-null mutants (−/−) using an Ok6-Gal4 driver. Mitochondria in larval motor neurons were visualized by confocal live imaging or immunostainings using anti-GFP (mitoGFP) and anti-HRP antibodies (neuronal membranes). Asterisks indicate significant differences among indicated genotypes (Kruskal–Wallis and Dunn's post-test). A, Mitochondria (green) in larval MNs in the VNC of dMiroT25N-K455V and dMiroT25N-T460N mutants accumulate in the soma and are absent from axons and dendrites. Scale bar, 30 μm. B, C, Distribution of presynaptic mitochondria (green) at larval NMJs (red) of muscle 6/7. Note the differential sensitivity of mito-GFP-immunostained dMiroA20V-T460N mutant mitochondria (C) to fixation by formaldehyde (FA) and Bouin's fixative. Scale bar, 20 μm. D, Mitochondrial area of synaptic boutons (p < 0.001, n > 98, N > 5). E, Area of synaptic boutons (p < 0.001, n > 98, N > 5). F, Net velocity of anterograde mitochondrial transport in motor axons (p > 0.05, N > 15). G, Fraction of time mitochondria spent on MT plus end-directed trips during anterograde transport (p > 0.05, N > 15). H, I, Distance of MT plus end-directed runs (H) and trips (I) during anterograde mitochondrial transport (p > 0.05, N > 15).

References

    1. Aberle H, Haghighi AP, Fetter RD, McCabe BD, Magalhães TR, Goodman CS. Wishful thinking encodes a BMP type II receptor that regulates synaptic growth in Drosophila. Neuron. 2002;33:545–558. doi: 10.1016/S0896-6273(02)00589-5. - DOI - PubMed
    1. Bischof J, Maeda RK, Hediger M, Karch F, Basler K. An optimized transgenesis system for Drosophila using germ-line-specific phiC31 integrases. Proc Natl Acad Sci U S A. 2007;104:3312–3317. doi: 10.1073/pnas.0611511104. - DOI - PMC - PubMed
    1. Boldogh IR, Nowakowski DW, Yang HC, Chung H, Karmon S, Royes P, Pon LA. A protein complex containing Mdm10p, Mdm12p, and Mmm1p links mitochondrial membranes and DNA to the cytoskeleton-based segregation machinery. Mol Biol Cell. 2003;14:4618–4627. doi: 10.1091/mbc.E03-04-0225. - DOI - PMC - PubMed
    1. Brand AH, Perrimon N. Targeted gene expression as a means of altering cell fates and generating dominant phenotypes. Development. 1993;118:401–415. - PubMed
    1. Brickley K, Smith MJ, Beck M, Stephenson FA. GRIF-1 and OIP106, members of a novel gene family of coiled-coil domain proteins: association in vivo and in vitro with kinesin. J Biol Chem. 2005;280:14723–14732. doi: 10.1074/jbc.M409095200. - DOI - PubMed

Publication types

MeSH terms

LinkOut - more resources