. 2015 Apr 8;35(14):5792-807.
doi: 10.1523/JNEUROSCI.4274-14.2015.

Mapping synapses by conjugate light-electron array tomography

Affiliations

Mapping synapses by conjugate light-electron array tomography

Forrest Collman et al. J Neurosci. .

Abstract

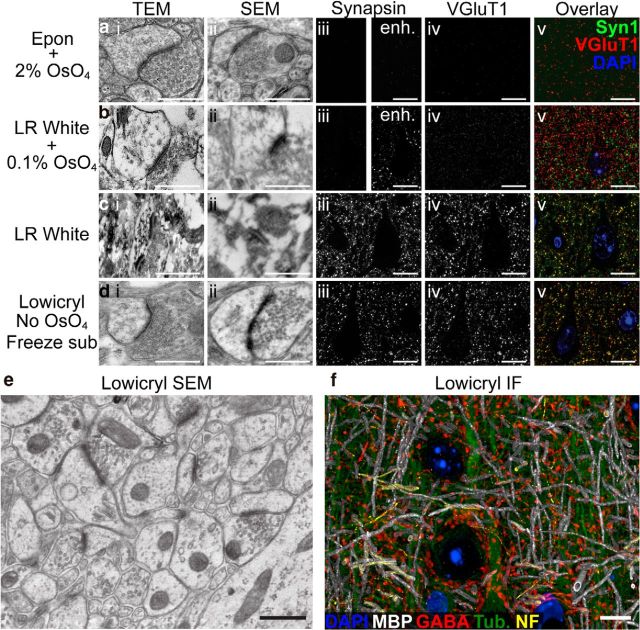
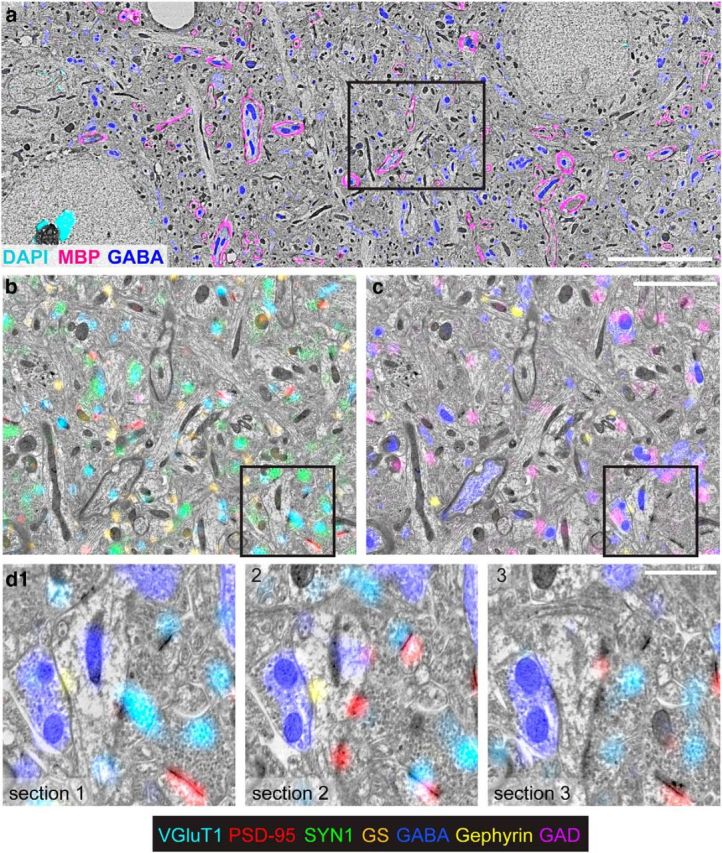
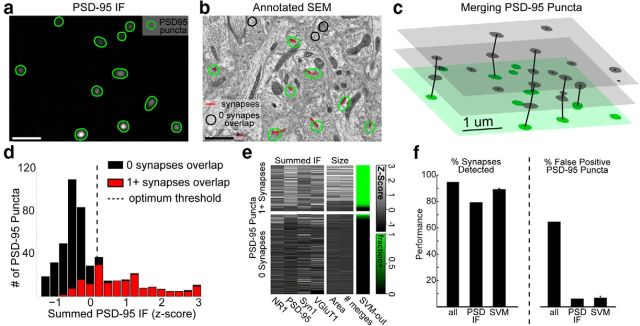
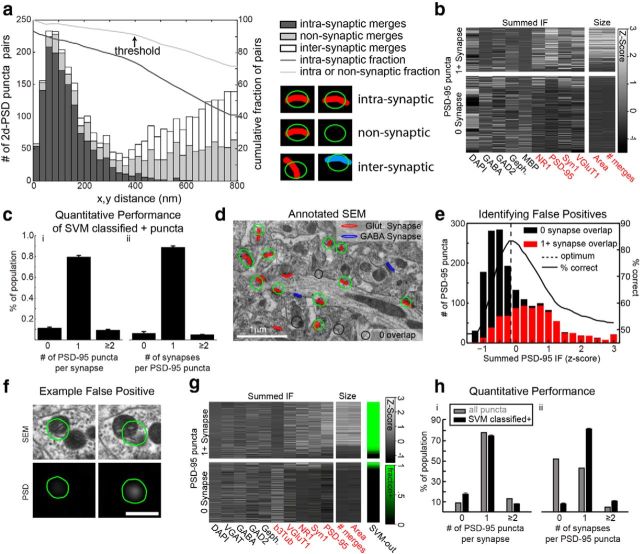
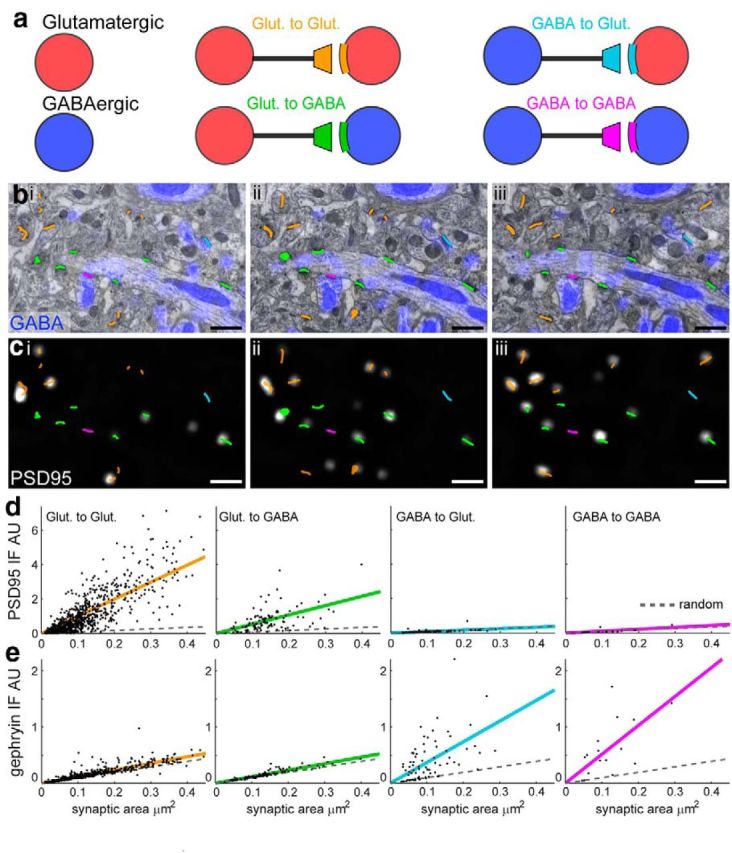
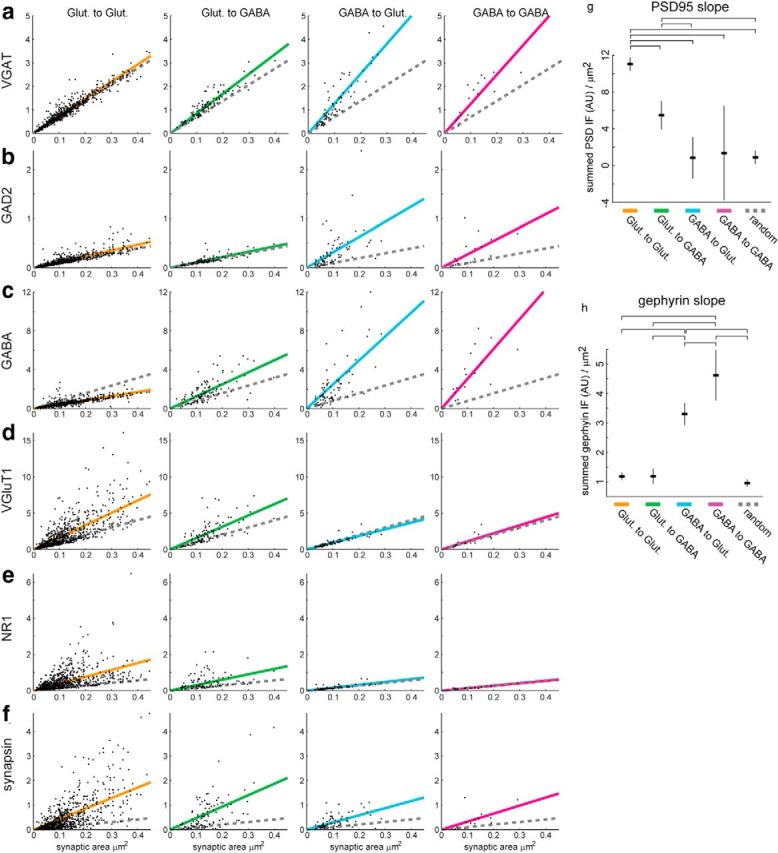
Synapses of the mammalian CNS are diverse in size, structure, molecular composition, and function. Synapses in their myriad variations are fundamental to neural circuit development, homeostasis, plasticity, and memory storage. Unfortunately, quantitative analysis and mapping of the brain's heterogeneous synapse populations has been limited by the lack of adequate single-synapse measurement methods. Electron microscopy (EM) is the definitive means to recognize and measure individual synaptic contacts, but EM has only limited abilities to measure the molecular composition of synapses. This report describes conjugate array tomography (AT), a volumetric imaging method that integrates immunofluorescence and EM imaging modalities in voxel-conjugate fashion. We illustrate the use of conjugate AT to advance the proteometric measurement of EM-validated single-synapse analysis in a study of mouse cortex.

Keywords: correlative microscopy; electron microscopy; immunofluorescence; synapses; synaptic diversity.


Figures

Figure 1.
Figure 1.
Tradeoff between ultrastructural integrity and immunoreactivity. Four different tissue preparation methods were compared using three different imaging modalities. a, Glutaraldehyde fixation, poststained with 2% OsO4 and embedded in Epon resin. b, Formaldehyde fixation, poststained with 0.1% OsO4 and embedded in LR White. c, Formaldehyde fixation, embedded in LR White without osmium. d, Lowicryl method presented here. Images from layer 5 of mouse neocortex were acquired with TEM (i), SEM (ii), or epifluorescence after immunostaining for VGluT1 (iii) and synapsin (iv). All IF was performed under identical conditions, constant exposure, and color map, except for the panels marked enhanced (enh.; aiii, biii) where the maximally bright value was halved, and color images in v, where channels were renormalized to 99.5% percentile. Osmium-free low-temperature embedding in Lowicryl achieved both excellent ultrastructural preservation and immunoreactivity, unlike the other methods. e, f, Larger SEM field and a volumetric rendering of an AT-IF dataset obtained from the same Lowicryl-embedded tissue block. IF scale bars,10 μm; EM scale bars, 500 nm.
Figure 2.
Figure 2.
Large high-resolution SEM fields from Lowicryl-embedded tissue. a, Field from which the synapse in Figure 1dii was taken (after rotation and cropping). b, Microtubules are visible in two tangentially sectioned dendrites. Scale bars, 500 nm. These images are from freshly cut sections, which did not undergo immunostaining or elution. Sections were mounted on silanized coverslips, and poststained with KMnO4, uranyl acetate, and lead.
Figure 3.
Figure 3.
Conjugate SEM-IF imaging. a, A mosaic showing 55 sections of an array tomography ribbon, imaged for the fluorescent nuclear stain DAPI (10× objective). Scale bar, 1 mm. b, A mosaic of low-magnification SEM images of the same ribbon shown in a. c, A color overlay of the boxed region within a, b shows a single section from the ribbon. d, A higher-magnification SEM image, from within the field of c (top right, black box); color overlay shows fluorescent image (63× objective). The DAPI signal (cyan) highlights the correspondence between the locations of nuclei within the field. Scale bar, 10 μm. e, A higher-magnification SEM image taken within the field of d (black box), overlaid with IF signals (PSD-95: red, synaptophysin: green, and GABA: blue; 63× objective). Scale bar, 1 μm.
Figure 4.
Figure 4.
Registration of IF and SEM Measurements of Neuronal Structure. a, An example of a mitochondrial profile, identified by dim autofluorescence in the DAPI channel. The boundary of the traced region is shown in red, and its centroid as a small red x. b, SEM image of the region in a. The mitochondrial profile was independently traced in green, and its centroid labeled with a green dot. The red outline is from a; a black line marks the 78.8 nm displacement between the two centroids. c, Conjugate IF-SEM of layer IV of an YFP line H-positive mouse. Three serial sections are shown, with αGFP IF overlaid in yellow. Dendritic processes that were consistently stained with αGFP were traced in the EM (green outlines). Thresholding the αGFP IF (red outlines) demonstrates that αGFP IF fills nearly the entire dendritic profile, except for mitochondria. Scale bar, 1 μm. d, Five serial sections of the dendritic spine within the black box outlined in a. A color overlay of GABA (blue), αGFP (yellow), and PSD-95 (red) is shown. Bottom, The individual channels are shown in grayscale, with the traced spine repeated across channels in dotted green. The outline of the thresholded αGFP image is overlaid on the αGFP image (red line). The PSD-95 IF is displayed with a color map proportional to the square root of the IF intensity (to reveal the PSD-95 signal within a synapse located on the dendritic spine without saturating the image of the nearby synapse in the lower right of sections 3–5). Scale bar, 500 nm. e, Quantification of the proportion of pixels that have αGFP intensities larger than a varied threshold. For the threshold displayed in c, d (red line), the cutoff included only 6.2% of all pixels visible in the field. On the other hand, 83.5% of the pixels within the dendritic structures traced within seven consecutive sections were above this threshold, indicating that the αGFP signal nearly fills the dendritic space; most of the areas of the dendritic processes that were not positive lie within mitochondria, or near the edges of the dendritic processes. The threshold was chosen such that the outline of the thresholded IF lay approximately on the membrane of the larger dendritic process. f, A fluorescence image from cortical layer 5 of a YFP line-H mouse embedded in Lowicryl HM-20.The fluorescence is detectable, although dimmer than in tissue embedded in LR White. g, An IF image from the same region, after applying an αGFP antibody, and a fluorescent secondary spectrally separable from YFP (AlexaFluor 594). The signal is dramatically amplified. Scale bar, 10 μm.
Figure 5.
Figure 5.
Molecular multiplexing with conjugate AT. a, A large SEM field is shown in grayscale, with immunofluorescence for myelin basic protein (MBP; magenta), GABA (blue), and DAPI (cyan). Scale bar, 10 μm. b, An enlarged subfield (black box in a) overlaid with VGluT1 (light blue), glutamine synthetase (orange), synapsin-1 (green), and PSD-95 (red). c, The same field as b, overlaid with GABA (blue), gephryin (yellow), and GAD (purple). Scale bar, 3 μm. d1, A subfield from b, c (black box) overlaid with GABA (blue), PSD-95 (red), gephyrin (yellow), and VGluT1 (cyan). d2, d3, The corresponding region in two adjacent serial sections. Note the consistent GABA staining of the mitochondria in the central dendrite, indicating that it is a GABAergic dendrite. Scale bar, 1 μm.
Figure 6.
Figure 6.
Effects of elution on poststain contrast. a, A representative SEM image from a section that was poststained with KMnO4, UA and Pb, without previous exposure to any buffers other than TRIS and distilled water. Scale bar, 1 μm. b, An SEM image from the same region of a nearby section from the same sample, which was first exposed to 10 min of pH 13.3 elution solution before being washed with TRIS and distilled water, then poststained with KMnO4, UA, and Pb. Scale bar, 1 μm. c, Enlargement of the region outlined by the black box in a. Scale bar, 500 nm. d, An enlargement of the region outlined by the black box in b. Scale bar, 500 nm. Both sections were simultaneously poststained on the same coverslip, and a PAP pen was used to restrict elution solution. The gain of the backscatter detector, dwell times, resolution, brightness, and contrast settings of the SEM were kept constant between the two image acquisitions. The grayscale color map used to display the images is also the same. Therefore, the lighter character of the image in b, d compared with a, c can thus be interpreted as a reduction in the contrast of detected back scattered electrons.
Figure 7.
Figure 7.
Serial-section reconstruction of the molecular organization of synapses. a, SEM images showing a glutamatergic and a GABAergic synapse (middle row). b, Synaptogram representations of the same synapses, with the corresponding IF data. Each column represents images from consecutive serial sections, and each row shows a different channel. The sections shown in a are outlined in black. The presynaptic bouton (green) and postsynaptic compartment (red) are outlined. Left, The presynaptic side of an excitatory synapse contains IF for VGluT1 and synapsin-1, with postsynaptic PSD-95 and NR1; no evidence for GABA is visible in either the presynaptic or postsynaptic compartment. Right, An inhibitory synapse contains clear presynaptic IF for GABA, GAD-65, and synapsin-1, with signal for gephyrin (GPHN) but not PSD-95. Scale bars, 1 μm.
Figure 8.
Figure 8.
GABA IF in axons and dendrites. Twenty-four axons and six dendrites with consistent GABA IF staining were traced within the dataset shown in Figures 3, 5, and Movie 1. The resulting traces included 531 axonal profiles and 133 dendritic profiles, across 27 serial sections. a, An example tracing of a GABAergic axon over 15 sections. GABA IF is overlaid in yellow. The traced outline of the axon is shown as dashed green line. The outline of a thresholded image of GABA IF is shown in red. Scale bar, 500 nm. b, An example tracing of a GABAergic presynaptic bouton, across 5 sections. Scale bar, 500 nm. c, An example tracing of a GABAergic dendrite; GABA IF is consistently visible in the mitochondria (Somogyi and Hodgson, 1985). Note excitatory synapses (white triangles) on the dendritic shaft and lack of spines. Scale bar, 500 nm. d, Proportion of pixels that exhibit GABA IF, as a function of cutoff threshold intensity. Only 8.4% of all pixels have IF intensity larger than the threshold used in ac (red lines). On the other hand, 76.0% of the pixels within the traced GABA axons were above this threshold, indicating that the GABA IF signal fills most of the axonal space. Analysis of traced axonal cross-sections (excluding pixels within 100 nm of the traced border) showed that 91.7% of those areas were covered with GABA IF above the same threshold. GABAergic dendrites were less completely filled; only 29.1% of their pixels were covered with GABA IF above this threshold. e, To evaluate consistency of GABA IF labeling in axonal processes as a function of cross-sectional area, the fraction of cross-sections which had at least 1 pixel of overlap, or 25% of its area covered with GABA IF above the threshold, was calculated as a function of the cross-sectional area. f, The corresponding frequency with which cross-sections of different sizes were observed in the data. The data are binned on a log scale, as the cross-sectional area of axons varies over two orders of magnitude. Although smaller axonal cross sections are labeled less consistently, overall the vast majority are labeled.
Figure 9.
Figure 9.
Quantitative assessment of IF-based discrimination of synapses. a, A single section shows PSD-95 IF, segmented into puncta (green outlines). b, Conjugate SEM data overlaid with puncta and EM-identified synapses from putatively glutamatergic axons (red). Puncta that do not overlap with a synapse are outlined in black. c, 3D diagram shows the section of a in green, with adjacent sections in gray. 2D puncta from adjacent sections whose IF weighted centroids are <400 nm apart are merged into 3D PSD-95 puncta (vertical lines). d, A histogram of the summed PSD-95 IF signal across puncta. Overlapping puncta (red); nonoverlapping puncta (black). The dotted black line indicates the threshold that best separates overlapping from nonoverlapping puncta. e, Summed fluorescence from four channels (left columns), and total surface area and number of 2D puncta comprising each 3D punctum (middle columns). Each row represents a punctum; grayscale represents Z-score of corresponding measurement, for each column. Puncta in the top block overlap a synapse; those in the bottom block do not. The SVM output column represents fraction of SVM classifiers, which predict that punctum to overlap. The puncta rows have been sorted within each block by SVM output. f, Quantification of synaptic detection performance when using all PSD-95 puncta (all), only those with summed PSD-95 IF above the optimal threshold (PSD IF), or those categorized as overlapping by SVM. Left, Percentage of synapses detected, by virtue of overlapping with at least one PSD-95 punctum. Right, Percentage of PSD-95 puncta that overlap with no synapses. Error bars indicate SD over 100 cross-validated SVM models. See also Figure 10.
Figure 10.
Figure 10.
Further analysis of IF-based synapse detection. a, A histogram of the 2D distances between pairs of 2D segmented PSD-95 puncta from adjacent sections. The x-axis represents the distance and the y-axis the number of pairs found at that distance. Different colors represent the number of pairs at each distance that represent pairs of PSD-95 puncta which both overlap with the same EM-identified synapse (intrasynaptic merges, dark gray bars), pairs of puncta in which the puncta overlap with distinct synapses (intersynaptic merges, white bars), or pairs in which one or more of the puncta does not overlap with a synapse (nonsynaptic merges, light gray bars). Coplotted as lines using the right hand y-axis is the fraction of pairs less than a given threshold that are intrasynaptic (dark gray line), or are either intrasynaptic or nonsynaptic (light gray line). The chosen merging threshold of 400 nm is noted as an inflection point in both cumulative fractions that captures the vast majority of all intrasynaptic merges. The schematic illustrates examples of the different types of merges, where the two columns represent the adjacent sections, the green outlines represent the pair of PSD puncta being merged, and the colored regions represent synapses. Synapses colored the same color are the same synapse, where distinct colors represent different synapses. b, A heatmap as in Figure 9e, showing all molecular metrics available in the dataset. Training a threshold classifier on each channel individually demonstrated that several metrics could predict whether PSD-95 puncta overlapped with synapses better than expected by chance (p < 0.01 by permutation test; see Materials and Methods). ci, Percentage of synapses within the dataset shown in Figure 9 that overlap with 0 (false-negative), 1 (correct), or ≥2 (double-counted) PSD-95 puncta that were classified positive by SVM models. ii, Percentage of puncta which overlap with 0 (false-positive), 1 (correct), or ≥2 (merged) synapses. Error bars indicate SD over 100 cross validated SVM models. d, Conjugate SEM data overlaid with PSD-95 puncta and EM-identified synapses from glutamatergic synapses (red) and GABAergic synapses (blue). Puncta that do not overlap with a synapse are outlined in black. This image comes from the larger dataset shown in Figure 11; all analyses shown in d, e, g, h, pertain to this dataset. e, A histogram of the summed PSD-95 IF signal across puncta. Overlapping puncta (red); nonoverlapping puncta (black). Coplotted using the right hand axis is the accuracy of simple threshold classifier as that threshold varies (solid black line). The dotted black line indicates the threshold that best predicts overlapping from nonoverlapping puncta. f, An example of a PSD-95 punctum that was classified as overlapping with synaptic contacts by the vast majority of SVM models, but in fact does not overlap. The borders of the segmented PSD-95 punctum are shown in green. Nonsynaptic PSD-95 staining is visible at the edge of a mitochondrion. g, Measurements of summed IF, total surface area and number of merged 2D puncta in each 3D punctum. Each row represents a punctum, each column a measurement. Grayscale represents Z-score of corresponding measurement. The top and bottom blocks indicate whether the punctum overlaps a glutamatergic synapse. SVM-out column represents fraction of SVM classifiers that predict that punctum to overlap. hi, Percentage of glutamatergic synapses that overlap with 0 (false-negative), 1 (correct) or ≥2 (double-counted) puncta. hii, Percentage of puncta that overlap with 0 (false-positive), 1 (correct), or ≥2 (merged) glutamatergic synapses. Error bars indicate SD over 100 cross validated SVM models. Metrics shown for all PSD-95 puncta, as well as only puncta that were classified as likely overlapping with glutamatergic synapses (SVM classified +).
Figure 11.
Figure 11.
Measuring the molecular composition of four synapse types. a, A simplified schematic of a neural circuit shows two basic cell types: GABAergic (GABA) and glutamatergic (Glut) bibiii, SEM images from three consecutive sections. EM-identified synapses overlaid in the color of their type indicated in a. c, Images of PSD-95 IF, with EM-identified synapses overlaid in the color of their type. d, Summed PSD-95 IF within each synapse versus synaptic contact area. Each column reflects a different synapse type. (Glut to Glut, n = 790; Glut to GABA, n = 108; GABA to Glut, n = 74; GABA to GABA, n = 16). Colored lines reflect linear fits to the data. Dotted gray lines show linear fits to randomly positioned synapses (n = 988). e, Summed gephyrin IF, plotted as in d.
Figure 12.
Figure 12.
Further molecular measurements of synaptic type. a, Integrated VGAT IF within each synapse, versus synaptic contact area (see Materials and Methods). Different columns represent different synaptic types. Colored lines reflect linear fits to the data. Dotted gray lines show linear fits to randomly positioned synapses (see Materials and Methods). b, Summed GAD2 IF. c, Summed GABA IF. d, Summed VGluT1 IF. e, Summed NR1 IF. f, Summed synapsin-1 IF. Different synapse types show distinct patterns of molecular composition. GABA at Glut to Glut synapses is less than expected from random locations because such synapses implicitly avoid GABAergic processes, whereas random locations have some amount of overlap. Glut to GABA synapses have slightly elevated GABA compared with random because GABA IF is present in GABAergic dendrites. g, h, For the linear fits presented in Figure 11d, e, the best fit and 95% confidence intervals for the slope of those fits are indicated. The horizontal brackets above each graph indicate that the differences in that parameter of the fits were significantly different between the bracketed groups at the p < 0.05 level, using the Tukey–Kramer method for multiple-comparison testing. g, Fits for the slope of PSD-95 IF per μm2 of synaptic area. The slope for Glut to Glut synapses was significantly different from all other synapse types, including random. The slope for Glut to GABA synapses was significantly different from all other synapse types except GABA to GABA synapses (due to its relatively high uncertainty). The slopes of both GABA types were not significantly different from simulated random synapses. These results are consistent with PSD-95 being a molecule specific to excitatory synapses, and with Glut to Glut synapses having more PSD-95 IF than Glut to GABA synapses, while controlling for differences in the distribution of their sizes. h, Fits for the slope of gephyrin IF per μm2 of synaptic area. The slope for GABA to Glut synapses was significantly different from all other synapse types, as well as from simulated random synapses. The slope for GABA to GABA synapses was significantly different from all other synapse types, as well as from simulated random synapses. No other differences were significant. These results are consistent with gephyrin being a molecule specific to inhibitory synapses, and with GABA to GABA synapses having more gephyrin than GABA to Glut synapses of equal size.

Comment in

References

    1. Ahmari SE, Buchanan J, Smith SJ. Assembly of presynaptic active zones from cytoplasmic transport packets. Nat Neurosci. 2000;3:445–451. doi: 10.1038/74814. - DOI - PubMed
    1. Anderson JR, Jones BW, Watt CB, Shaw MV, Yang JH, Demill D, Lauritzen JS, Lin Y, Rapp KD, Mastronarde D, Koshevoy P, Grimm B, Tasdizen T, Whitaker R, Marc RE. Exploring the retinal connectome. Mol Vis. 2011;17:355–379. - PMC - PubMed
    1. Berryman MA, Rodewald RD. An enhanced method for post-embedding immunocytochemical staining which preserves cell membranes. J Histochem Cytochem. 1990;38:159–170. doi: 10.1177/38.2.1688894. - DOI - PubMed
    1. Bourne JN, Harris KM. Balancing structure and function at hippocampal dendritic spines. Annu Rev Neurosci. 2008;31:47–67. doi: 10.1146/annurev.neuro.31.060407.125646. - DOI - PMC - PubMed
    1. Busse B, Smith S. Automated analysis of a diverse synapse population. PLoS Comput Biol. 2013;9:e1002976. doi: 10.1371/journal.pcbi.1002976. - DOI - PMC - PubMed

Publication types

MeSH terms

Substances

LinkOut - more resources