. 2015 Apr 16;520(7547):363-7.
doi: 10.1038/nature14363. Epub 2015 Apr 8.

SHMT2 drives glioma cell survival in ischaemia but imposes a dependence on glycine clearance

Affiliations

SHMT2 drives glioma cell survival in ischaemia but imposes a dependence on glycine clearance

Dohoon Kim et al. Nature. .

Abstract

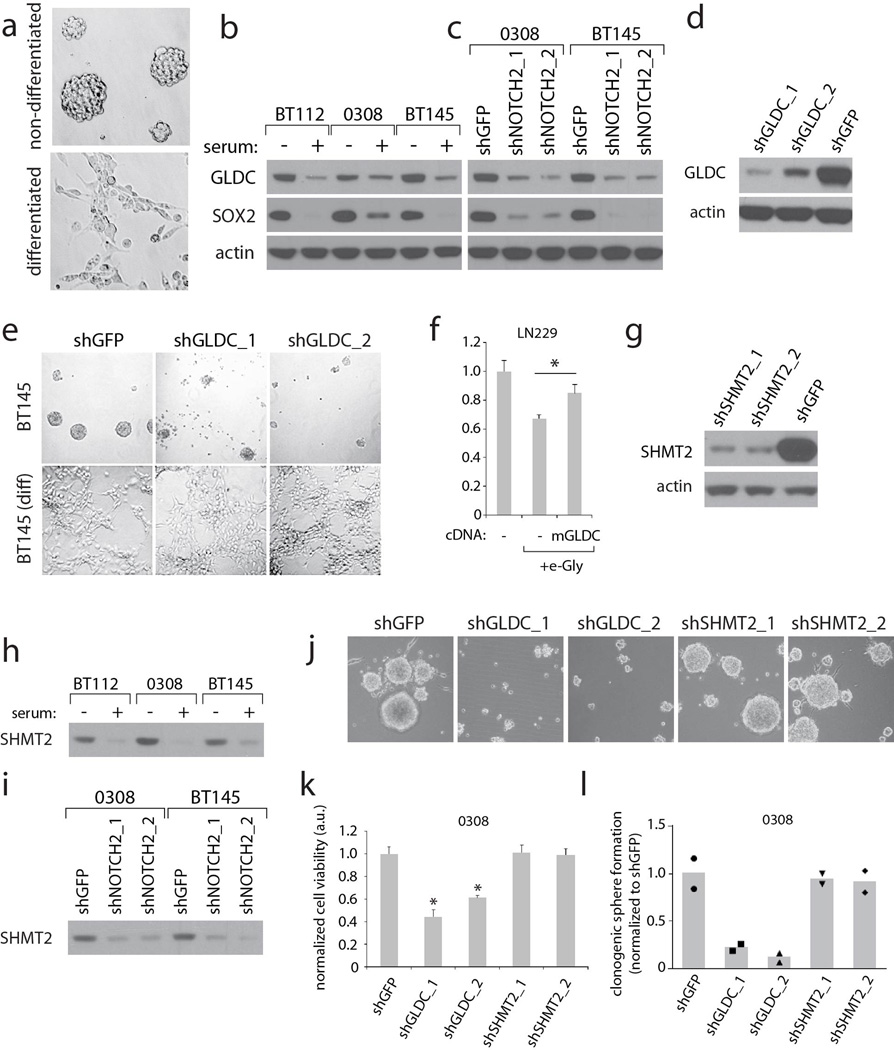
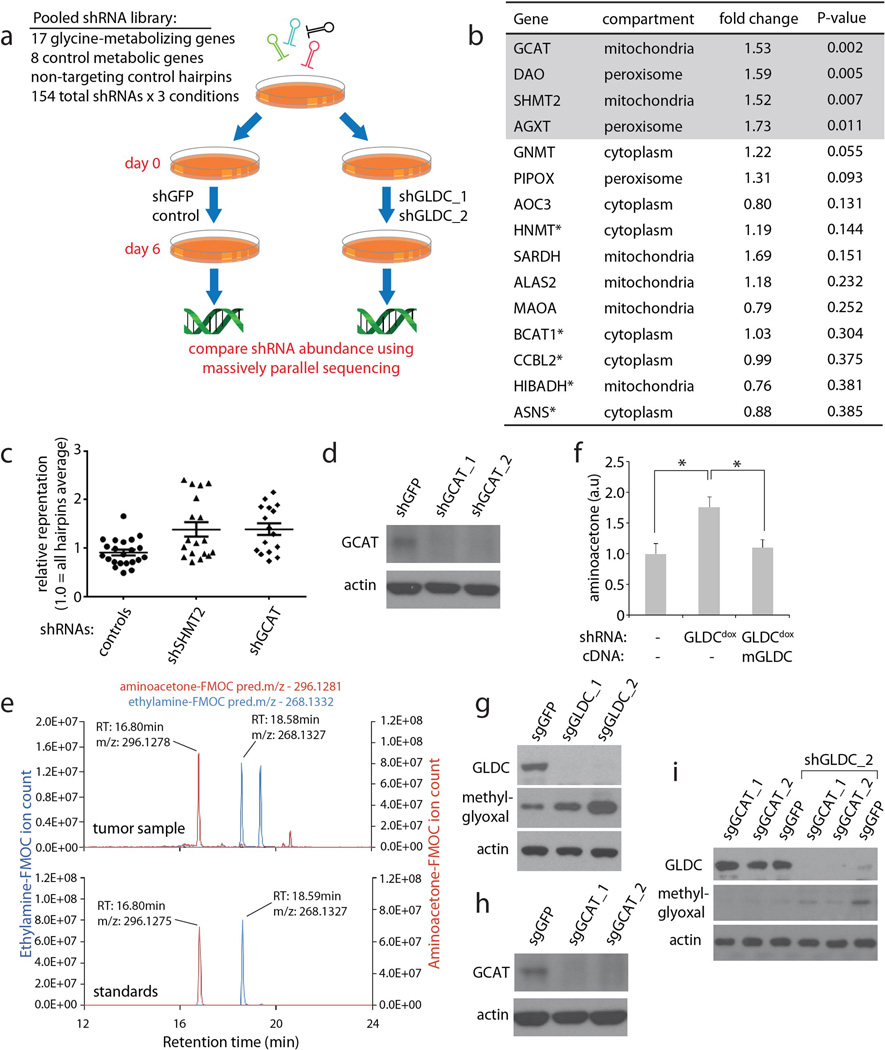
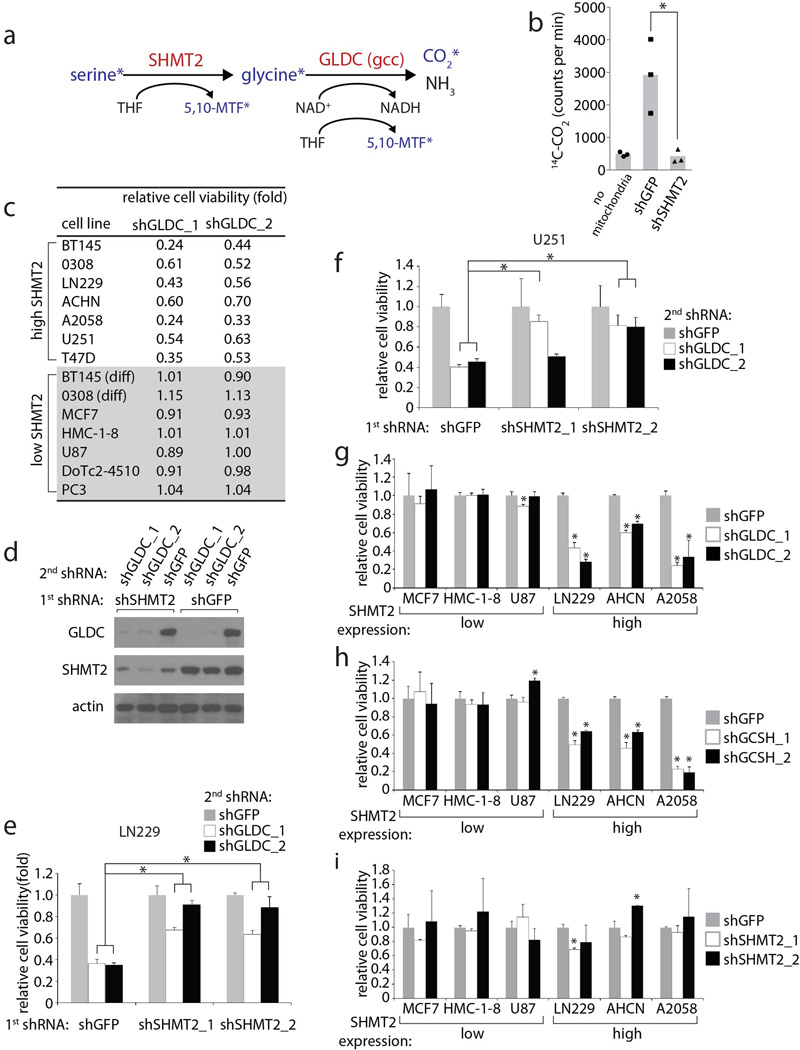
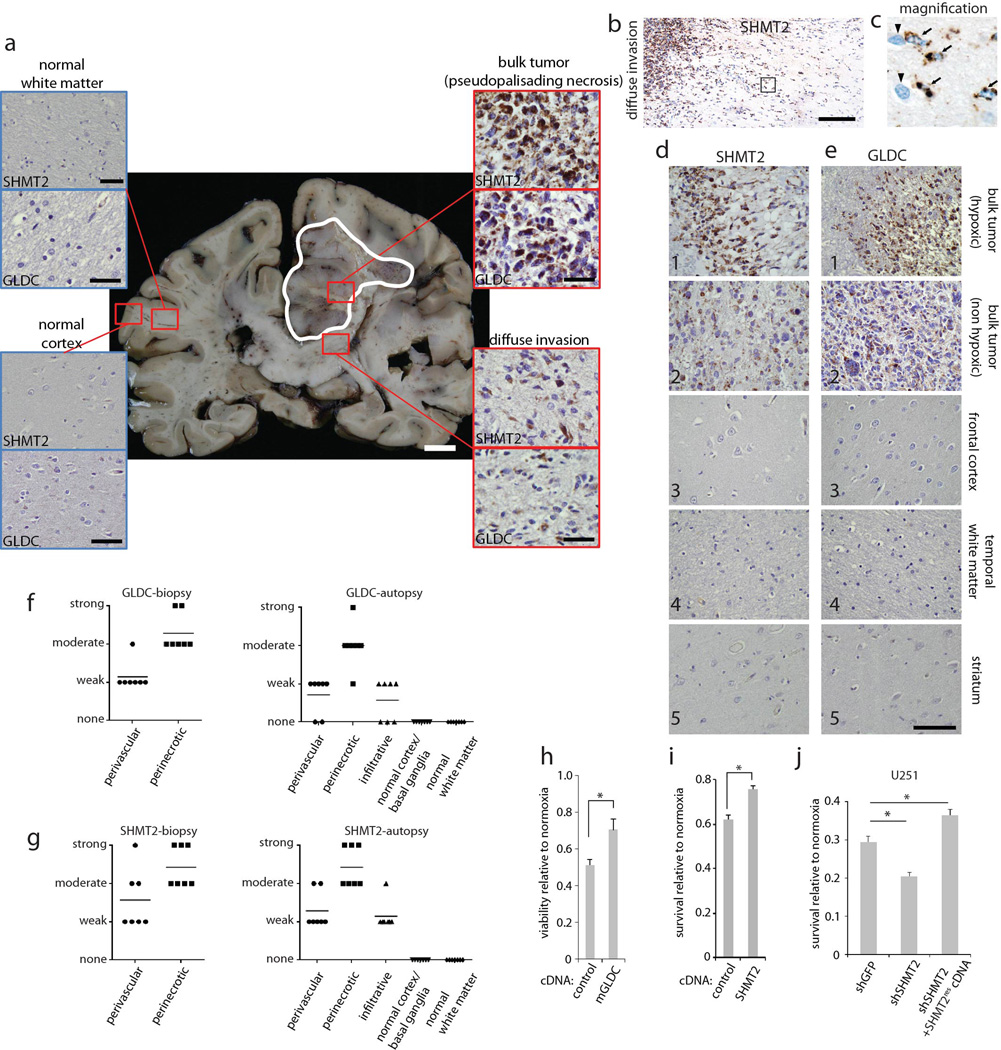
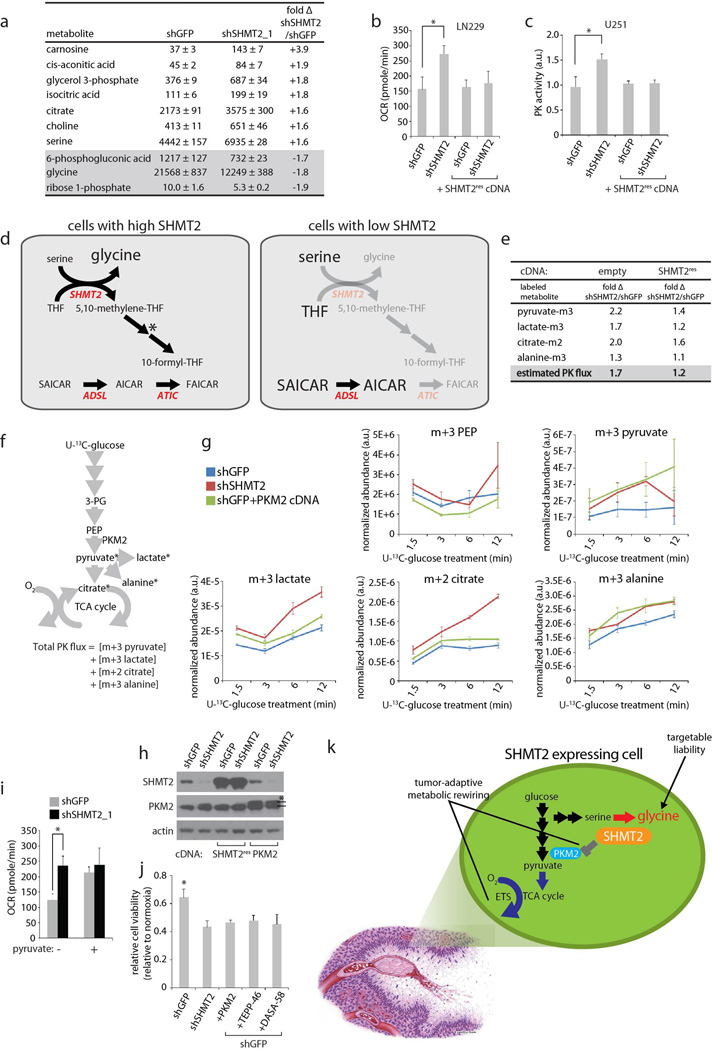
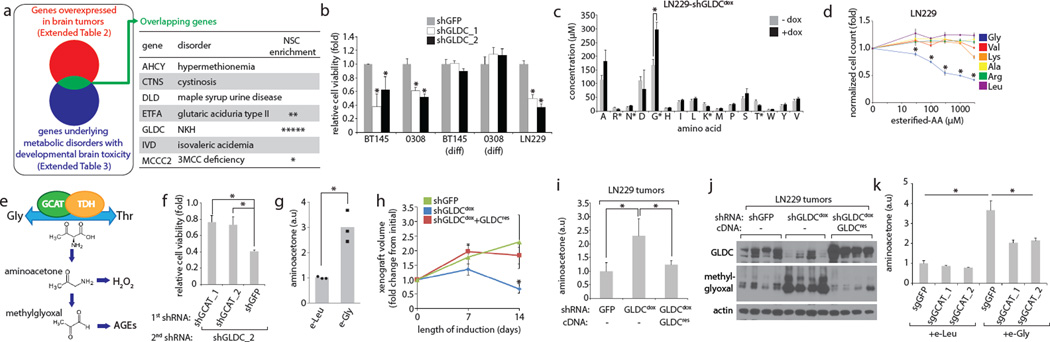
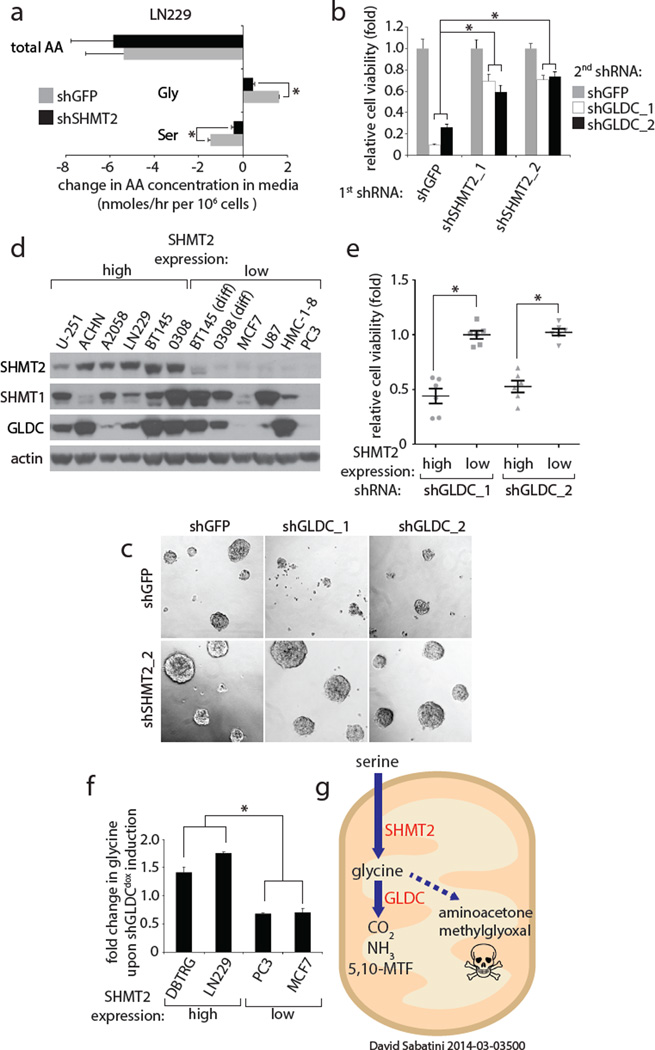
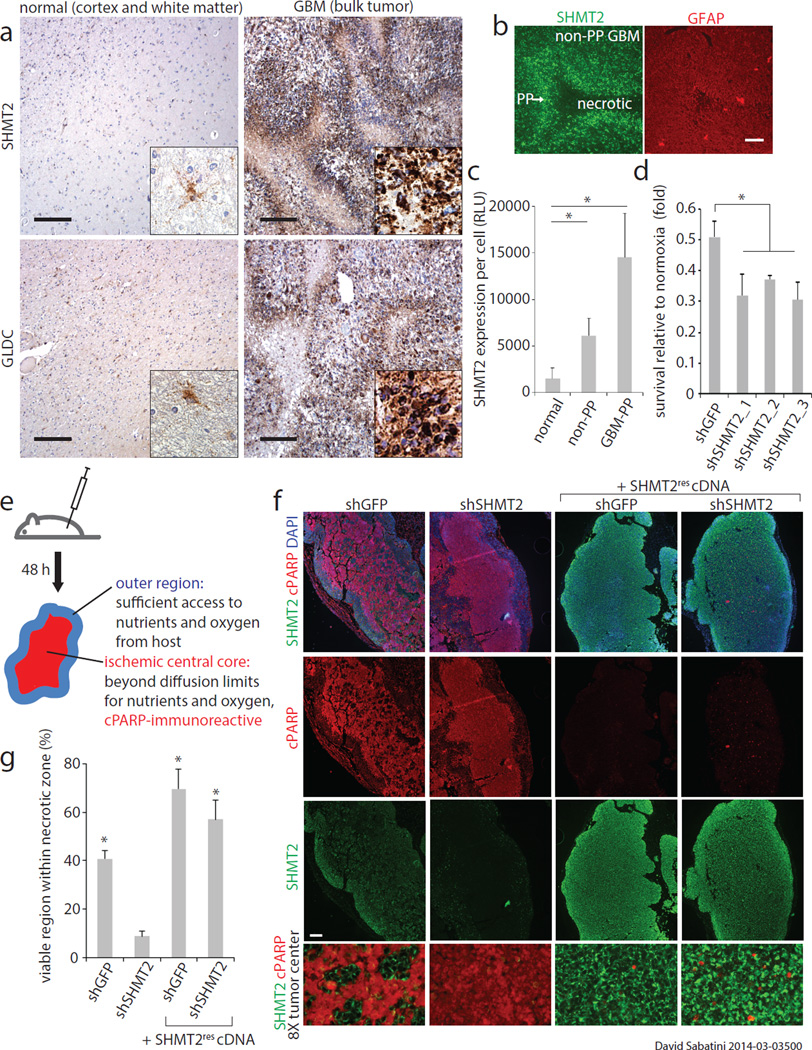
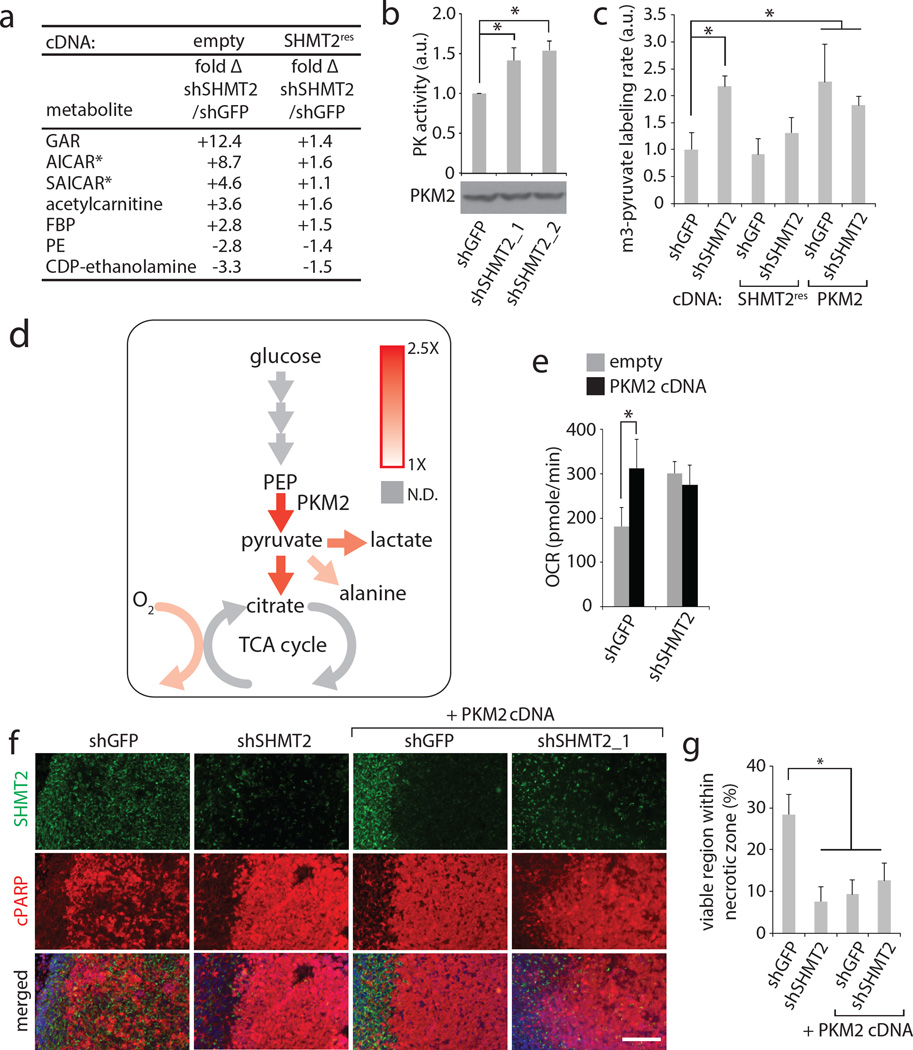
Cancer cells adapt their metabolic processes to support rapid proliferation, but less is known about how cancer cells alter metabolism to promote cell survival in a poorly vascularized tumour microenvironment. Here we identify a key role for serine and glycine metabolism in the survival of brain cancer cells within the ischaemic zones of gliomas. In human glioblastoma multiforme, mitochondrial serine hydroxymethyltransferase (SHMT2) and glycine decarboxylase (GLDC) are highly expressed in the pseudopalisading cells that surround necrotic foci. We find that SHMT2 activity limits that of pyruvate kinase (PKM2) and reduces oxygen consumption, eliciting a metabolic state that confers a profound survival advantage to cells in poorly vascularized tumour regions. GLDC inhibition impairs cells with high SHMT2 levels as the excess glycine not metabolized by GLDC can be converted to the toxic molecules aminoacetone and methylglyoxal. Thus, SHMT2 is required for cancer cells to adapt to the tumour environment, but also renders these cells sensitive to glycine cleavage system inhibition.


Figures

Extended Data Figure 1
Extended Data Figure 1. GLDC and SHMT2 expression and function in neurosphere forming cells
a, Micrographs of cells (0308 cell line) cultured under neurosphere forming conditions (top panel) or differentiated into their non-tumorigenic counterparts (bottom panel). b, Immunoblots from neurosphere forming cells maintained in the neurosphere state or differentiated by serum treatment for 1 week, with SOX-2 as a marker for the neural stem cell-like state. c, Immunoblots from neurosphere forming cells transduced with control shRNA (shGFP), or NOTCH2 shRNAs which induce differentiation, for 1 week. d, Immunoblot showing suppression of GLDC expression in BT145 cells transduced with the indicated shRNAs for 5 days. e, Micrographs from undifferentiated or serum-differentiated BT145 cells expressing shGFP or GLDC shRNAs for 6 days. f. Viability of LN229 cells overexpressing blank vector or mouse GLDC, either untreated or treated with 1 mM esterified glycine for 3.5 days as indicated. Values are relative to that of the same cells left untreated. g, Immunoblot showing suppression of SHMT2 expression in BT145 cells transduced with the indicated shRNAs for 5 days. h, Immunoblots for SHMT2 expression in cells maintained in the neurosphere forming state or induced to differentiate by serum treatment, which are from the same blot as shown in Fig. 1b. i, Immunoblots for SHMT2 expression in neurosphere forming cells transduced with control (shGFP) or NOTCH2 shRNAs, which induce differentiation, for 1 week, and are from the same blot as shown in Fig. 1c. j, Micrographs showing morphology of BT145 cells transduced with the indicated shRNAs for 6 days. k, Cell viability of 0308 cells transduced with the indicated shRNAs for 6 days. Values are normalized to the viability of shGFP transduced cells. l, Clonogenic sphere formation in 0308 cells transduced with the indicated shRNAs and then plated as single cells. The proportion of wells containing single cells that were able to form spheres are shown as values relative to shGFP- transduced cells. For l, n=2 independent biological replicates. For f and k, n=3 independent biological replicates; error bars are SD. *P<0.05 (student’s t test).
Extended Data Figure 2
Extended Data Figure 2. Identification of GCAT as a mediator of toxicity caused by GLDC suppression
a, Schematic presentation of pooled shRNA screen carried out in LN229 cells. Detailed procedures are provided in Methods. b, Table of a subset of genes examined in the pooled screen, the average fold change increase in relative abundance of all shRNAs for each gene in GLDC-suppressed conditions (shGLDC_1 and shGLDC_2) compared to the set of nontargeting control shRNAs, as described in Supplemental methods. Genes are sorted by ascending p value; the top 15 out of the 25 genes are shown. Asterisks indicate metabolic genes which do not function in glycine metabolism, included as additional controls. All shRNAs used and their abundance in each condition are shown in Supplemental Table 4. c, Relative representation, in the shGLDC infected pool, of each shRNA against non-targeting controls, SHMT2, and GCAT. A value of 1.0 indicates the average for all hairpins in the screen. Representation in both shGLDC_1 and shGLDC_2 are shown, so each hairpin is represented twice in the plot. Bars are mean±SEM. *P<0.05 (student’s t test). d, Immunoblots of LN229 cells transduced with shRNAs against GCAT as indicated. e, Extracted ion chromatogram showing peaks from FMOC derivatized aminoacetone and ethylamine (an internal standard spiked into each sample as a control for efficiency of derivatization, and recovery and detection) from pure standards (lower graph) and from a representative LN229 xenograft tumor sample (upper graph), showing a match between predicted and observed m/z values and retention times. f, Aminoacetone levels in control (no shRNA) cells, cells transduced with shGLDCdox, and cells with shGLDCdox plus shRNA-resistant mouse GLDC, which were all induced with dox for 5 days; n=3 independent biological replicates; error bars are SD. *P<0.05 (student’s t test). g, Methylglyoxal levels (argpyrimidine antibody) in LN229 cells transduced with Cas9 and single guide RNAs against GLDC for 7 days. h, Expression of GCAT in cells transduced with Cas9 and single guide RNAs against GCAT for 7 days. i, Methylglyoxal levels (argpyrimidine antibody) in LN229 cells transduced with Cas9 and the indicated single guide RNAs for 7 days, then secondarily transduced with shGLDC_2 for 5 days.
Extended Data Figure 3
Extended Data Figure 3. Effects of glycine cleavage system inhibition on cells with high or low SHMT2 expression levels
a, Overview of the serine hydroxymethyltransferase and glycine cleavage reactions mediated by SHMT2 and GLDC, respectively. Asterisks indicate metabolites that are labeled with 13C during mitochondrial metabolism of U-13C serine. Only upon completion of both reactions will 13C-labeled CO2 be formed, which is captured and detected by scintillation as described in Methods. b, Measurement of 13CO2 production, a readout of sequential SHMT2 and GLDC activity on [U-13C]-serine, in intact mitochondria isolated from LN229s expressing shGFP or shSHMT2_1, as described in Methods. c, Table indicating cell viability in various cell lines following transduction of GLDC shRNAs for 6–7 days. Values are relative to the CTG signal of the same cells secondarily transduced with shGFP and grown in parallel. d, SHMT2 and GLDC expression in LN229 cells stably transduced with shSHMT2_1 or shGFP, then secondarily transduced shGLDC or shGFP as indicated. e, Viability of LN229 cells first transduced with control or SHMT2 shRNAs, then transduced with shGFP or GLDC shRNAs for 5 days. Values are relative to that of cells secondarily transduced with shGFP. f, Viability of U251 cells first transduced with control or SHMT2 shRNAs, then transduced with shGFP or GLDC shRNAs for 7 days. Values are relative to that of cells secondarily transduced with shGFP. g,h,i, Viability of various cell lines transduced with shRNAs targeting (g) GLDC, (h) GCSH (glycine cleavage system protein H, another integral component of the glycine cleavage system), or (i) SHMT2. Values are relative to those of the cells expressing shGFP, which were grown in parallel. For b,c, and e–i, n=3 independent biological replicates; error bars are SD. *P<0.05 (student’s t test).
Extended Data Figure 4
Extended Data Figure 4. GLDC and SHMT2 expression in GBM tumors
a, SHMT2 and GLDC expression across GBM and normal brain regions as examined in autopsy sections. A whole coronal section is shown, with the GBM bulk tumor outlined in white. Insets indicate magnified micrographs from the regions, indicated by the small red squares, from the same brain. For the bulk tumor insets, cells around the pseudopalisading necroses are shown. Additional GBM and normal brain are shown in Extended Data Figure 4. Scale bar for whole coronal section = 1 cm, and for insets = 100 µm. b, SHMT2 expression at the GBM-normal brain interface, showing SHMT2-immunoreactivity in migrating cells. Scale bar = 100 µm. c, Magnified image of the boxed region in b. d and e, High magnification micrographs of SHMT2 and GLDC expression, respectively, in 1) perinecrotic GBM tumor, 2) non-ischemic bulk tumor, 3) frontal cortex, 4) temporal white matter, and 5) striatum from autopsy cases. Scale bar = 100 µm. f, Semi-quantitative scoring of GLDC staining intensity by neuropathologist (M.S.) on 7 tumor biopsy cases (left) and 7 autopsy cases (right). g, Semi-quantitative scoring of SHMT2 staining intensity by neuropathologist (M.S.) on 7 tumor biopsy cases (left) and 7 autopsy cases (right). h, Viability of LN229 cells expressing an empty vector control or mouse GLDC cDNA and cultured in 0.5% hypoxia for 8 days. Values are relative to that of the same cells cultured in parallel in normoxia. i, Cell number counts from LN229 cells expressing an empty vector control or SHMT2 cDNA and cultured in 0.5% hypoxia for 8 days. Values are relative to the counts of the same cells cultured in parallel in normoxia. j. Viability of U251 cells expressing shRNA or cDNAs as indicated and cultured in 0.5% hypoxia for 6 days. Values are relative to that of the same cells cultured in parallel in normoxia. For f and g, bars indicate the mean. For h,i, and j, n=3 independent biological replicates; error bars are SD. *P<0.05 (student’s t test).
Extended Data Figure 5
Extended Data Figure 5. Effects of SHMT2 expression on PKM2 activity and cell metabolism
a, Absolute quantitative CE-MS measurement of intracellular metabolites from LN229 cells stably expressing indicated shRNAs without media change for 84 hours. The metabolites with the greatest fold change are listed, in units of pmol/106 cells. All metabolites listed are changed in a statistically significant manner (student’s t test, P<0.05). Data for all 116 metabolites in the analysis are in Supplementary Table 4. b, Oxygen consumption in LN229 cells (in RPMI media) transduced with indicated shRNAs and cDNAs. Error bars are SD (n=4 technical replicates). c, Pyruvate kinase activity assay from lysates of U251 cells transduced with indicated shRNAs or cDNAs. d, Proposed mechanism by which SHMT2 inhibition could lead to an increase in AICAR and SAICAR. In cells with high SHMT2 expression, 10-formyl-THF, which is a downstream product of SHMT2 activity, serves as a cofactor for cytosolic 5-aminoimidazole-4-carboxamide ribonucleotide formyltransferase (ATIC) in the conversion of AICAR to FAICAR during purine biosynthesis. In the absence of SHMT2, a lack 10-formyl-THF production could lead to accumulation of AICAR and SAICAR. As indicated by the asterisk, the contribution of SHMT2 to cytosolic 10-formyl-THF formation may be direct, occur via export of formate from the mitochondria, or occur indirectly by changing serine/glycine levels and thereby altering SHMT1 activity. e, 13C labeling rates of pyruvate and its downstream metabolites in cells from e. Labeling rates are relative and expressed as fold changes in cells transduced with shSHMT2_1 versus cells transduced with shGFP, with or without RNAi-resistant SHMT2 cDNA. Estimated PK flux is the calculated total flux to the four product species in moles of 13C per unit time. Plots for individual labeled species over time are shown in Extended Data Figure 5d and Supplementary Table 9. f, Scheme for calculating total PK flux by measuring the net molar labeling of [U-13C]-glucose derived, PK product species. Estimated PK flux is the calculated total flux to the four product species in moles of 13C per unit time. g, Plots of glucose-derived labeled species abundance over time for shGFP, shSHMT2, and shGFP plus PKM2 cDNA expressing LN229 cells shown in Fig. 4e–g. Raw data, calculations and plots for all stable cell lines are shown in Supplemental data tables 8 and 9. h, SHMT2 and PKM2 expression in LN229 cells transduced with shRNAs and cDNAs as indicated. Asterisk indicates the overexpressed PKM2, which shows higher migration due to Flag tag. i, Oxygen consumption in LN229 cells expressing shGFP or shSHMT2_1 in RPMI media with or without 1 mM pyruvate. Error bars are SD (n=4 technical replicates). j, Viability of LN229 cells transduced with shRNAs or cDNAs as indicated, and also treated with vehicle or 50 uM of TEPP-46 or DASA-58 as indicated, then subjected to hypoxia for 6 days. Values are relative to the same cells grown in parallel in normoxia. k, Overview of effects of SHMT2 expression on cell metabolism, tumor cell survival, and liability to toxic glycine accumulation. Red arrow indicates upregulation, and blue arrow indicates downregulation. Gray bar indicates the inhibitory effect of SHMT2 activity on PKM2 activity. Depiction of pseudopalisading necrosis is adapted from a previous review (Brat and Meir, Laboratory Investigation 84(4):397–405). Illustration by Mica Duran. For a,c,e,g, and j, n=3 independent biological replicates; error bars are SD. *P<0.05 (student’s t test).
Figure 1
Figure 1. GLDC is required to prevent glycine accumulation and its conversion to aminoacetone and methylglyoxal
a, Candidate gene identification scheme. Each asterisk in the “NSC enrichment” column indicates that the given gene was significantly overexpressed (over 2-fold, p < 0.05) in neural stem cells compared to differentiated controls (Methods; total of 5 microarray studies). b, Viability of cells expressing the indicated shRNAs for 6 days. Values are relative to that of cells expressing shGFP. c, Amino acid analysis of LN229 cells with or without doxycycline induction of shGLDCdox for 5 days. d, Cell numbers following treatment with indicated doses of esterified amino acids for 5 days. Values are relative to the cell number counts of untreated controls. e, Diagram depicting glycine/threonine interconversion. f, Viability of LN229 cells first transduced with control (shGFP) or GCAT shRNAs, then transduced with shGLDC_2 shRNA for 5 days. Values are relative to that of the same cells secondarily transduced with shGFP instead of shGLDC_2. g, Aminoacetone levels in LN229 cells treated with 1 mM esterified leucine or glycine for 3 days. h, Volumes of xenografts formed from LN229 cells expressing shGFP (n=5), shGLDCdox (n=8), or shGLDCdox plus shRNA-resistant GLDC (n=8). Tumors were allowed to form for two weeks prior to dox induction (Methods). Volumes are shown as relative to the starting volume (at beginning of induction) for each tumor. Error bars are SE. i, Aminoacetone levels, normalized to tumor weight, from xenograft tumors shown in h, n=4 per group. j, Immunoblots from xenograft tumors shown in h. Methylglyoxal levels are indicated by argpyrimidine antibody which recognizes proteins modified by methylglyoxal. k, Aminoacetone levels in cells stably transduced with Cas9 and single guide RNA against GCAT or control (GFP), and treated (4 days and 2 days prior to collection) with 1 mM esterified leucine or glycine. For b,c,d,f,g, and k, n=3 independent biological replicates; error bars are SD. For h, and i, each n is a xenograft tumor; error bars are SD. For all panels, *P<0.05 (student’s t test).
Figure 2
Figure 2. SHMT2 activity renders cells liable to toxic accumulation of glycine upon GLDC loss
a, Changes in serine, glycine, and total amino acid levels over 84 hours in media of LN229 cells expressing shGFP or shSHMT2_1, measured using absolute quantitative CE-MS (Methods). Positive values (right of the y axis) indicate a net accumulation in the media, while negative values indicate net consumption from the media. b, Viability of BT145 cells first transduced with shGFP or SHMT2 shRNAs, then with shGFP or GLDC shRNAs for 5 days. Values are relative to that of cells secondarily transduced with shGFP. c, Representative micrographs of b. d, Immunoblots in a panel of cell lines with high or low SHMT2 expression. e, Viability of cell lines in the high and low expression groups expressing shGLDC_1 and shGLDC_2 for 6–7 days. Values are relative to the viability of the same cells secondarily transduced with shGFP; individual results shown in Extended Data Fig. 3a. f, Glycine levels upon doxycycline-induced expression of shGLDC_2 for 5 days in different cell lines; values are relative to cells without induction; 1.0 indicates no change. g, Schematic of serine/glycine metabolism and cell survival in cancer cells. For a,b, and f, n=3 independent biological replicates; error bars are SD. For e, each point (n=6) represents a single cell line from g. Bars are mean ± SEM. For all panels, *P<0.05 (student’s t test).
Figure 3
Figure 3. SHMT2 expression provides a survival advantage in the ischemic tumor microenvironment
a, SHMT2 and GLDC expression in normal human brains and GBM tumors. Insets are 5× fold magnifications. Representative images are shown; comprehensive histological analyses are in Extended Data Figure 5. Scale bar = 200 µm. b, SHMT2 immunofluorescence in the cells in the pseudopalisades (PP) and in the non-pseudopalisade GBM regions. Glial fibrillary acidic protein (GFAP), a general GBM cell marker, does not show increased signal in pseudopalisades. c, Quantification of SHMT2 expression, measured as fluorescence intensity per cell, in normal brain regions, non-pseudopalisade GBM regions, and pseudopalisade regions (n=5 patient samples per group). Error bars are SD. d, Cell number counts from LN229 cells expressing shRNAs against GFP or SHMT2 and cultured in 0.5% hypoxia for 8 days. Values are relative to the counts of the same cells cultured in parallel in normoxia; n=3 independent biological replicates; error bars are SD. e, Schematic of experimental design for rapid xenograft model. f, Representative micrographs of rapid xenograft tumors formed by LN229 cells transduced with indicated shRNAs and cDNAs, and immunostained for SHMT2 and cleaved PARP. Bottom row shows 8× magnified, merged images of the central tumor region, displayed without DAPI channel for clarity. Scale bar = 200 µm. g, Quantification of the percentage of cleaved PARP-negative, viable area within the central necrotic region of xenografts of as shown in f. Error bars are SEM (shGFP, n=10; shSHMT2_1, n=9; shGFP+SHMT2rescDNA, n=8; shSHMT2_1 +SHMT2rescDNA, n=8; each n is a xenograft tumor). For all panels, *P<0.05 (student’s t test).
Figure 4
Figure 4. SHMT2 elicits a PKM2-dependent metabolic rewiring that is advantageous to cancer cells in an ischemic environment
a, Liquid chromatography-mass spectrometry (LC-MS) based, untargeted discovery of metabolites that change in abundance following SHMT2 knockdown in LN229 cells. GAR- glycineamideribotide; FBP – fructose bisphosphate (either 1,6 or 2,6; cannot be distinguished by LC-MS); PE- phosphoethanolamine. Differential peaks were identified and quantified as described in the Methods, and the metabolites with largest change are listed. Metabolite levels are relative and are expressed as fold change in cells transduced with shSHMT2_1 versus cells transduced with shGFP, with or without the RNAi-resistant SHMT2 cDNA. All differences in first column are significant (P<0.05). b, Pyruvate kinase activity assay from lysates of LN229 cells transduced with indicated shRNAs. c, m3-pyruvate labeling rates in LN229 cells transduced with shRNAs and cDNAs as indicated, and fed [U-13C]-glucose media. d, Summary diagram of labeling rate changes seen as a result of SHMT2 silencing. Colored arrows indicate increased flux according to the heat map, while gray arrows indicate non-determined labeling rates. Detailed analyses are in Extended Data Fig. 5. e, Oxygen consumption in LN229 cells (in RPMI) expressing shGFP or shSHMT2_1 with or without PKM2 cDNA. Error bars are SD (n=5 technical replicates). f, Representative micrographs of rapid xenograft tumors formed from LN229 cells stably expressing indicated shRNAs and cDNAs, and immunostained for SHMT2 and cleaved PARP. Viable regions are oriented on the left, and the central ischemic regions on the right. Scale bar = 100 µm. g, Quantification of the percentage of cleaved PARP-negative, viable area within the central necrotic region of xenografts of as shown in f. Error bars are SEM (shGFP, n=10; shSHMT2_1, n=8; shGFP+PKM2 cDNA, n=10; shSHMT2_1 + PKM2 cDNA, n=6; each n is a xenograft tumor). For a,b, and c, n=3 independent biological replicates; error bars are SD. For all panels, *P<0.05 (student’s t test).

References

    1. Cantor JR, Sabatini DM. Cancer cell metabolism: one hallmark, many faces. Cancer Discov. 2012;2:881–898. - PMC - PubMed
    1. Tennant DA, Duran RV, Gottlieb E. Targeting metabolic transformation for cancer therapy. Nat Rev Cancer. 2010;10:267–277. - PubMed
    1. Vander Heiden MG, Cantley LC, Thompson CB. Understanding the Warburg effect: the metabolic requirements of cell proliferation. Science. 2009;324:1029–1033. - PMC - PubMed
    1. Mattson MP, Shea TB. Folate and homocysteine metabolism in neural plasticity and neurodegenerative disorders. Trends Neurosci. 2003;26:137–146. doi:S0166-2236(03)00032-8 [pii] 10.1016/S0166-2236(03)00032-8. - PubMed
    1. Saudubray JM, Van den Berghe G, Walter J. Inborn metabolic diseases : diagnosis and treatment. 5th edn. Springer; 2012.

Supplementary References

    1. Mehta S, et al. The central nervous system-restricted transcription factor Olig2 opposes p53 responses to genotoxic damage in neural progenitors and malignant glioma. Cancer Cell. 2011;19:359–371. - PMC - PubMed
    1. Chudnovsky Y, et al. ZFHX4 Interacts with the NuRD Core Member CHD4 and Regulates the Glioblastoma Tumor-Initiating Cell State. Cell Rep. 2014;6:313–324. - PMC - PubMed
    1. Possemato R, et al. Functional genomics reveal that the serine synthesis pathway is essential in breast cancer. Nature. 2011;476:346–350. - PMC - PubMed
    1. Rhodes DR, et al. ONCOMINE: a cancer microarray database and integrated data-mining platform. Neoplasia. 2004;6:1–6. - PMC - PubMed
    1. Luo B, et al. Highly parallel identification of essential genes in cancer cells. Proc Natl Acad Sci U S A. 2008;105:20380–20385. - PMC - PubMed

Publication types

MeSH terms

LinkOut - more resources