. 2015 Dec;26(12):2978-87.
doi: 10.1681/ASN.2014010118. Epub 2015 Apr 8.

P2Y12 Receptor Localizes in the Renal Collecting Duct and Its Blockade Augments Arginine Vasopressin Action and Alleviates Nephrogenic Diabetes Insipidus

Affiliations

P2Y12 Receptor Localizes in the Renal Collecting Duct and Its Blockade Augments Arginine Vasopressin Action and Alleviates Nephrogenic Diabetes Insipidus

Yue Zhang et al. J Am Soc Nephrol. 2015 Dec.

Abstract

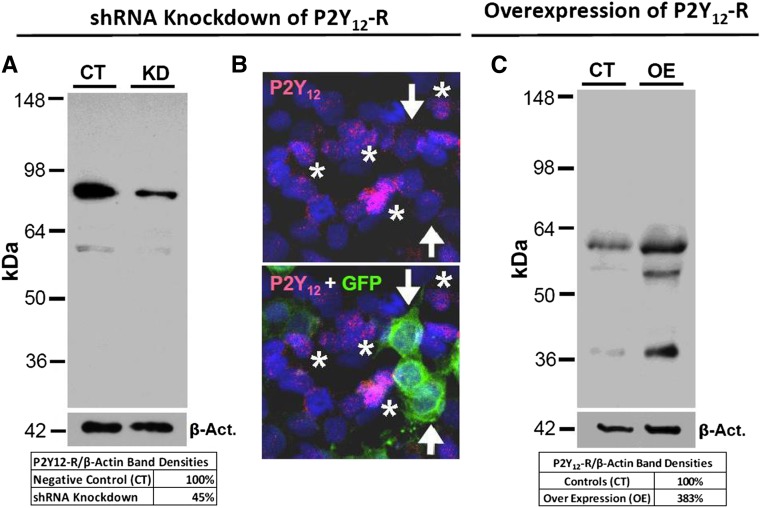
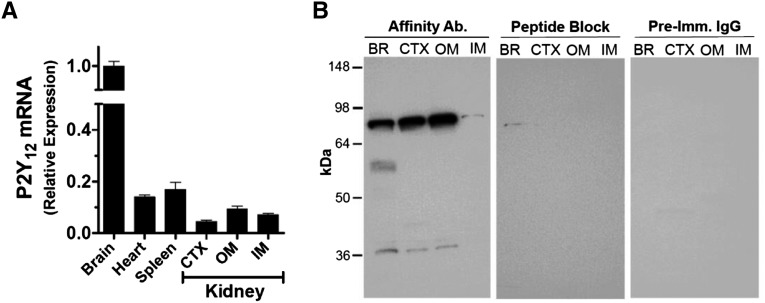
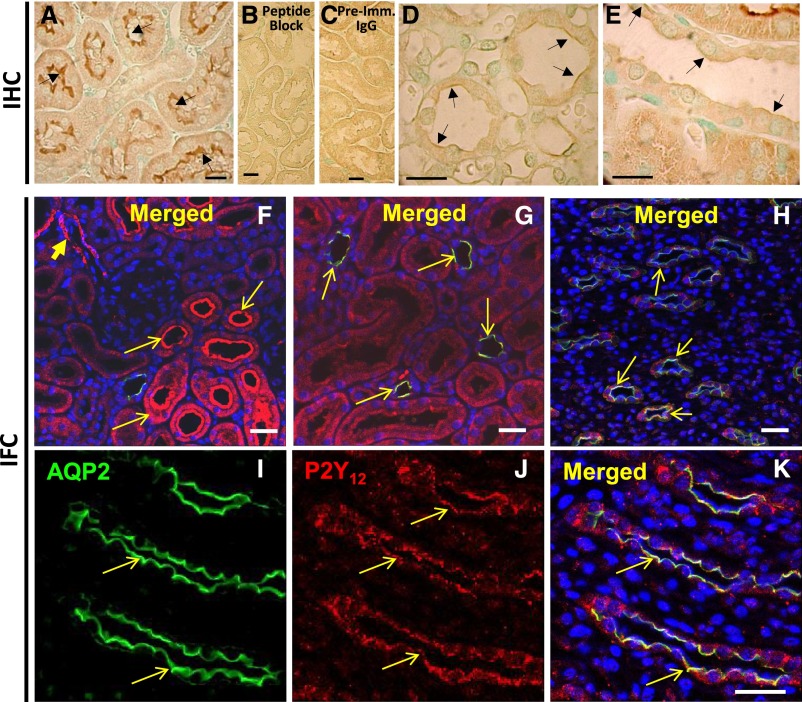
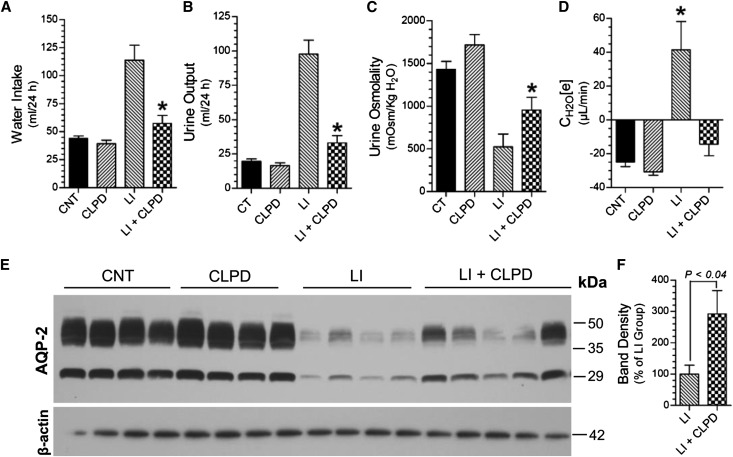
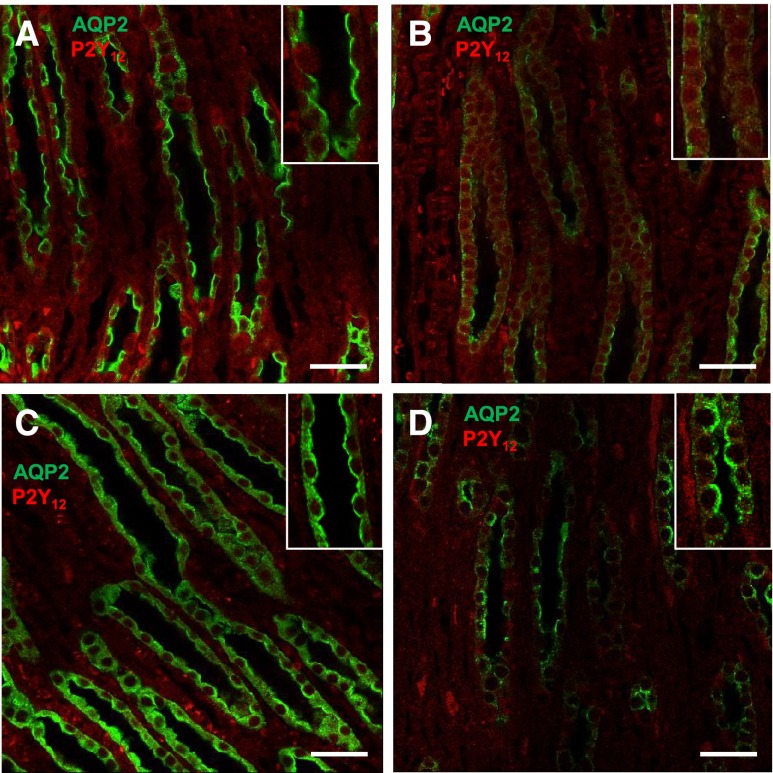
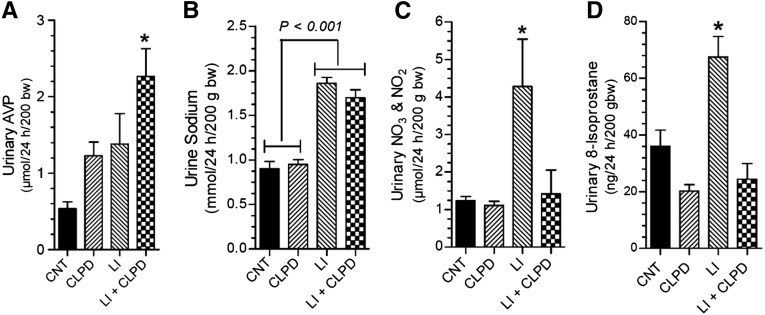
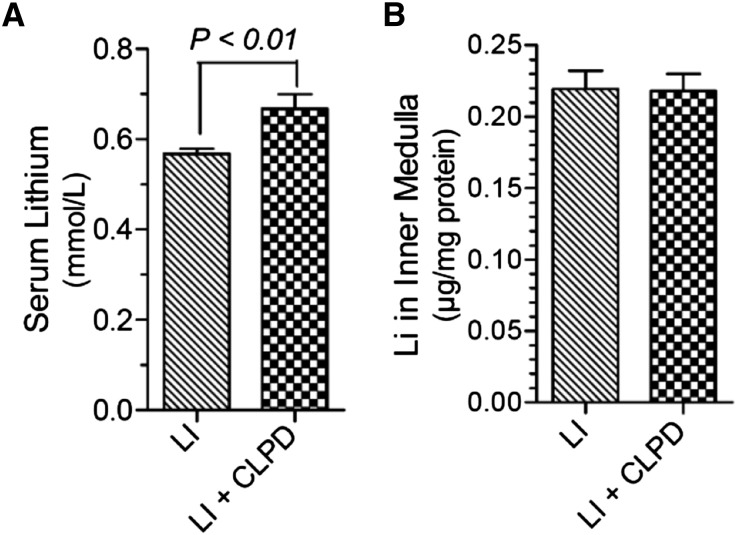
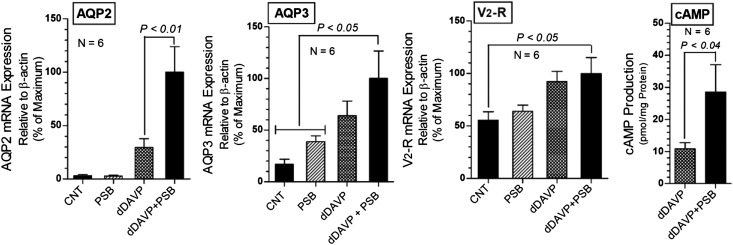
P2Y12 receptor (P2Y12-R) signaling is mediated through Gi, ultimately reducing cellular cAMP levels. Because cAMP is a central modulator of arginine vasopressin (AVP)-induced water transport in the renal collecting duct (CD), we hypothesized that if expressed in the CD, P2Y12-R may play a role in renal handling of water in health and in nephrogenic diabetes insipidus. We found P2Y12-R mRNA expression in rat kidney, and immunolocalized its protein and aquaporin-2 (AQP2) in CD principal cells. Administration of clopidogrel bisulfate, an irreversible inhibitor of P2Y12-R, significantly increased urine concentration and AQP2 protein in the kidneys of Sprague-Dawley rats. Notably, clopidogrel did not alter urine concentration in Brattleboro rats that lack AVP. Clopidogrel administration also significantly ameliorated lithium-induced polyuria, improved urine concentrating ability and AQP2 protein abundance, and reversed the lithium-induced increase in free-water excretion, without decreasing blood or kidney tissue lithium levels. Clopidogrel administration also augmented the lithium-induced increase in urinary AVP excretion and suppressed the lithium-induced increase in urinary nitrates/nitrites (nitric oxide production) and 8-isoprostane (oxidative stress). Furthermore, selective blockade of P2Y12-R by the reversible antagonist PSB-0739 in primary cultures of rat inner medullary CD cells potentiated the expression of AQP2 and AQP3 mRNA, and cAMP production induced by dDAVP (desmopressin). In conclusion, pharmacologic blockade of renal P2Y12-R increases urinary concentrating ability by augmenting the effect of AVP on the kidney and ameliorates lithium-induced NDI by potentiating the action of AVP on the CD. This strategy may offer a novel and effective therapy for lithium-induced NDI.

Keywords: collecting ducts; cyclic AMP; diabetes insipidus; extracellular; hypothalamus; nucleotides; vasopressin.


Figures

Figure 1.
Figure 1.
Characterization of specificity of P2Y12-R antibody. (A) Western analysis of knockdown (KD) of P2Y12-R showing receptor protein abundance in IMCD3 cells transfected with scrambled (CT) or P2Y12-R specific shRNA (KD), relative to the respective protein abundances of β-actin; the table below the blots shows the percent P2Y12-R protein remaining after KD. (B) IF detection of GFP (green) and P2Y12-R (red) in the IMCD3 cells transfected with shRNA plasmids specific for P2Y12-R. Cell nuclei were stained with propidium iodide (blue). Upper panel shows P2Y12-R labeling in a profile of cells, whereas the lower panel is overlay of GFP labeling on the same profile of cells. Note a near complete KD of P2Y12-R expression (arrows in the upper panel) in transfected cells (arrows in the lower panel). Asterisks indicate nontransfected cells showing P2Y12-R labeling (red). (C) P2Y12-R protein abundance in control (CT) or human P2Y12-R overexpressing (OE) HEK293T cells relative to the respective protein abundances of β-actin; the table below the blots shows the percent overexpression of P2Y12-R protein. Act., actin.
Figure 2.
Figure 2.
P2Y12-R expression in rat kidney. (A) P2Y12-R mRNA expression relative to that of β-actin in the three major regions of the kidney and other organs of rat. CTX, cortex; OM, outer medulla; IM, inner medulla. Bars show mean±SEM of triplicate real-time PCR assays, plotted relative to the expression levels in the brain. (B) P2Y12-R protein in the rat kidney and brain. Identical immunoblots prepared by applying equal amounts of protein (30 µg) from solubilized homogenates of rat brain (BR), renal cortex (CTX), or outer medulla (OM) or inner medulla (IM) were incubated with the affinity purified P2Y12-R antibody (Ab.) or the antibody blocked by the immunizing peptide or with protein A-purified preimmune (Imm.) IgG as marked on the top of the panels.
Figure 3.
Figure 3.
Immunolocalization of P2Y12-R protein in rat kidney. Upper row: Immunoperoxidase labeling for P2Y12-R: (A) labeling of brush border membrane of proximal tubules (PT); (B) peptide-block ablated the labeling in PT; (C) substitution of antibody with preimmune (Imm.) IgG showed no labeling in the PT (arrows); weak labeling on the apical aspect of the CD in the medulla (D), and cortex (E) (arrows). Middle and lower rows: IF labeling of AQP2 (green) and P2Y12-R (red): (F) and (G) are low magnification profiles of cortical region, showing labeling of arterioles (arrowhead in F), proximal tubules (arrows in F), and cortical CDs showing merging of labeling of AQP2 and P2Y12-R (arrows in G). (H) Low magnification profile of inner medullary region showing labeling of CDs for AQP2 and P2Y12-R. (I)–(K) High magnification images of inner medullary region showing labeling of medullary CDs for AQP2 or P2Y12-R or merging of both. Cell nuclei were labeled with DAPI. Bars are 20 µm in length.
Figure 4.
Figure 4.
Effect of clopidogrel administration on Li-induced polyuria and decrease in AQP2 protein abundance in rats. (A) Water intake; (B) urine output; (C) urine osmolality; and (D) electrolyte-free water clearance on the last day (day 13). CNT, control group; CLPD, clopidogrel-treated group; LI, Li-treated group; LI+CLPD, combined treatment with Li and clopidogrel. n=7 rats/group for (A), (B), and (C); n=4–5 rats for (D). *P<0.05 versus Li groups by ANOVA followed by Tukey–Kramer multiple comparison test [(A)–(D)]. (E) Representative immunoblot of AQP2 and β-actin proteins run with inner medullary tissue samples. (F) Densitometry of AQP2 protein bands in Li and Li+CLPD groups relative to β-actin protein bands; P value by Mann–Whitney nonparametric method.
Figure 5.
Figure 5.
Effect of clopidogrel treatment on Li-induced cellular expression and disposition of AQP2 (green) and P2Y12-R (red) proteins in rat IMCD. Representative low magnification profiles of IF labeling for AQP2 and P2Y12-R in the renal medullas of rats treated with no drug (A), Li (B), clopidogrel (C), or a combination of Li and clopidogrel (D). Insets show corresponding higher magnification profiles. Bar 20 µm.
Figure 6.
Figure 6.
Effect of clopidogrel on Li-induced alterations in urinary parameters. (A) Urine AVP; (B) urine sodium; (C) urine total nitrates (NO3) and nitrites (NO2); and (D) urine 8-isoprostane. bw, body weight; CNT, control group; CLPD, clopidogral group; LI, Li alone; LI+CLPD, combination of Li and CLPD. n=4–6 rats per group. *Significantly different from all other groups by ANOVA followed by Tukey–Kramer multiple comparison test.
Figure 7.
Figure 7.
Effect of clopidogrel on Li disposition in the rat. (A) Terminal Li levels in serum (n=6 rats per group). (B) Li accumulation in the inner medulla (n=4–5 rats per group). Statistical analysis by unpaired t test. LI, Li alone; LI+CLPD, combination of Li and CLPD.
Figure 8.
Figure 8.
Effect of blockade of P2Y12-R on dDAVP effect in primary cultures of rat IMCD cells. Effect of PSB-0739 (100 nM), a selective antagonist of P2Y12-R on dDAVP (50 nM) induced expression of AQP2 and AQP3 water channels and vasopressin V2 receptor mRNA and cAMP production. PSB-0739 was added 24 hours before the addition of dDAVP, and the incubation was continued for another 24 hours. Results of two independent experiments were pooled to obtain n=6 for each condition (mean±SEM). For gene expression, before pooling the data, the values were normalized as percent maximum response for each set of culture. Statistical significance shown above the bars is derived by ANOVA followed by Tukey–Kramer multiple comparison test (AQP2, AQP3, and V2-R) or unpaired t test (cAMP). CNT, controls; dDAVP, desmopressin; PSB, PSB-0739.

Similar articles

Cited by

References

    1. Brown D, Bouley R, Păunescu TG, Breton S, Lu HA: New insights into the dynamic regulation of water and acid-base balance by renal epithelial cells. Am J Physiol Cell Physiol 302: C1421–C1433, 2012 - PMC - PubMed
    1. Kishore BK, Nelson RD, Miller RL, Carlson NG, Kohan DE: P2Y(2) receptors and water transport in the kidney. Purinergic Signal 5: 491–499, 2009 - PMC - PubMed
    1. Vallon V, Rieg T: Regulation of renal NaCl and water transport by the ATP/UTP/P2Y2 receptor system. Am J Physiol Renal Physiol 301: F463–F475, 2011 - PMC - PubMed
    1. Radin MJ, Yu MJ, Stoedkilde L, Miller RL, Hoffert JD, Frokiaer J, Pisitkun T, Knepper MA: Aquaporin-2 regulation in health and disease. Vet Clin Pathol 41: 455–470, 2012 - PMC - PubMed
    1. Olesen ET, Fenton RA: Is there a role for PGE2 in urinary concentration? J Am Soc Nephrol 24: 169–178, 2013 - PubMed

Publication types

MeSH terms

LinkOut - more resources