. 2015 Aug;32(8):2036-47.
doi: 10.1093/molbev/msv086. Epub 2015 Apr 7.

Inbreeding Affects Gene Expression Differently in Two Self-Incompatible Arabidopsis lyrata Populations with Similar Levels of Inbreeding Depression

Affiliations

Inbreeding Affects Gene Expression Differently in Two Self-Incompatible Arabidopsis lyrata Populations with Similar Levels of Inbreeding Depression

Mandy Menzel et al. Mol Biol Evol. 2015 Aug.

Abstract

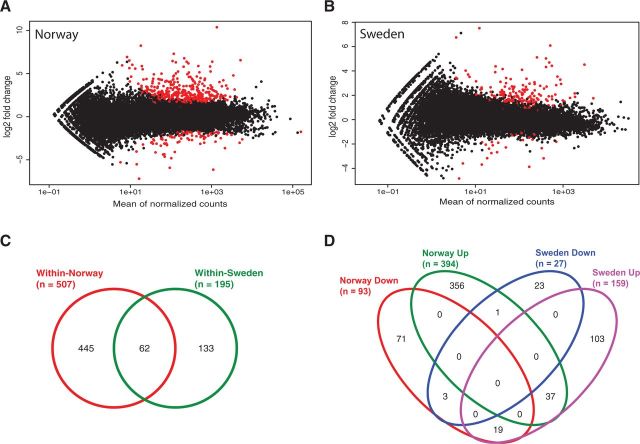
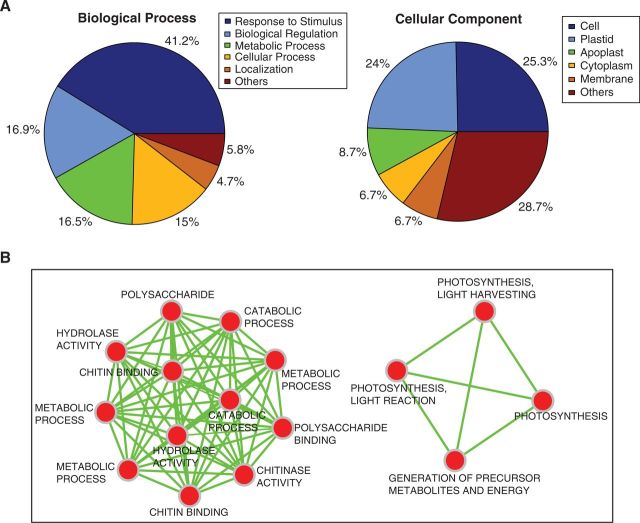
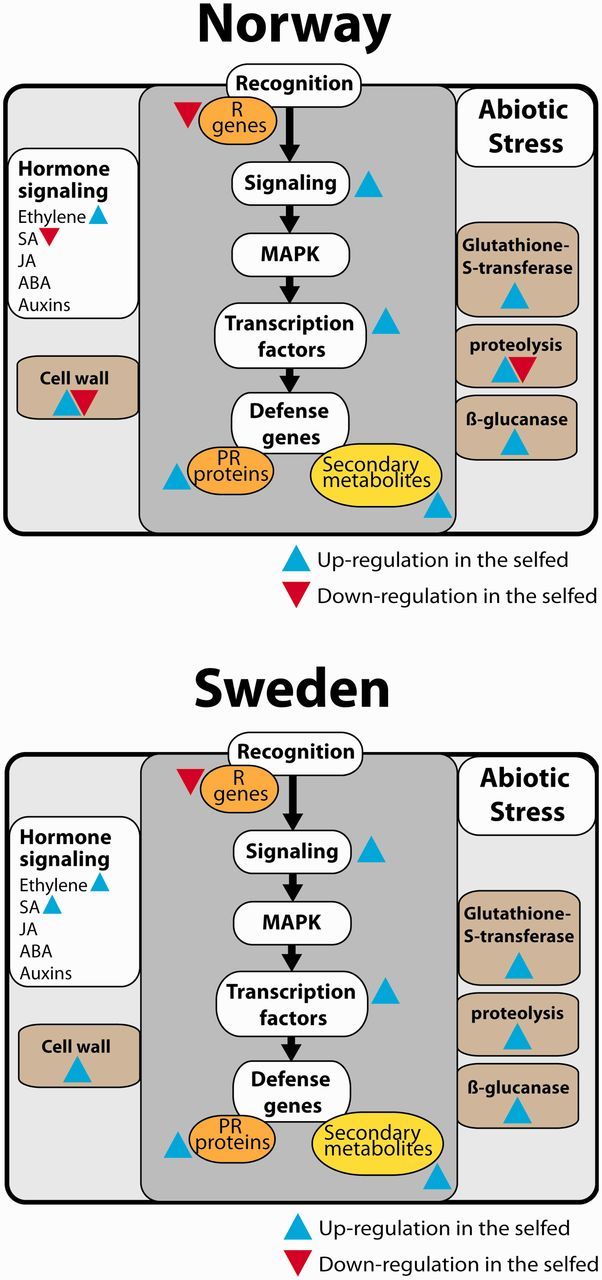
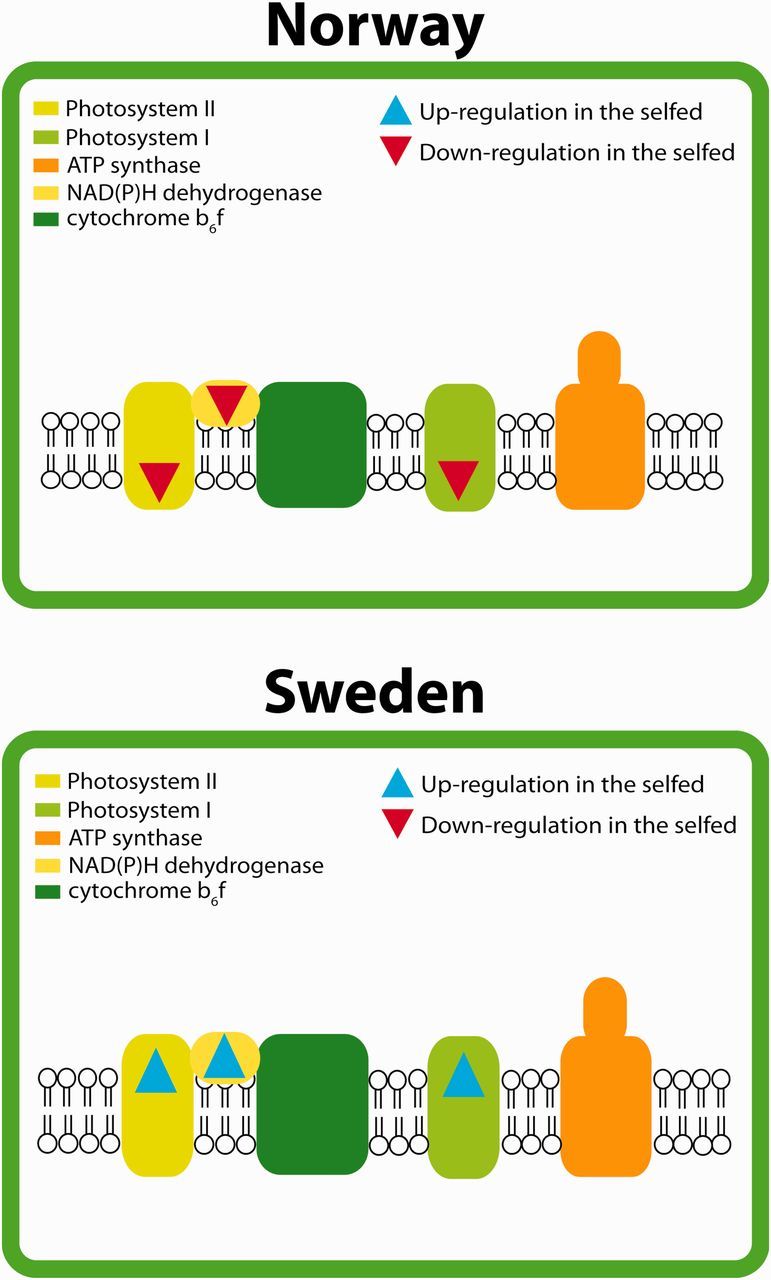
Knowledge of which genes and pathways are affected by inbreeding may help understanding the genetic basis of inbreeding depression, the potential for purging (selection against deleterious recessive alleles), and the transition from outcrossing to selfing. Arabidopsis lyrata is a predominantly self-incompatible perennial plant, closely related to the selfing model species A. thaliana. To examine how inbreeding affects gene expression, we compared the transcriptome of experimentally selfed and outcrossed A. lyrata originating from two Scandinavian populations that express similar inbreeding depression for fitness (∂ ≈ 0.80). The number of genes significantly differentially expressed between selfed and outcrossed individuals were 2.5 times higher in the Norwegian population (≈ 500 genes) than in the Swedish population (≈ 200 genes). In both populations, a majority of genes were upregulated on selfing (≈ 80%). Functional annotation analysis of the differentially expressed genes showed that selfed offspring were characterized by 1) upregulation of stress-related genes in both populations and 2) upregulation of photosynthesis-related genes in Sweden but downregulation in Norway. Moreover, we found that reproduction- and pollination-related genes were affected by inbreeding only in Norway. We conclude that inbreeding causes both general and population-specific effects. The observed common effects suggest that inbreeding generally upregulates rather than downregulates gene expression and affects genes associated with stress response and general metabolic activity. Population differences in the number of affected genes and in effects on the expression of photosynthesis-related genes show that the genetic basis of inbreeding depression can differ between populations with very similar levels of inbreeding depression.

Keywords: Arabidopsis lyrata; RNA-Seq; gene expression; inbreeding; stress-related genes.


Figures

F<sc>ig</sc>. 1.
Fig. 1.
Clustering of individuals based on count data. The two Arabidopsis lyrata populations Sweden and Norway with the treatments selfed and outcrossed were clustered by Euclidean distance in DESeq. Individuals from Norway are shown in gray and individuals from Sweden in black, with plant ID indicating the identity of the maternal parent and whether the plant was a selfed (S) or outcrossed (W) progeny.
F<sc>ig</sc>. 2.
Fig. 2.
Differential expression of selfed and outcrossed progeny and its overlap between the populations. Differential expression of genes was calculated using DESeq with an FDR and an adjusted P value of 0.05. (A) Scatter plot of log2 fold change versus mean of normalized counts for the comparison selfed versus outcrossed in Norway showing in red 507 significantly differentially expressed genes between the conditions. (B) Scatter plot for the comparison selfed versus outcrossed in Sweden, resulting in 195 significantly differentially expressed genes. The Venn diagrams represent the overlap of significantly differentially expressed genes between the two populations with focus on (C) the overlap of genes differentially expressed within Norway and within Sweden and (D) the overlap according to genes up- and downregulated in the selfed progeny of a given population.
F<sc>ig</sc>. 3.
Fig. 3.
Distribution of the differentially expressed genes in each population on the Arabidopsis lyrata genome. Genes that were significantly differentially expressed in Norway are shown in blue and those differentially expressed in Sweden are shown in orange. Their chromosomal locations were retrieved by BioMart and plotted in Circos. Numbers refer to the A. lyrata chromosome number.
F<sc>ig</sc>. 4.
Fig. 4.
GO annotation and enrichment analysis of the genes that were significantly differentially expressed in both populations. (A) Distribution of GO annotation for the candidates performed using BLAST2GO. Percentages indicate the percentage of candidate sequences assigned to each subcategory of either biological process or cellular component. (B) Enrichment map, built on GO annotation (Cytoscape plugins BiNGO and EnrichmentMap), providing insights into GO terms that are highly significant and their interactions.
F<sc>ig</sc>. 5.
Fig. 5.
Results from biotic stress pathway analyses in the (A) Norwegian and (B) Swedish population, respectively. The analyses were based on genes that were significantly differentially expressed in both populations. Assignment of the genes into pathways was achieved by ortholog Markov clustering against Arabidopsis thaliana and mapping of orthologs into pathways. Blue signifies a positive log2 fold change in the selfed compared with the outcrossed (upregulation), whereas red signifies a negative log2 fold change in the selfed compared with the outcrossed (downregulation).
F<sc>ig</sc>. 6.
Fig. 6.
Results from chloroplast pathway analyses in the (A) Norwegian and (B) Swedish population, respectively. The analyses were based on genes that were significantly differentially expressed in both populations. Assignment of genes into pathways was achieved by ortholog Markov clustering against Arabidopsis thaliana and mapping of orthologs into pathways. Blue signifies a positive log2 fold change in the selfed compared with the outcrossed (upregulation), whereas red signifies a negative log2 fold change in the selfed compared with the outcrossed (downregulation).

References

    1. Anders S, Huber W. Differential expression analysis for sequence count data. Genome Biol. 2010;11:R106. - PMC - PubMed
    1. Aranda B, Blankenburg H, Kerrien S, Brinkman FS, Ceol A, Chautard E, Dana JM, De Las Rivas J, Dumousseau M, Galeota E, et al. PSICQUIC and PSISCORE: accessing and scoring molecular interactions. Nat Methods. 2011;8:528–529. - PMC - PubMed
    1. Ayroles JF, Hughes KA, Rowe KC, Reedy MM, Rodriguez-Zas SL, Drnevich JM, Caceres CE, Paige KN. A genomewide assessment of inbreeding depression: gene number, function, and mode of action. Conserv Biol. 2009;23:920–930. - PubMed
    1. Bader GD, Betel D, Hogue CW. BIND: the Biomolecular Interaction Network Database. Nucleic Acids Res. 2003;31:248–250. - PMC - PubMed
    1. Barrett SCH, Charlesworth D. Effects of a change in the level of inbreeding on the genetic load. Nature. 1991;325:522–524. - PubMed

Publication types

LinkOut - more resources