

Frequency dependant topological alterations of intrinsic functional connectome in major depressive disorder
- PMID: 25856168
- PMCID: PMC5155486
- DOI: 10.1038/srep09710
Frequency dependant topological alterations of intrinsic functional connectome in major depressive disorder
Abstract
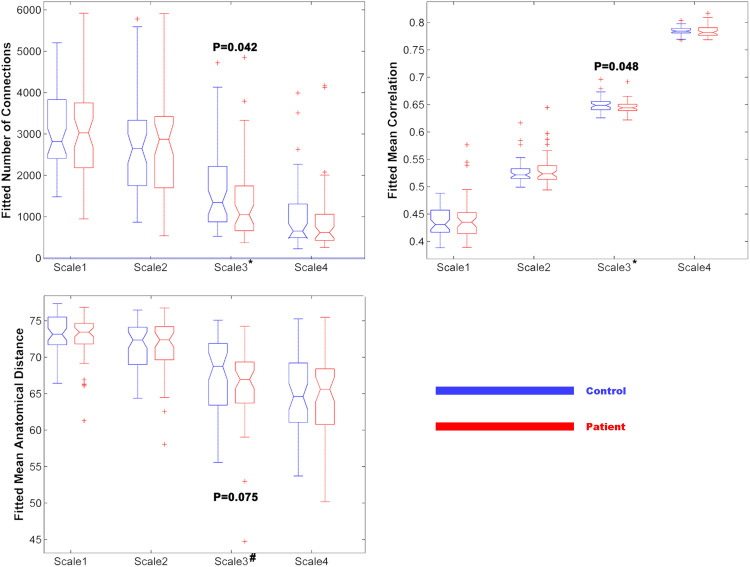
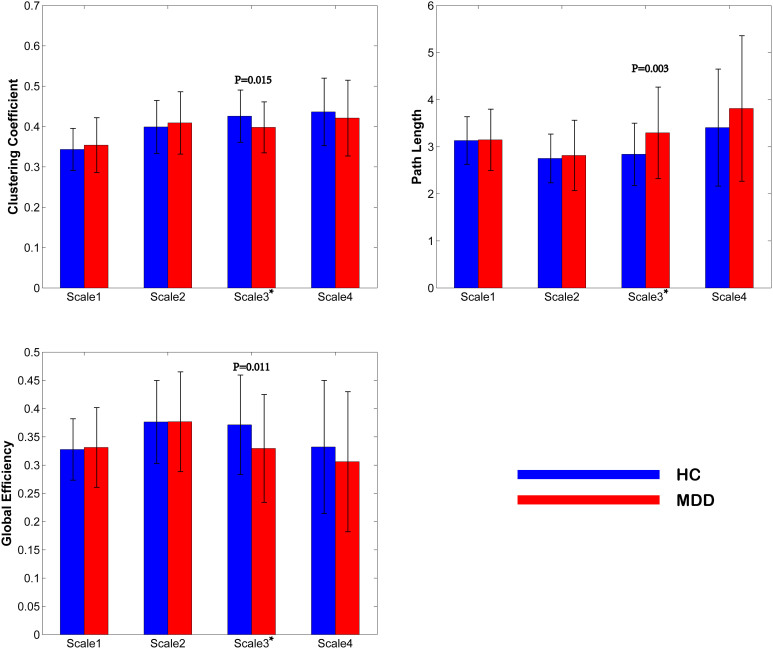
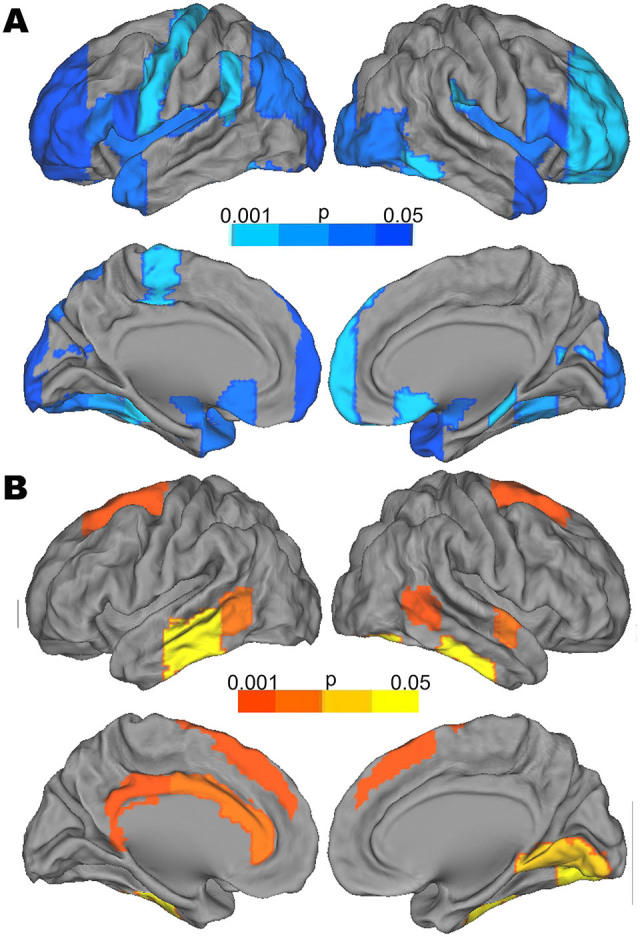
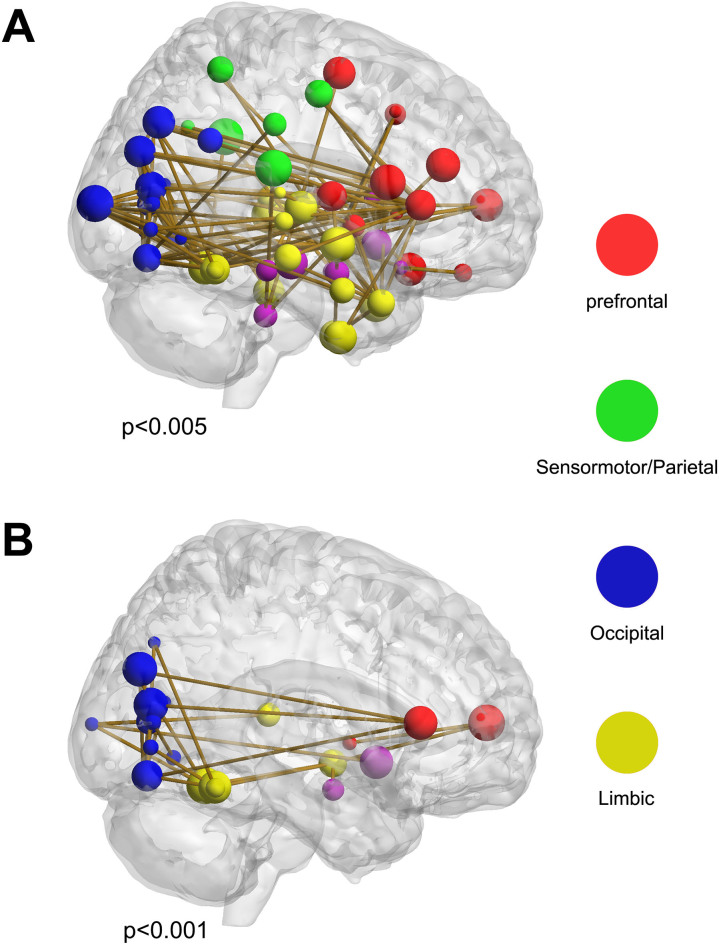
Major depressive disorder is associated with aberrant topological organizations of brain networks. However, whether this aberrance is shown in broader frequency bands or in a specific frequency band remains unknown. Fifty patients and fifty gender, age and education matched normal controls underwent resting state functional magnetic resonance imaging. Frequency dependent topological measures based on graph theory were calculated from wavelet decomposed resting state functional brain signals. In the specific frequency band of 0.03-0.06 Hz, the clustering coefficient and the global efficiency were reduced while the characteristic path length was increased. Furthermore, patients showed aberrant nodal centralities in the default mode network, executive network and occipital network. Network based statistical analysis revealed system-wise topological alterations in these networks. The finding provides the first systematic evidence that depression is associated with frequency specific global and local topological disruptions and highlights the importance of frequency information in investigating major depressive disorders.
Figures
References
-
- Kessler R. C. et al. The epidemiology of major depressive disorder. JAMA 289, 3095–3105 (2003). - PubMed
-
- Nestler E. J. et al. Neurobiology of depression. Neuron 34, 13–25 (2002). - PubMed
-
- Guilbert J. J. The world health report 2002 - reducing risks, promoting healthy life. Education for health (Abingdon, England) 16, 230 (2003). - PubMed
-
- Arnone D., McIntosh A. M., Ebmeier K. P., Munafò M. R. & Anderson I. M. Magnetic resonance imaging studies in unipolar depression: systematic review and meta-regression analyses. Eur. Neuropsychopharmacol. 22, 1–16 (2012). - PubMed
Publication types
MeSH terms
LinkOut - more resources
Full Text Sources
Other Literature Sources
Medical
