. 2015 Apr 9;10(4):e0119783.
doi: 10.1371/journal.pone.0119783. eCollection 2015.

MiRNA-615-5p functions as a tumor suppressor in pancreatic ductal adenocarcinoma by targeting AKT2

Affiliations

MiRNA-615-5p functions as a tumor suppressor in pancreatic ductal adenocarcinoma by targeting AKT2

Yang Sun et al. PLoS One. .

Erratum in

Abstract

Background: Aberrant microRNA (miRNA) expression is associated with tumor development. This study aimed to elucidate the role of miR-615-5p in the development of pancreatic ductal adenocarcinoma (PDAC).

Methods: Locked nucleic acid in situ hybridization (LNA-ISH) was performed to compare miR-615-5p expression in patients between PDAC and matched adjacent normal tissues. Effects of miR-615-5p overexpression on cell proliferation, apoptosis, colony formation, migration, and invasion were determined in the pancreatic cancer cell lines PANC-1 and MIA PaCa-2. Effects of miR-615-5p on AKT2 were examined by dual-luciferase reporter assay. Lentivirus expressing miR-615 was used to create stable overexpression cell lines, which were subsequently used in mouse xenograft and metastasis models to assess tumor growth, apoptosis and metastasis.

Results: miR-615-5p expression was significantly lower in PDAC than in adjacent normal tissues. Low levels of miR-615-5p were independently associated with poor prognosis (HR: 2.243, 95% CI: 1.190-4.227, P=0.013). AKT2 protein expression was inversely correlated with miR-615-5p expression (r=-0.3, P=0.003). miR-615-5p directly targeted the 3'-untranslated region of AKT2 mRNA and repressed its expression. miR-615-5p overexpression inhibited pancreatic cancer cell proliferation, migration, and invasion in vitro, and tumor growth and metastasis in vivo. Furthermore, miR-615-5p overexpression also induced pancreatic cancer cell apoptosis both in vitro and in vivo.

Conclusions: These results show that miR-615-5p inhibits pancreatic cancer cell proliferation, migration, and invasion by targeting AKT2. The data implicate miR-615-5p in the prognosis and treatment of PDAC.


Conflict of interest statement

Competing Interests: The authors have declared that no competing interests exist.

Figures

Fig 1
Fig 1. Locked nucleic acid in situ hybridization (LNA-ISH) shows differential expression of miR-615-5p in pancreatic ductal adenocarcinoma (PDAC) compared to normal pancreatic tissues. Bar = 100 μm.
(A) Strong positive (2+) staining of miR-615-5p in normal pancreas; note the dark acinar nuclear staining with cytoplasmic stippling. (B) Weak positive (+) staining of miR-615-5p in PDAC tissue. (C) Positive control staining for the U6 probe in PDAC tissue; note the dark nuclear staining observed in cancer cells. (D) Negative control for the scrambled probe in normal pancreatic tissue; no positive staining is observed.
Fig 2
Fig 2. Kaplan-Meier analysis demonstrates that PDAC patients with low-miR-615-5p expression have a lower overall survival than those with high expression of miR-615-5p (log-rank test, P<0.01).
Fig 3
Fig 3. MiR-615 overexpression inhibits tumor growth in vivo.
MIA PaCa-2 cells transduced with lentivirus pLV-miR-615 (LV-miR-615-MIA) or pLV-miR-mock (LV-control-MIA) (6 × 10⁶ cells) were subcutaneously inoculated into the dorsal flanks of BALB/c nude mice. (A) Relative miR-615-5p expression was determined by TaqMan microRNA qRT-PCR assay. (B) Tumor volume (cm3) was assessed by calipers every week. (C) Tumor weights (g) measured at the end of the experiment were significantly reduced in the LV-miR-615-5p-MIA group. (D) The extent of apoptosis was determined in tumor tissue by TUNEL staining (scale bar: 600um). (E) Determination of Ki-67 in tumor tissues by immunofluorescence (Magnification:×100). Red: Rhodamine; Blue: DAPI. The numbers of apoptotic cells (D) and the percentages of Ki-67-positive cells (E) were determined from 10 randomly selected fields in a single sample. Two independent reviewers were blinded to the grouping when measuring the numbers of apoptotic cells and the percentages of Ki-67-positive cells. The data are shown as mean±standard deviation (SD) (n = 8 in LV-control-MIA group; n = 6 in LV-miR-615-MIA group). *P<0.05, **P<0.01 vs. LV-control-MIA group.
Fig 4
Fig 4. MiR-615-5p overexpression inhibits tumor metastasis in vivo.
LV-miR-615-5p-MIA or LV-control-MIA cells were injected into nude mice via tail vein. Mouse livers were harvested to evaluate tumor metastasis 4 weeks after injection. (A) Mouse liver tissue (left panel) and representative tumor nodules (right panel, H&E staining) (Magnification: ×2.5, upper; ×10, lower). (B) The number of tumor nodules in the liver was quantified and is presented as mean±SD (n = 6 in LV-control-MIA group; n = 6 in LV-miR-615-5p-MIA group). **P<0.01 vs. LV-control-MIA group.
Fig 5
Fig 5. Effects of miR-615-5p overexpression on cell proliferation, colony formation, and apoptosis in pancreatic PANC-1 and MIA PaCa-2 cancer cell lines.
PANC-1 and MIA PaCa-2 cells were transiently transfected with the miR-615-5p miRNA mimic (miR-615-5p) or a control construct (NC). (A) Cell proliferation was measured by CCK-8 detection at 24, 48, 72, 96, and 120 hours after transfection both in MIA PaCa-2 and PANC-1 cells. (B) Cell proliferation was also determined by 5-ethynyl-2’-deoxyuridine (EdU) staining 48 hours after transfection (Scale bar: 200 μm). Red: EdU; Blue: DAPI. (C) Colony formation assay after 21 days in culture. (D) Cell apoptosis was determined by flow cytometry analysis using Annexin V/PI staining 48 hours after transfection. The data are shown as mean±SD. *P<0.05 vs. untreated cells or NC group.
Fig 6
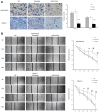
Fig 6. Effects of miR-615-5p overexpression on cell invasion and migration in pancreatic PANC-1 and MIA PaCa-2 cancer cell lines.
PANC-1 and MIA PaCa-2 cells were transiently transfected with the miR-615-5p miRNA mimic (miR-615-5p) or a control mimic (NC). (A) Cell invasion was determined by transwell chamber assay 48 hours after transfection; cells that successfully invaded through the chamber were stained with 0.1% crystal violet and counted. Staining is shown on the left (Magnification: ×100) and quantification on the right; (B) Cell migration was assessed by performing a wound-healing assay at 0, 12, 24, 36, 48, and 60h after transfection. Results are presented as rate of the wound area filled at a given time. The data are shown as mean±SD. *P<0.05 vs. untreated PANC-1 and MIA PaCa-2 cells, respectively; #P<0.05 vs. NC group. Representative images are shown on the left (Magnification: ×100), and quantification is provided on the right.
Fig 7
Fig 7. AKT2 is a direct target of miR-615-5p.
(A) Schematic representation of the firefly luciferase reporter construct containing the 3’-UTR of AKT2 with either wild-type (WT) or mutant (MUT) miR-615-5p target site. The mutant construct contains mutations in 6 nucleotides within the seed region of the target site to disrupt binding of miR-615-5p. PANC-1 (B) and MIA PaCa-2 (C) cells (0.5 × 10⁶ cells per well) were transiently co-transfected with reporter plasmids (200 ng, WT or MUT) and 100 nM of either miR-615-5p miRNA mimic (miR-615-5p) or control mimic (NC) for 24 h. Protein lysates were then prepared and relative luciferase activity was determined using the dual-luciferase assay system. Renilla luciferase was used for normalization of transfection efficiency. Data are represented as normalized fold change of luciferase activity. The data are shown as mean±SD. *P<0.05 vs. miR-615+AKT2WT. AKT2 protein expression in MIA PaCa-2 (D) and PANC-1 (E) cells transiently transfected with mir-615-5p miRNA mimic (miR-615-5p) or control mimic (NC) were determined by Western blot. (F) AKT2 protein expression in tumor tissues from nude mice stably overexpressing miR-615-5p was determined by Western blot. β-actin was used as a loading control. (G) Higher magnification after AKT2 detection in PDAC tissues by immunohistochemistry (IHC) (Magnification: ×200); negative, focally positive and diffusely positive cells can be observed. Two arrows point to two group of cancer cells, one with positive AKT2 expression (left) and the other AKT2 negative (right). (H) AKT2 expression is inversely correlated with miR-615-5p in PDAC tissues. AKT2 expression was determined by IHC (upper panel). miR-615-5p expression was determined by locked nucleic acid in situ hybridization (LNA-ISH) (lower panel). Magnification: ×200. Normal: normal pancreas; PC G1: well differentiated PDAC tissue; PC G3: poorly differentiated PDAC tissue. LNA-ISH and immunohistochemistry slides were counterstained with nuclear fast red and hematoxylin, respectively.

References

    1. National Comprehensive Cancer Network. NCCN Clinical Practice Guidelines in Oncology. Pancreatic Adenocarcinoma, v.1. Available: http://www.nccn.org/professionals/physician_gls/pdf/pancreatic.pdf. Accessed 2015 Feb 3.
    1. Stathis A and Moore MJ. Advanced pancreatic carcinoma: current treatment and future challenges. Nat Rev Clin Oncol. 2010;7: 163–172. 10.1038/nrclinonc.2009.236 - DOI - PubMed
    1. Fuchs CS, Colditz GA, Stampfer MJ, Giovannucci EL, Hunter DJ, Rimm EB, et al. A prospective study of cigarette smoking and the risk of pancreatic cancer. Arch Intern Med. 1996;156: 2255–2260. - PubMed
    1. Gapstur SM, Gann PH, Lowe W, Liu K, Colangelo L and Dyer A. Abnormal glucose metabolism and pancreatic cancer mortality. JAMA. 2000;283: 2552–2558. - PubMed
    1. Michaud DS, Giovannucci E, Willett WC, Colditz GA, Stampfer MJ and Fuchs CS. Physical activity, obesity, height, and the risk of pancreatic cancer. JAMA. 2001;286: 921–929. - PubMed

Publication types

MeSH terms