. 2015 Apr 9;10(4):e0123312.
doi: 10.1371/journal.pone.0123312. eCollection 2015.

In vitro microtumors provide a physiologically predictive tool for breast cancer therapeutic screening

Affiliations

In vitro microtumors provide a physiologically predictive tool for breast cancer therapeutic screening

Gabriel Benton et al. PLoS One. .

Abstract

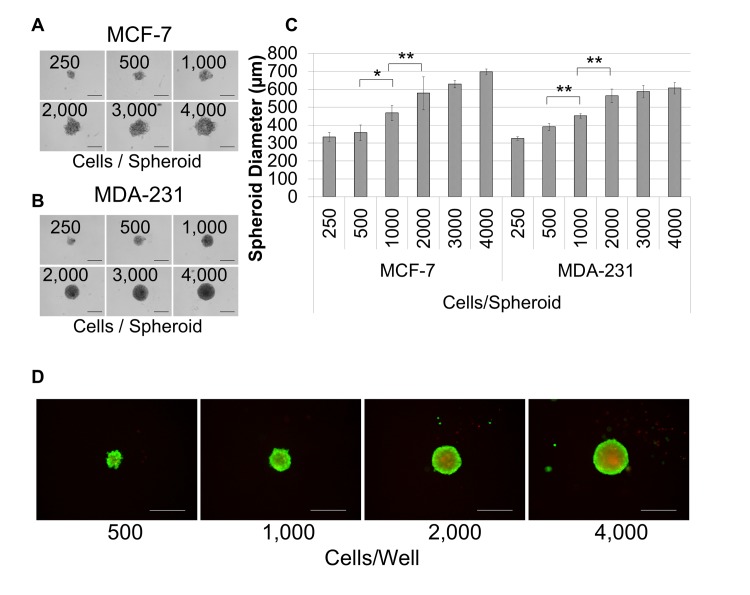
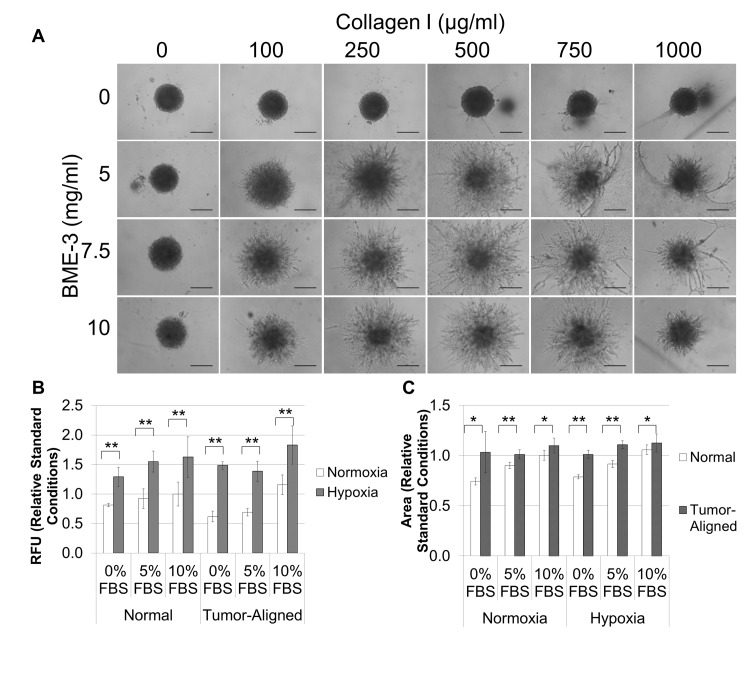
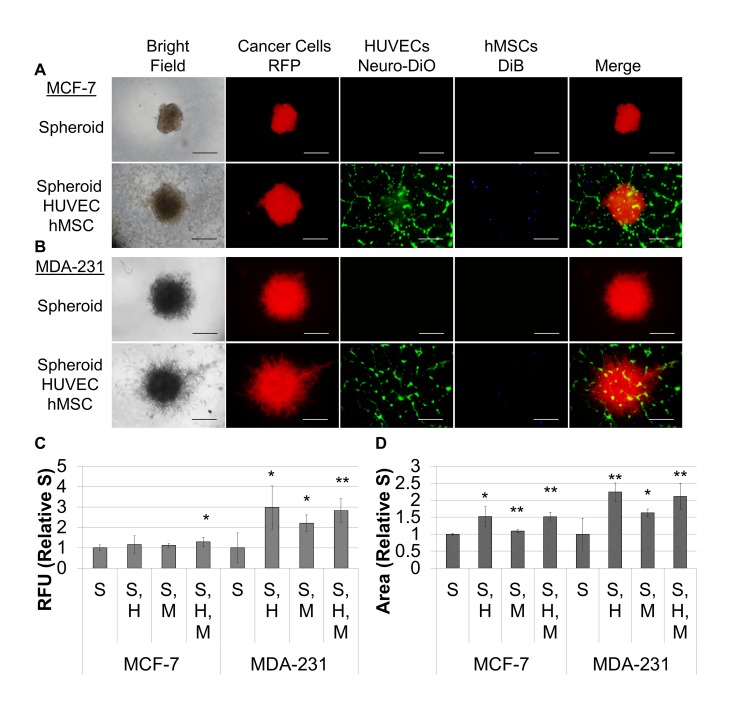
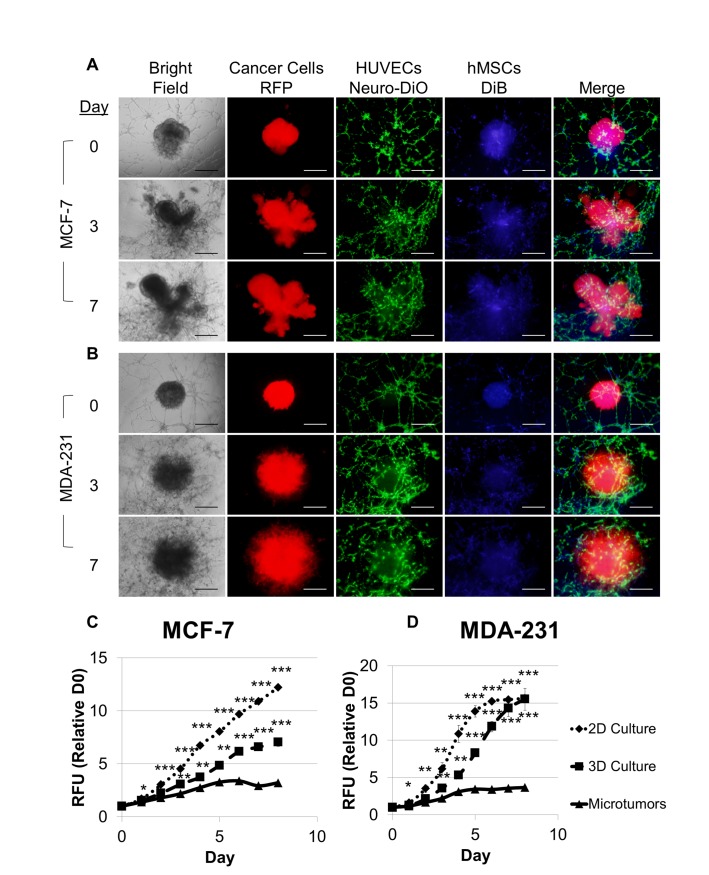
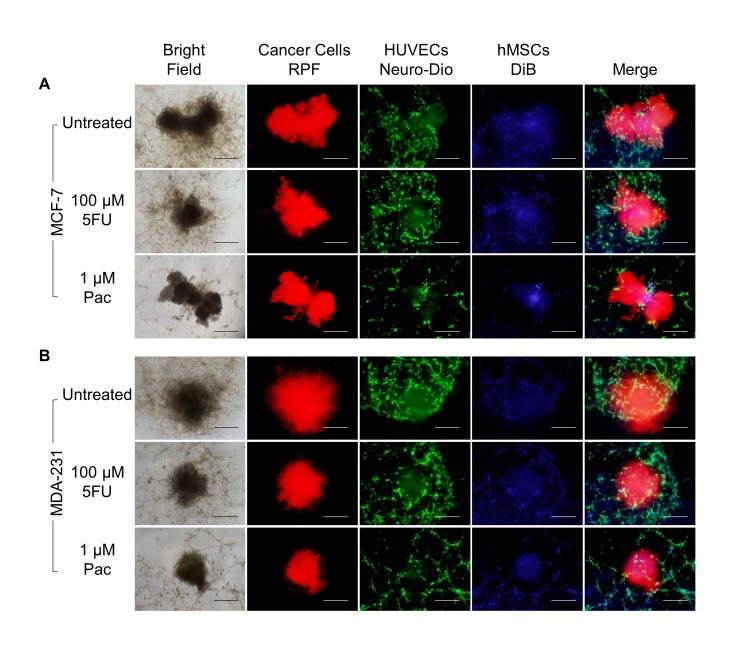
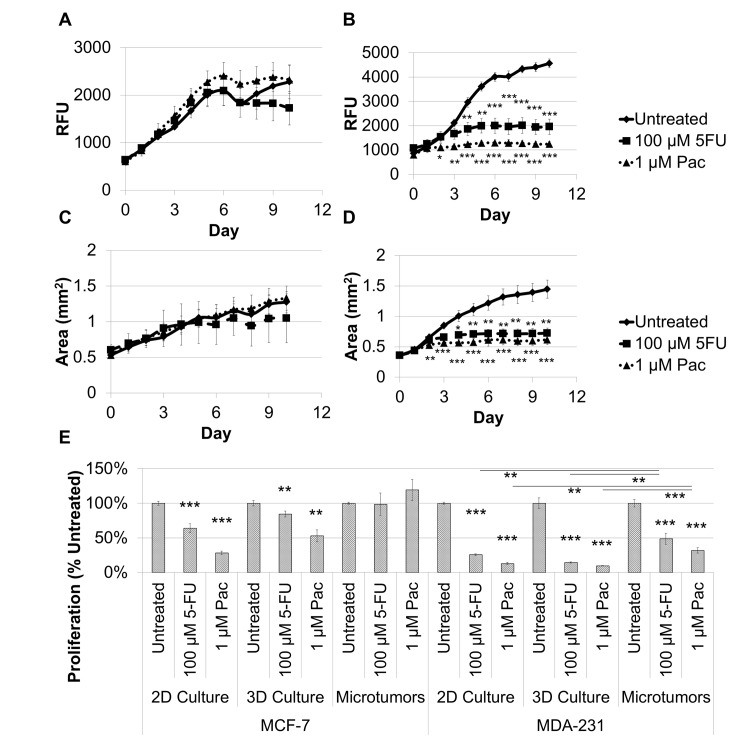
Many anti-cancer drugs fail in human trials despite showing efficacy in preclinical models. It is clear that the in vitro assays involving 2D monoculture do not reflect the complex extracellular matrix, chemical, and cellular microenvironment of the tumor tissue, and this may explain the failure of 2D models to predict clinical efficacy. We first optimized an in vitro microtumor model using a tumor-aligned ECM, a tumor-aligned medium, MCF-7 and MDA-MB-231 breast cancer spheroids, human umbilical vein endothelial cells, and human stromal cells to recapitulate the tissue architecture, chemical environment, and cellular organization of a growing and invading tumor. We assayed the microtumor for cell proliferation and invasion in a tumor-aligned extracellular matrix, exhibiting collagen deposition, acidity, glucose deprivation, and hypoxia. We found maximal proliferation and invasion when the multicellular spheroids were cultured in a tumor-aligned medium, having low pH and low glucose, with 10% fetal bovine serum under hypoxic conditions. In a 7-day assay, varying doses of fluorouracil or paclitaxel had differential effects on proliferation for MCF-7 and MDA-MB-231 tumor spheroids in microtumor compared to 2D and 3D monoculture. The microtumors exhibited a tumor morphology and drug response similar to published xenograft data, thus demonstrating a more physiologically predictive in vitro model.


Conflict of interest statement

Competing Interests: Hynda K. Kleinman is a consultant for Trevigen, Inc. This does not alter the authors' adherence to PLOS ONE policies on sharing data and materials.

Figures

Fig 1
Fig 1. The optimal breast cancer cell seeding density for spheroid formation is 2,000 cells/well.
Breast cancer cells were seeded at the concentrations (cells/well) shown in 96 well, ultra-low adhesion plates and incubated for 72 hours in 1X spheroid formation ECM for MCF-7 (A) and MDA-MB-231 (B) cells. C. The diameter of each spheroid was measured for quadruplicate samples and groups were compared for statistical significance using the student’s t-test for both cell lines. D. Non-fluorescent calcein am was converted to fluorescent calcein (green), indicating living cells, and ethidium bromide (red) was internalized by dead cells. The presence of live cells in the outer layers of the spheroid and dead cells in the spheroid core is indicative of physiological diffusion gradients. Scale bar = 500 μm. *P < 0.05, **P < 0.01.
Fig 2
Fig 2. The optimal Invasion Matrix is 10 mg/ml BME, 250 μg/ml collagen-1, and MDA-MB-231 spheroids exhibit maximum proliferation and invasion when cultured in a tumor-aligned medium with 10% FBS under hypoxia.
A. MDA-MB-231 spheroids formed from 2,000 cells/well were embedded in hydrogels composed of different mixtures of BME (0, 5, 7.5, and 10 mg/ml) and collagen (0, 100, 250, and 750 μg/ml collagen-1). After polymerization, 100 ul of RPMI, 10% FBS was added to each well to elicit an invasive response and determine optimal matrix composition for invasion of cells out of the spheroid and into the surrounding matrix. B and C. Spheroids were formed as described above. After 72 hours, 50 μl of Invasion matrix or tumor-aligned invasion matrix were added to each well, and the plates were incubated at for 1 hour to polymerize hydrogel. Then, an additional 100 μl of medium (normal or tumor-aligned, as indicated above) containing the amount of FBS indicated was added to each well, and plates were incubated in either a normal cell culture incubator or a hypoxia chamber, as indicated above. Plates were read in a 96 well plate reader at excitation 540 nm/ 587 nm emission to compare proliferation of breast cancer cells (B), and spheroids were photographed using the TRITC filter to compare invasion of breast cancer cells (C). Each condition was assessed in quadruplicate after 96 hours. Photographs were analyzed using ImageJ to determine structure size which reflected cell invasion. Scale bar = 500 μm. *P < 0.05, **P < 0.01.
Fig 3
Fig 3. hMSCs and endothelial tubules promote invasion and differentially effect proliferation of MDA-MB-231 and MCF-7 spheroids.
A. Spheroids formed as described above under hypoxia. Then 96 well, flat bottom plates were coated with 50 μl of tubule formation matrix and incubated for one hour to polymerize the hydrogel. For wells with HUVECs, 12,500 cells were added to each well, and for remaining samples, EGM-2 was added. HUVECs were allowed to assemble into tubules for two hours. One spheroid was transferred to each of the wells in the plate. MCTS were allowed to settle for 1 hour. Then, 100 μl of medium was aspirated from each well. For wells with hMSCs, 10,000 cells were suspended in each ml of Invasion Matrix, and 50 μl was added to each well. For the remaining samples, 50 μl of tumor-aligned invasion matrix was added to each well. The plates were then incubated at 37°C, 5% CO2 for 1 hour to polymerize the hydrogel, and 100 μl of TARPMI, 10% FBS was added to each well. Cultures were incubated under hypoxia for 96 hours. Images are provided for spheroids alone and for spheroids, HUVECs, and hMSCs for MCF-7 (A) and MDA-231 (B). Cultures were analyzed as described above for proliferation (C) and invasion (D), and samples were evaluated in quadruplicate. S = breast cancer MCTS, H = HUVEC network, and M = hMSCs. Scale bar = 500 μm. *P < 0.05, **P < 0.01.
Fig 4
Fig 4. Microtumors of MCTS, hMSC, and endothelial tubules produce a physiological breast cancer niche possessing tumor morphology, tumor invasion, and endothelial recruitment and exhibiting differential cell proliferation compared to 2D and 3D monocultures.
Microtumors were modified from Fig 3 such that hMSCs at 1,000 cells/well were added first to the HUVECs that had been incubated for 2 hours. After one hour of HUVEC/hMSC coculture, one MCF-7 spheroid (A) or MDA-MB-231 spheroid (B) containing 500 cells/well hMSCs was added to each well, embedded in TA Invasion Matrix, and overlaid with TARPMI, 10% FBS. A direct comparison of cell proliferation was made between microtumors, 2D monoculture, and 3D monoculture based on fluorescence intensity of the RPF-expressing MCF-7 (C) and MDA-MB-231 (D) cells over eight days in culture. Values were normalized to fluorescence intensity of the onset of assay for each cell line and culture condition, and samples were evaluated in quadruplicate. Scale bar = 500 μm. *P < 0.05, **P < 0.01, ***P < 0.001.
Fig 5
Fig 5. Fluorouracil and paclitaxel differentially affect the morphology of the structural elements of the breast cancer microtumors.
Microtumors were established and treated as described above under hypoxia and analyzed on day 7. A. MCF-7 cells exhibit a lobular morphology with fluorouracil or paclitaxel treatment with no apparent change in size. B. MDA-MB-231 cells exhibit an invasive morphology with a decrease in the number and extent of protrusions upon treatment with either fluorouracil or paclitaxel. For both microtumor models, endothelial recruitment is only inhibited in the presence of paclitaxel. Samples were evaluated in quadruplicate. Scale bar = 500 μm. *P < 0.05, **P < 0.01.
Fig 6
Fig 6. Microtumors exhibit physiological responses to paclitaxel or fluorouracil treatment, and microtumors exhibit a decrease in breast cancer cell proliferation compared to 2D and 3D monocultures for MCF-7 and MDA-MB-231 cells after 7 days of treatment.
Microtumor growth and response to 100 μM fluorouracil or 1 μM paclitaxel were determined based on fluorescence intensity of the RPF-expressing MCF-7 (A) and MDA-MB-231 (B) cells over ten days. A similar response was observed for the increase in microtumor area as an indicator of spread or invasion for these treatments for the MCF-7 (C) and MDA-MB-231 (D) microtumors. E. A direct comparison was made between 2D culture, 3D culture, and microtumors on day 7 for MCF-7 and MDA-MB-231 in the presence of fluorouracil or paclitaxel. Fluorouracil and paclitaxel inhibit breast cancer cell proliferation and spread for MDA-MB-231 microtumors, but not for MCF-7 microtumors. In addition, 2D and 3D monocultures were hypersensitive to fluorouracil or paclitaxel treatment compared to microtumor for both cell lines. Samples were evaluated in quadruplicate. *P < 0.05, **P < 0.01, ***P < 0.001.

References

    1. Herper M. The Cost Of Creating A New Drug Now $5 Billion, Pushing Big Pharma To Change. Forbes. [Magazine]. 2013 8/11/2013(http://www.forbes.com/sites/matthewherper/2013/08/11/how-the-staggering-...).
    1. Benton G, George J, Kleinman HK, Arnaoutova IP. Advancing science and technology via 3D culture on basement membrane matrix. Journal of Cellular Physiology. 2009;221(1):18–25. 10.1002/jcp.21832 - DOI - PubMed
    1. Kenny PA, Lee GY, Myers CA, Neve RM, Semeiks JR, Spellman PT, et al. The morphologies of breast cancer cell lines in three-dimensional assays correlate with their profiles of gene expression. Mol Oncol. 2007. June;1(1):84–96. 10.1016/j.molonc.2007.02.004 - DOI - PMC - PubMed
    1. Benton G, Crooke E, George J. Laminin-1 induces E-cadherin expression in 3-dimensional cultured breast cancer cells by inhibiting DNA methyltransferase 1 and reversing promoter methylation status. FASEB J. 2009 November 1, 2009;23(11):3884–95. 10.1096/fj.08-128702 - DOI - PubMed
    1. Lam CR, Wong HK, Nai S, Chua CK, Tan NS, Tan LP. A 3D Biomimetic Model of Tissue Stiffness Interface for Cancer Drug Testing. Mol Pharm. 2014. Jul 7;11(7):2016–21. 10.1021/mp500059q - DOI - PubMed

Publication types

MeSH terms