. 2015 Oct;63(10):1694-713.
doi: 10.1002/glia.22835. Epub 2015 Apr 9.

Transient activation of microglia following acute alcohol exposure in developing mouse neocortex is primarily driven by BAX-dependent neurodegeneration

Affiliations

Transient activation of microglia following acute alcohol exposure in developing mouse neocortex is primarily driven by BAX-dependent neurodegeneration

Katelin E Ahlers et al. Glia. 2015 Oct.

Abstract

Fetal alcohol exposure is the most common known cause of preventable mental retardation, yet we know little about how microglia respond to, or are affected by, alcohol in the developing brain in vivo. Using an acute (single day) model of moderate (3 g/kg) to severe (5 g/kg) alcohol exposure in postnatal day (P) 7 or P8 mice, we found that alcohol-induced neuroapoptosis in the neocortex is closely correlated in space and time with the appearance of activated microglia near dead cells. The timing and molecular pattern of microglial activation varied with the level of cell death. Although microglia rapidly mobilized to contact and engulf late-stage apoptotic neurons, apoptotic bodies temporarily accumulated in neocortex, suggesting that in severe cases of alcohol toxicity the neurodegeneration rate exceeds the clearance capacity of endogenous microglia. Nevertheless, most dead cells were cleared and microglia began to deactivate within 1-2 days of the initial insult. Coincident with microglial activation and deactivation, there was a transient increase in expression of pro-inflammatory factors, TNFα and IL-1β, after severe (5 g/kg) but not moderate (3 g/kg) EtOH levels. Alcohol-induced microglial activation and pro-inflammatory factor expression were largely abolished in BAX null mice lacking neuroapoptosis, indicating that microglial activation is primarily triggered by apoptosis rather than the alcohol. Therefore, acute alcohol exposure in the developing neocortex causes transient microglial activation and mobilization, promoting clearance of dead cells and tissue recovery. Moreover, cortical microglia show a remarkable capacity to rapidly deactivate following even severe neurodegenerative insults in the developing brain.

Keywords: apoptosis; development; fetal alcohol spectrum disorders; phagocytosis.


Figures

Figure 1
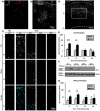
Figure 1. Acute 3 g/kg ethanol exposure in neonatal mice induces cortical apoptotic cell death
P7 mice were injected with PBS (A) or EtOH (B) and sacrificed 6 h later. Low magnification images show the distribution of anti-CC3 labeled cells in hemisections of the cerebrum at the level of the somatosensory cortex. At this magnification, few CC3+ cells are evident in PBS-injected controls (A), although many CC3+ cells are observed in cortical layers II and IV following EtOH-exposure (B). Images are Z-projections of confocal image stacks spanning 150 μm. D = dorsal; L = lateral. Red boxes in A and B indicate regions of the cortex shown in C. The blue box in B indicates the region of the cortex shown in D. (C) Higher magnification images showing apoptotic cells in layers II-IV of the cortex in animals injected with PBS and sacrificed 6 h later or injected with 3 g/kg EtOH and sacrificed 6, 12, 24, or 48 h later. Cells in early stages of apoptosis are labeled by anti-CC3 antibody (Top Row). Cells in later stages of apoptosis are labeled with PS-binding dye, PSVue (Middle Row). Overlay of CC3 (cyan) and PSVue (red) (Bottom Row). In PBS-injected controls, there is a low level of apoptotic cell death, which is concentrated in cortical layers II and IV. In EtOH-injected mice, there is an increase in both early (CC3+) and later-stage (PSVue+) apoptotic cells by 6 h (C, EtOH). Images are Z projections of confocal image stacks spanning 54 μm. (D) Boxed region shows the area in which CC3 and PSVue particle analyses were performed (E and G). (E) Particle analysis of CC3+ structures in cortical layer IV. Error bars represent SDP (N=4-6 cortical slices). * = 0.009, **p = 0.00009,. F) Western blot of CC3 protein in whole cortex following PBS (--) or EtOH (+) injection. β-tubulin was the internal loading control. Timeline of caspase-3 activation in whole cortex is in agreement with the immunohistochemical results shown in C. (G) Particle analysis of PSVue+ structures in cortical layer IV. Same tissue areas used for analysis as in (E). * < 0.05.
Figure 2
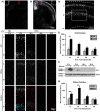
Figure 2. Acute 5 g/kg ethanol exposure in neonatal mice induces higher levels of cortical apoptotic cell death over a longer period of time
P7 mice were injected with PBS (A) or EtOH (B) and sacrificed 12 h later (A-B). Low magnification images show the distribution of anti-CC3 labeled cells in hemisections of thecerebrum at the level of the somatosensory cortex. At this magnification, few CC3+ cells are evident in PBS-injected controls (A), whereas many CC3+ cells are observed in cortical layers II and IV following EtOH-exposure (B). Images are Z projections of confocal image stacks spanning 150 μm. D = dorsal; L = lateral. Red boxes in A and B indicate regions of the cortex shown in C. The Blue box in B indicates the region of the cortex shown in D. (C) Higher magnification images showing apoptotic cells in layers II-IV of the cortex in animals injected with PBS and sacrificed 12 h later or injected with 5 g/kg EtOH and sacrificed 12, 24, 48, or 96 h (4 d) later. Cells in early stages of apoptosis are labeled by anti-cleaved caspase-3 (CC3) antibody (Top Row). Cells in later stages of apoptosis are labeled with a PS-binding dye, PSVue (Middle Row). Overlay of CC3 (cyan) and PSVue (red) (Bottom Row). In PBS-injected controls, there is a low level of apoptotic cell death, which is concentrated in cortical layers II and IV. In EtOH-injected mice, there is an increase in both early (CC3+) and later-stage (PSVue+) apoptotic cells by 12 h. Later stage (PSVue+) apoptotic cells continue to increase at 24 h, but few apoptotic cells are evident by 48 h and after (C, EtOH). Images are Z projections of confocal image stacks spanning 54 μm. (D) The boxed region shows the area in which CC3 and PSVue particle analyses were performed (E and G). (E) Particle analysis of CC3+ structures in cortical layer IV. Error bars represent SDP (N=4-6 cortical slices). *p = 0.0004. F) Western blot of CC3 protein in whole cortex following PBS (--) or EtOH (+) injection. β-tubulin was the internal loading control. Timeline of caspase activation in whole cortex is in agreement with the immunohistochemical results shown in C. (G) Particle analysis of PSVue+ structures in cortical layer IV. Same tissues used for analysis as in (E). *p = 0.05, **p = 0.009.
Figure 3
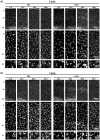
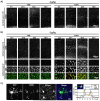
Figure 3. Acute ethanol exposure induces transient changes in the morphology and distribution of cortical microglia
Images show GFP-expressing microglia in somatosensory cortex of CX3CR1GFP/+ mice following injection of PBS (Left) or EtOH (Right). Note differences in time-points in A and B. (A, 3 g/kg, Top and Middle Rows) Microglial density appears to increase from 6 to 48 h in control mice. Despite this increase in density, microglia maintain an even distribution across the cortical layers, although there are many activated microglia in the corpus callosum (CC, PBS). In contrast, following EtOH-injection, microglial density appears to increase in cortical layers II and IV from 6 to 24 h while microglial density appeared to decrease in the adjacent layers. Microglia redistribute after 24 h (EtOH). (Bottom Row) High magnification images in cortical layer IV demonstrate that microglia remain ramified following a control, PBS injection. However, over the first 24 h following EtOH injection, microglia assume a more amoeboid form. Microglial re-ramification occurs after 24 h. Images are Z projections of confocal image stacks spanning 145 μm (Top Row) and 68 μm (Middle and Bottom Rows). (B, 5 g/kg) Microglial changes are similar to what was seen following 3 g/kg EtOH, with the exceptions that: 1) Microglial density in cortical layers II and IV is increased for a prolonged period of time (12-48 h, Top and Middle Rows) and 2) Microglia morphological changes are more pronounced and are present from 12-48 h. Re-ramification occurs from 48-96 h following 5 g/kg EtOH exposure (Bottom Row).
Figure 4
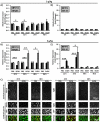
Figure 4. Acute ethanol exposure induces transient changes in molecular indicators of microglial activation
(A) RT-qPCR analysis of the normalized expression of molecular indicators of microglial activation in whole cortical tissues derived from 3 g/kg PBS- or EtOH-injected mice. Cortical expression of P2Y12 is decreased significantly at 12 h, but returned to control levels by 24 h. In contrast, Itgβ2 expression decreased significantly by 6 h and began to return to control levels by 12 h. (B) RT-qPCR analysis following 5 g/kg PBS- or EtOH injection. P2Y12 expression is decreased significantly at 12 and 24 h, but returned to control levels at 48 h. Itgβ2 expression was significantly increased at 24 and 48 h and returned to control levels by 96 h. These changes are consistent with transient microglial activation. (C) Low magnification images (Top Row) of the full depth of the neocortex stained for two microglial proteins, P2Y12 (Left) and Itgβ2 (Right). P2Y12 protein is decreased at 24 and 48 h following 5 g/kg EtOH-injection relative to PBS-injected controls. In contrast, Itgβ2 expression is increased at 24 and 48 h following 5 g/kg EtOH-injection relative to PBS-injected controls. Higher magnification images (Bottom Rows) of cortical layer IV demonstrate that P2Y12 and Itgβ2 expression is localized to GFP+ microglia. Images are Z-projections of confocal image stacks spanning 145 μm (Top Row) and 68 μm (Bottom Rows). (D) RT-qPCR analysis of the normalized expression of PIFs, TNFα and IL-1β, in whole cortical tissues derived from 3g/kg PBS- or EtOH-injected mice [same animals that were used for (A)]. There were no significant changes in expression of either TNFα or IL-1β following 3g/kg EtOH. (E) RT-qPCR analysis of the normalized expression of TNFα and IL-1β in whole cortical tissues derived from mice injected with 5 g/kg PBS- or EtOH [same animals that were used for (B)]. Cortical expression of TNFα and IL-1β increased significantly during the first 24 h following EtOH and then returned to control levels by 48 h post-EtOH. Error bars represent SEM *p ≤ 0.05, **p ≤ 0.01, ***p ≤ 0.005. (N=5-8 mice per condition).
Figure 5
Figure 5. Acute ethanol exposure induces a transient increase in microglial lysosomal protein, macrosialin/CD68, indicative of phagocytic activity
(A, 3 g/kg) In PBS controls there is a low basal level of CD68 IR in cortical layers I to VI, presumably in response to a persistent level of developmental apoptosis. After EtOH-injection, CD68 IR increased especially in cortical layers II and IV from 6 to 24 h, but returned to levels comparable to PBS control by 48 h after injection. (B, 5 g/kg) CD68 IR is similar to what is seen following 3 g/kg EtOH, except that there is a more pronounced up-regulation of CD68 in layer IV, and CD68 down-regulation does not occur until after 48 h. (Bottom Rows) High magnification images of cortical layer IV demonstrate that strong CD68 immunostaining localizes to activated microglia. Images are Z-projections of confocal image stacks spanning 150 μm (Cortical Layers I-VI) and 72 μm (Cortical Layer IV). (C) Higher resolution, multi-channel confocal imaging demonstrates that CD68 is not strictly colocalized with PSVue+ structures in phagosomes. Although it is often located near microglial phagocytic profiles (solid arrows and plot profile to right), it is also found in smaller structures, likely lysosomes, in microglial branches (open arrows).
Figure 6
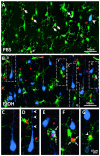
Figure 6. Microglia contact and phagocytose later stage apoptotic cells during normal development and following neonatal ethanol exposure
High magnification images of apoptotic cells (Blue and Red) and microglia (Green) in cortical layer IV, 4 h after injection of PBS (A) or 5 g/kg EtOH (B). All images are Z-projections of confocal image stacks spanning 67 μm. (A) Under control conditions, microglia rarely contacted CC3+ cells (Blue; Arrowhead) but often contacted or engulfed PSVue+ structures (Red; Arrows). (B) Similar contacts are seen following EtOH injection, with the exceptions that there is a significantly higher density of CC3+ and PSVue+ structures, and many more PSVue+ structures are not contacted by or contained within microglia. (C-G) Images from B arranged to indicate a possible sequence of apoptotic cell progression from early (C) to late (G) stages of apoptosis, based on size, morphology, and intensity of stained particles. (C) Intact-looking early apoptotic pyramidal neurons with smoothly tapering apical dendrites stain intensely for CC3. (D) CC3-stained neurons begin to bleb and fragment (arrowheads) as the apoptotic cascade continues. (E) PSVue staining begins to appear along with CC3 and intensifies as CC3 diminishes. Microglia first contact dying cells at this stage (arrows). (F) Compact, intense PSVue+ profiles are surrounded by microglial processes (arrows). (G) PSVue structures are then completely engulfed by microglia and are evident within microglial cell bodies (arrowhead).
Figure 7
Figure 7. Microglial activation induced by acute ethanol exposure in situ is abrogated by BAX KO
All data in this figure were collected at 24 h after PBS or 5 g/kg EtOH injection. (A) Images of cortical layers II-IV show that while EtOH injection of WT mice results in a substantial increase in apoptotic cell death relative to PBS injected controls, EtOH-induced cell death is eliminated in BAX KO animals. Images are Z-projections of confocal image stacks spanning 74 μm. (B) Microglia in GFP-reporter:BAX WT mice respond to EtOH-induced cell death by redistributing to cortical layers II and IV (Top Row, Low Mag) and assuming an amoeboid form (Bottom Row, Higher Mag). In contrast, microglia in BAX KO mice are more evenly distributed and maintain a ramified morphology in the presence or absence of EtOH. Images are Z-projections of confocal image stacks spanning 180 μm (Top Row) and 74 μm (Bottom Row). (C) RT-qPCR analyses of P2Y12 and Itgβ2 mRNA in whole cortex of BAX WT animals show a molecular profile of microglial activation in response to EtOH (cf. Fig. 4B). In contrast, in BAX KO’s, P2Y12 and Itgβ2 are expressed at similar levels in the presence or absence of EtOH. Error bars represent SEM. (N = 6-8 mice per condition). *p = 0.006 and **p = 0.0001. (D) EtOH-induced increase in CD68 IR is abrogated in BAX KO mice. (E) RT-qPCR analyses of mRNA in whole cortex shows that the EtOH-induced increase in TNFα and IL-1β is largely abrogated in BAX KO mice, although a minor but statistically significant increase is observed for IL-1β. (N = 6 mice per condition). *p = 0.02, **p = 0.01, *** p = 0.0002.
Figure 8
Figure 8. Graphical summary showing the relative timing of neuronal injury, microglial activation/deactivation, clearance of dead cells, and inflammatory factor expression following acute developmental alcohol exposure in situ
(Neurons) Exposure to 3 or 5g/kg EtOH on P7 results in significant cortical neuronal loss. As neurons begin to die, they initially activate caspase 3 (blue cells), but as cell death progresses PSVue labeling becomes more prevalent [cells transition from purple (CC3 + PSVue) to red (PSVue only)]. As these molecular transitions underlying cell death occur, the neurons condense into increasingly more compact structures. (Cell Death Profile) Time-line for the appearance of CC3 and PSVue, indicators of early and later stages of apoptosis, respectively. Note, the level of cell death scales with the BAC (Dashed Lines – 3 g/kg EtOH, Solid Lines – 5 g/kg EtOH). (Microglia, Activation) Analysis of BAX KO mice indicates that acute EtOH exposure has little direct effect on microglial activation in neonatal mice in situ (dashed arrow). However, in direct response to the EtOH-induced apoptotic cell death (solid arrows), microglia undergo morphological (Change in Cell Shape) and molecular (red hue) changes associated with activation (Microglial Activation Expression Profile) that scale with the insult. Activated microglia up-regulate the expression of a lysosomal protein, CD68, and begin to phagocytose PSVue+ dead cells. Phagocytic clearance is depicted as microglia processes physically surrounding PSVue+ cells (red), and in the cell’s subsequent removal from the tissue. (Microglia, Deactivation) Once apoptotic cells are removed from the cortex, microglia deactivate. During this time, microglia re-ramify, down-regulate CD68, and other molecular correlates of activation return to baseline. (Inflammation Expression Profile) Expression of PIFs TNFα and IL-1β increase coincident with microglial activation following 5 g/kg alcohol exposure and quickly return to baseline as dead cells are cleared and microglia deactivate.

References

    1. Adayev T, Estephan R, Meserole S, Mazza B, Yurkow EJ, Banerjee P. Externalization of phosphatidylserine may not be an early signal of apoptosis in neuronal cells, but only the phosphatidylserine-displaying apoptotic cells are phagocytosed by microglia. J. Neurochem. 1998;71:1854–1864. - PubMed
    1. Aguzzi A, Barres BA, Bennett ML. Microglia: scapegoat, saboteur, or something else? Science. 2013;339:156–161. - PMC - PubMed
    1. Alfonso-Loeches S, Pascual-Lucas M, Blanco AM, Sanchez-Vera I, Guerri C. Pivotal role of TLR4 receptors in alcohol-induced neuroinflammation and brain damage. J. Neurosci. 2010;30:8285–8295. - PMC - PubMed
    1. Aroor AR, Baker RC. Ethanol inhibition of phagocytosis and superoxide anion production by microglia. Alcohol. 1998;15:277–280. - PubMed
    1. Bittigau P, Sifringer M, Genz K, Reith E, Pospischil D, Govindarajalu S, Dzietko M, Pesditschek S, Mai I, Dikranian K, Olney JW, Ikonomidou C. Antiepileptic drugs and apoptotic neurodegeneration in the developing brain. Proc. Natl. Acad. Sci. U. S. A. 2002;99:15089–15094. - PMC - PubMed

Publication types

MeSH terms