. 2015 Jul;172(14):3687-701.
doi: 10.1111/bph.13157. Epub 2015 May 15.

α1 -Adrenoceptor activation of PKC-ε causes heterologous desensitization of thromboxane receptors in the aorta of spontaneously hypertensive rats

Affiliations

α1 -Adrenoceptor activation of PKC-ε causes heterologous desensitization of thromboxane receptors in the aorta of spontaneously hypertensive rats

Yingzi Zhao et al. Br J Pharmacol. 2015 Jul.

Abstract

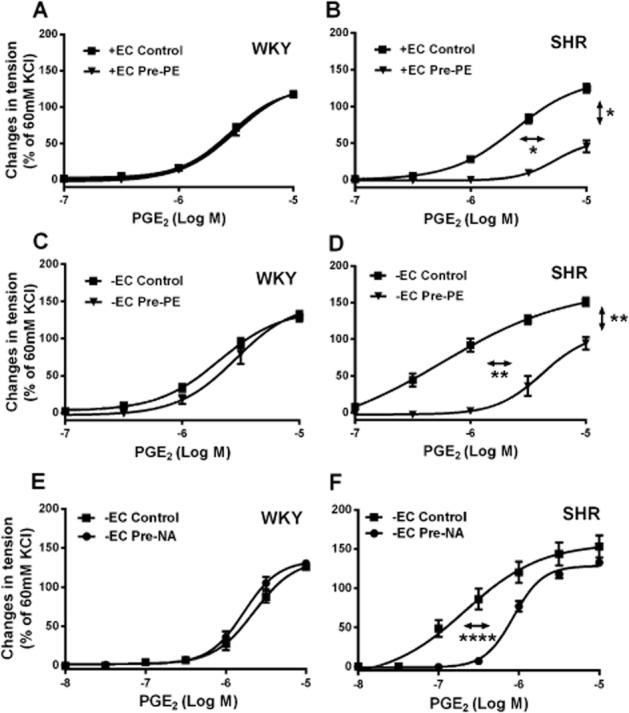
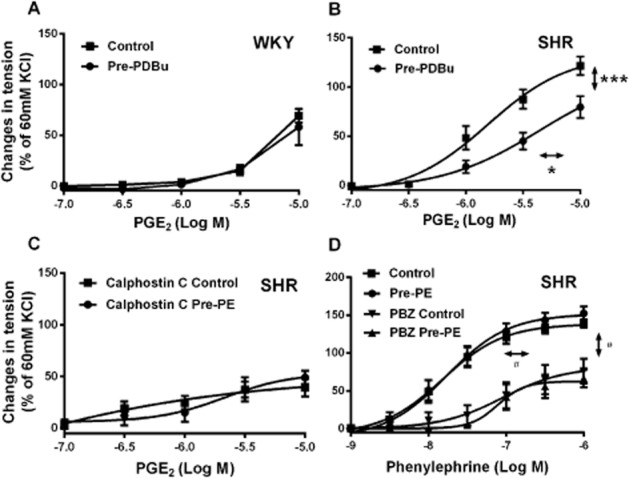
Background and purpose: In the aorta of adult spontaneously hypertensive (SHR), but not in that of normotensive Wistar-Kyoto (WKY), rats, previous exposure to phenylephrine inhibits subsequent contractions to PGE2 . The present experiments were designed to examine the mechanism(s) underlying this inhibition.

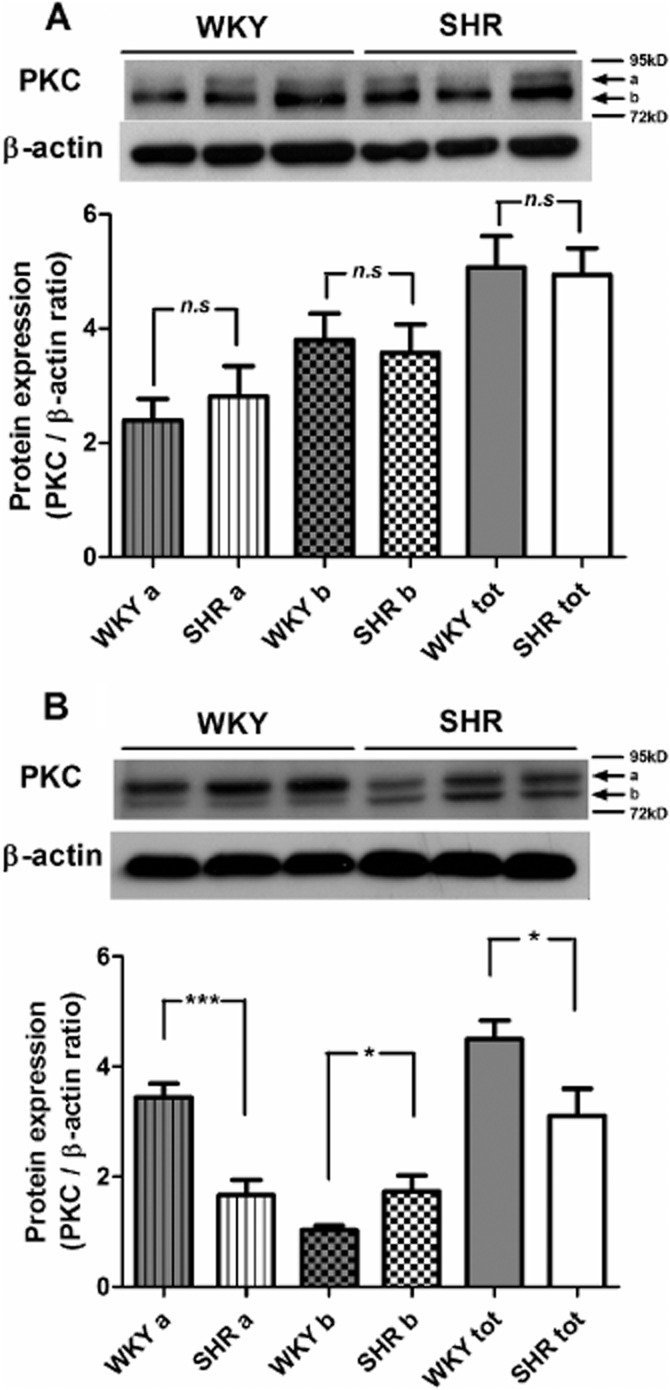
Experimental approach: Isometric tension was measured in isolated rings of SHR and WKY aortae. Gene expression and protein presence were measured by quantitative real-time PCR and Western blotting respectively.

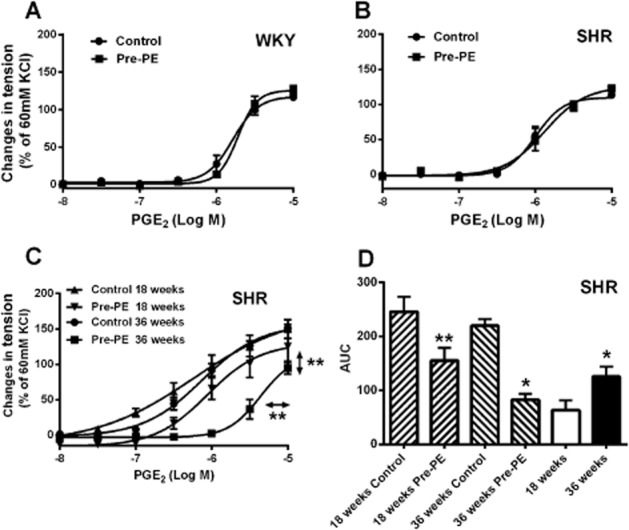
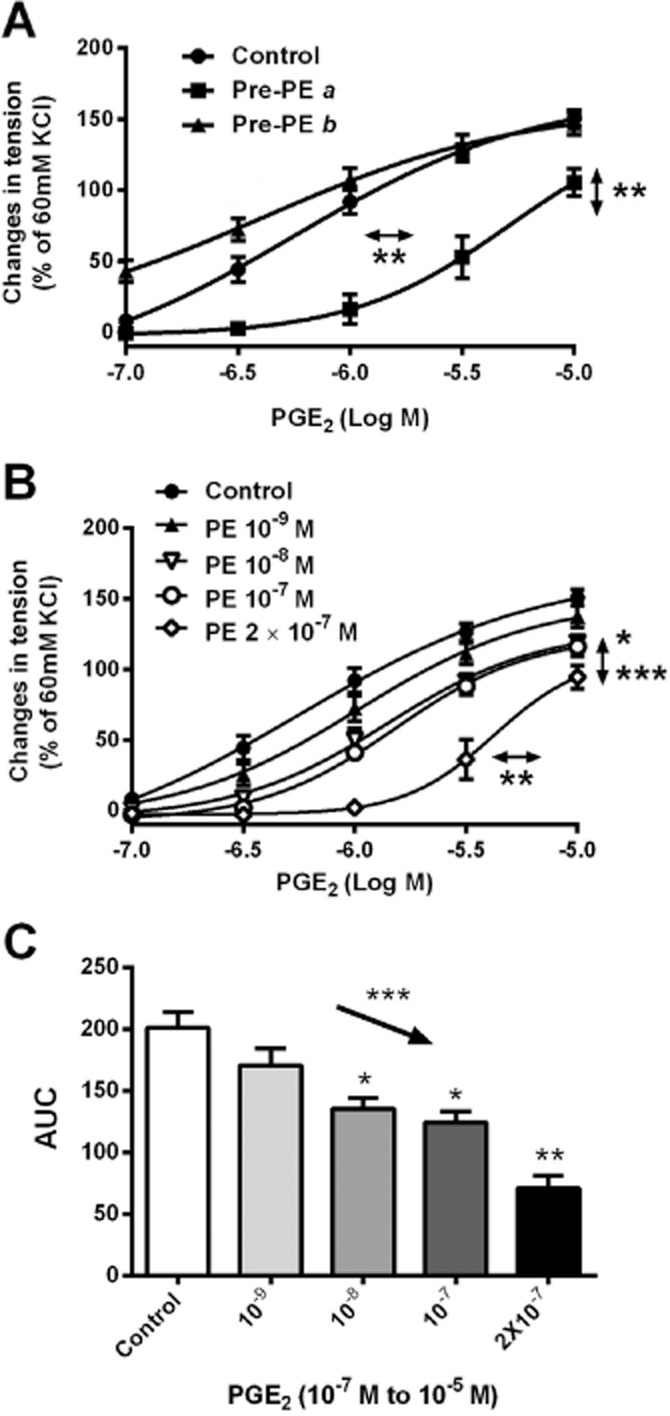
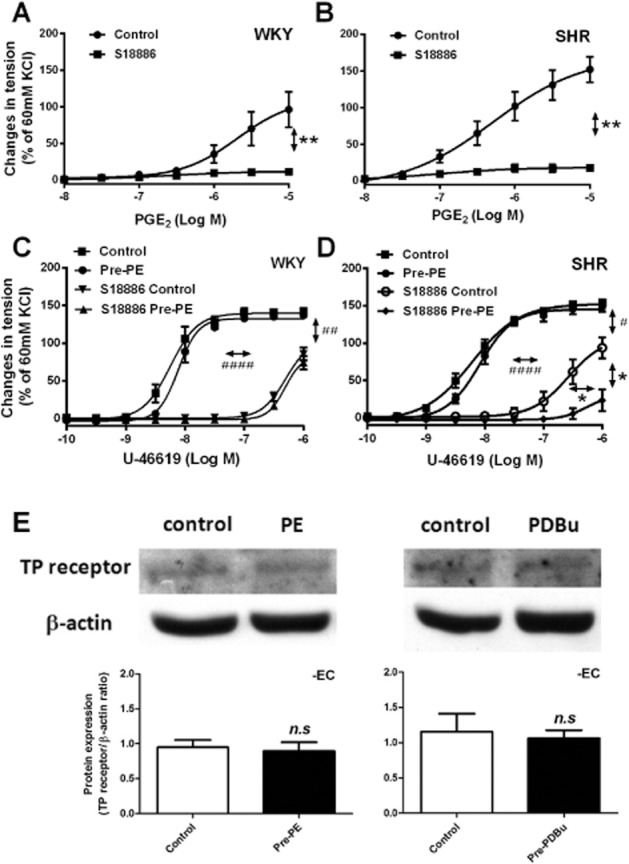
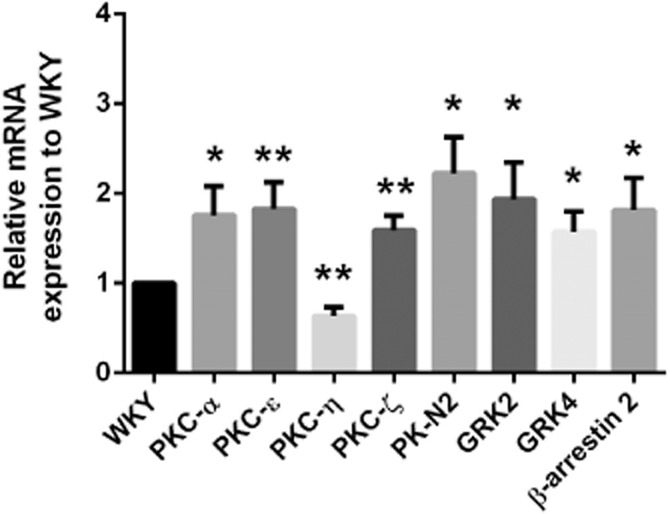
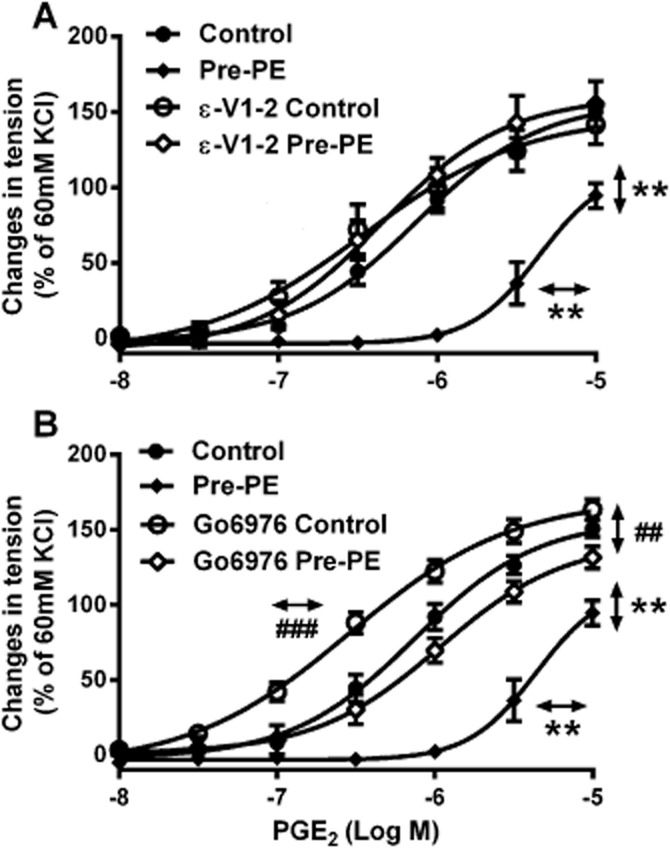
Key results: In aorta of 18 weeks SHR, but not age-matched WKY, pre-exposure to phenylephrine inhibited subsequent contractions to PGE2 that were mediated by thromboxane prostanoid (TP) receptors. This inhibition was not observed in preparations of pre-hypertensive 5-week-old SHR, and was significantly larger in those of 36- than 18-week-old SHR. Pre-exposure to the PKC activator, phorbol 12,13-dibutyrate, also inhibited subsequent contractions to PGE2 in SHR aortae. The selective inhibitor of PKC-ε, ε-V1-2, abolished the desensitization caused by pre-exposure to phenylephrine. Two molecular PKC bands were detected and their relative intensities differed in 36-week-old WKY and SHR vascular smooth muscle. The mRNA expressions of PKC-α, PKC-ε, PK-N2 and PKC-ζ and of G protein-coupled kinase (GRK)-2, GRK4 and β-arrestin2 were higher in SHR than WKY aortae.

Conclusions and implications: These experiments suggest that in the SHR but not the WKY aorta, α1 -adrenoceptor activation desensitizes TP receptors through activation of PKC-ε. This heterologous desensitization is a consequence of the chronic exposure to high arterial pressure.


Figures

Figure 1
Figure 1
(A–D) Contractions to increasing concentrations of PGE2 in rings [with (+EC) or without (−EC) endothelium] of 36-week-old WKY or SHR aortae with or without previous incubation (40 min) with phenylephrine (2 × 10⁻⁷ M; Pre-PE). (E and F) Contractions to increasing concentrations of PGE2 in rings of 18-week-old WKY or SHR aortae (without endothelium) with or without previous incubation (40 min) with noradrenaline (2 × 10⁻⁷ M; Pre-NA). Increases in tension above basal are expressed as percentage of the reference contraction to KCl (60 mM) obtained at the beginning of the experiment and shown as means ± SEM; vertical arrows indicate statistical comparisons between responses to the highest concentration tested, whereas horizontal arrows indicate comparisons between −logEC50 values (estimated by regression analysis); (A–D) n = 6, *P ≤ 0.05, **P ≤ 0.01 versus no previous exposure to the α1-adrenoceptor agonist; (E and F) n = 5, ****P ≤ 0.0001 versus without previous incubation with noradrenaline.
Figure 2
Figure 2
(A and B) Contractions to increasing concentrations of PGE2 in rings of 5-week-old WKY or SHR aortae (without endothelium) with or without previous incubation (40 min) with phenylephrine (2 × 10⁻⁷ M; Pre-PE); (C) contractions to increasing concentration of PGE2 shown as concentration-response curves (18 and 36 weeks old); (D) the AUC of Figure 2C, and the differences in PGE2-induced contractions expressed as area between the concentration-response curves between aortic rings of SHR at the same age (18 and 36 weeks old) with or without pre-exposure to phenylephrine (2 × 10⁻⁷ M; Pre-PE). Increases in tension above basal are expressed as percentage of the reference contraction to KCl (60 mM) obtained at the beginning of the experiment and data are shown as means ± SEM; vertical arrows indicate statistical comparisons between responses to the highest concentration tested, whereas horizontal arrows indicate comparisons between −logEC50 values (estimated by regression analysis); n = 6, (C) **P ≤ 0.01 versus without pre-exposure to phenylephrine. (D) **P ≤ 0.01 versus 18 weeks control, *P ≤ 0.05 versus 36 weeks control, *P ≤ 0.05 versus 18 weeks (D).
Figure 3
Figure 3
(A) Contractions to increasing concentrations of PGE2 in rings of SHR aortae (without endothelium); Pre-PE a, contractions obtained 15 min after pre-incubation with phenylephrine, Pre-PE b, contractions obtained 60 min after pre-incubation with phenylephrine (n = 4 ∼ 8). (B) Contractions to increasing concentrations of PGE2 in rings of SHR aortae (without endothelium) with or without previous incubation (40 min) with increasing concentrations of phenylephrine (PE, concentration; n = 6). (C) AUC of Figure 3B. Increases in tension above basal are expressed as percentage of the reference contraction to KCl (60 mM) obtained at the beginning of the experiment and shown as means ± SEM; vertical arrows indicate statistical comparisons between responses to the highest concentration tested, whereas horizontal arrows indicate comparisons between −logEC50 values (estimated by regression analysis); (A, B) *P ≤ 0.05 (PE 10−7 M), **P ≤ 0.01, ***P ≤ 0.001 (PE 2 × 10⁻⁷ M) versus without pre-exposure to PE. (C) The downward arrow indicates a linear decreasing trend (a systematically decreasing trend, which is statistically distinguished from random behaviour) between columns moving from left to right (***P ≤ 0.001); *P ≤ 0.05, **P ≤ 0.01 versus no previous incubation with PE.
Figure 4
Figure 4
(A, B) Contractions to increasing concentration of PGE2 in rings of WKY or SHR aortae (without endothelium) with or without incubation with S18886 (10−6 M, 40 min); (C, D) contractions to increasing concentrations of U46619 in the absence and presence of S18886 (10−7 M, 20 min) in rings of WKY or SHR aortae (without endothelium), with or without previous incubation with phenylephrine (Pre-PE, 2 × 10⁻⁷ M, 40 min). Increases in tension are expressed as percentage of the reference contraction to KCl (60 mM) obtained at the beginning of the experiment and shown as means ± SEM. (E) Western blotting shows TP receptor protein expression in SHR aortae without endothelium, with or without previous incubation (40 min) with phenylephrine (PE, 2 × 10⁻⁷ M, left, n = 4, the Mann–Whitney test was used for statistical analysis) or PDBu (10−7 M, right, n = 5); the images were analysed by ImageJ, and the expressions are expressed as the ratio of TP receptor/β-actin shown as means ± SEM. Vertical arrows indicate statistical comparisons between responses to the highest concentration used, whereas horizontal arrows indicate comparisons between −log EC50 values (estimated by regression analysis); (A, B) n = 6, **P ≤ 0.01 versus no incubation with S18886; (C, D) n = 6, #P ≤ 0.05, ##P ≤ 0.01, ####P ≤ 0.0001 incubation with versus without S18886 (no pre-exposure to phenylephrine group); *P ≤ 0.05 versus no previous incubation with phenylephrine.
Figure 5
Figure 5
Contractions to increasing concentrations of PGE2 in rings of (A, B) WKY or SHR aortae (without endothelium) with or without previous exposure to PDBu (10−7 M) and (C) SHR aortae (without endothelium) with or without previous exposure to phenylephrine (2 × 10⁻⁷ M; Pre-PE) in the presence of calphostin C (10−6 M); (D) Contractions to increasing concentrations of phenylephrine in the absence and presence of 5 × 10⁻⁹ M phenoxybenzamine (PBZ) in rings of SHR aortae (without endothelium), with or without previous incubation with phenylephrine (Pre-PE, 2 × 10⁻⁷ M, 40 min). Increases in tension above basal are expressed as percentage of the reference contraction to KCl (60 mM) obtained at the beginning of the experiment and shown as means ± SEM; vertical arrows indicate statistical comparisons between responses to the highest concentration tested, whereas horizontal arrows indicate comparisons between −log EC50 values (estimated by regression analysis); n = 6 (B) *P ≤ 0.05, ***P ≤ 0.001 versus no previous incubation with PDBu; (D) #P ≤ 0.05 incubation with versus without PBZ (no pre-exposure to phenylephrine group).
Figure 6
Figure 6
Western blotting shows the total PKC protein expression in aortic smooth muscle cells of (A) 5-week-old WKY or SHR, and (B) 36-week-old WKY or SHR. a, near 95 kD; b, near 72 kD; tot, total expression. The images were analysed by ImageJ; the expressions are expressed as the ratio of PKC/β-actin and shown as means ± SEM, 5 weeks, n = 6, 36 weeks, n = 9; *P ≤ 0.05, ***P ≤ 0.001 versus WKY; n.s., not significant.
Figure 7
Figure 7
Quantitative real-time PCR results showing mRNA expressions relative to WKY (see Methods) of PKC, GRK isoforms and β-arrestin2 in aortic smooth muscle cells of SHR. The black bar represents the mRNA expression in WKY as 1; the other bars represent the expression, relative to those of WKY, of different mRNAs in SHR. Data shown as means ± SEM. PKC-α, n = 11; other PKC, GRK isoforms and β-arrestin 2, n = 6 ∼ 9. *P ≤ 0.05, **P ≤ 0.01 versus WKY.
Figure 8
Figure 8
Contractions to increasing concentrations of PGE2 in the absence and presence of (A) ε-V1-2 (5 × 10⁻⁶ M) or (B) Go6976 (10−6 M) in rings of SHR aortae (without endothelium), with or without previous incubation with phenylephrine (Pre-PE, 2 × 10⁻⁷ M, 40 min). Increases in tension above basal are expressed as percentage of the reference contraction to KCl (60 mM) obtained at the beginning of the experiment and shown as means ± SEM. Vertical arrows indicate statistical comparisons between responses to the highest concentration tested, whereas horizontal arrows indicate comparisons between −log EC50 values (estimated by regression analysis); n = 6, (A, B) **P ≤ 0.01 versus no previous incubation with phenylephrine; (B) ##P ≤ 0.01, ###P ≤ 0.001 versus incubation with Go6976 but without pre-exposure to phenylephrine.

References

    1. Akita Y. Protein kinase C-epsilon (PKC-epsilon): its unique structure and function. J Biochem. 2002;132:847–852. - PubMed
    1. Alexander SPH, Benson HE, Faccenda E, Pawson AJ, Sharman JL, Spedding M, et al. The Concise Guide to PHARMACOLOGY 2013/14: Enzymes. Br J Pharmacol. 2013a;170:1797–1867. - PMC - PubMed
    1. Alexander SPH, Benson HE, Faccenda E, Pawson AJ, Sharman JL, Spedding M, et al. The Concise Guide to PHARMACOLOGY 2013/14: G protein-coupled receptors. Br J Pharmacol. 2013b;170:1459–1581. - PMC - PubMed
    1. Avendano MS, Lucas E, Jurado-Pueyo M, Martinez-Revelles S, Vila-Bedmar R, Mayor F, Jr, et al. Increased nitric oxide bioavailability in adult GRK2 hemizygous mice protects against angiotensin II-induced hypertension. Hypertension. 2014;63:369–375. - PubMed
    1. Baretella O, Xu A, Vanhoutte PM. Acidosis prevents and alkalosis augments endothelium-dependent contractions in mouse arteries. Pflugers Arch. 2014;466:295–305. - PubMed

Publication types

Substances

LinkOut - more resources