. 2015 Dec;22(12):1906-21.
doi: 10.1038/cdd.2015.30. Epub 2015 Apr 10.

MYB controls erythroid versus megakaryocyte lineage fate decision through the miR-486-3p-mediated downregulation of MAF

Affiliations

MYB controls erythroid versus megakaryocyte lineage fate decision through the miR-486-3p-mediated downregulation of MAF

E Bianchi et al. Cell Death Differ. 2015 Dec.

Abstract

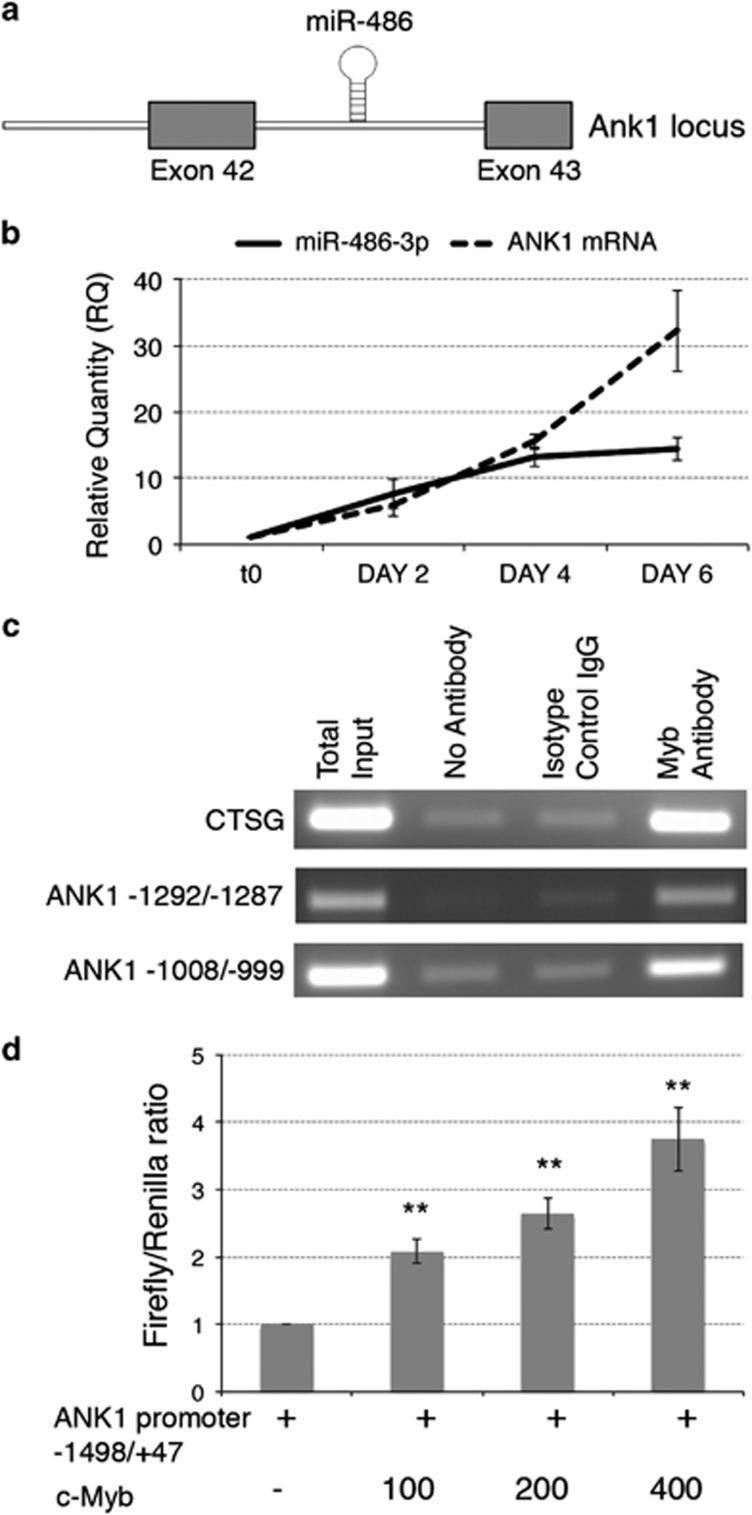
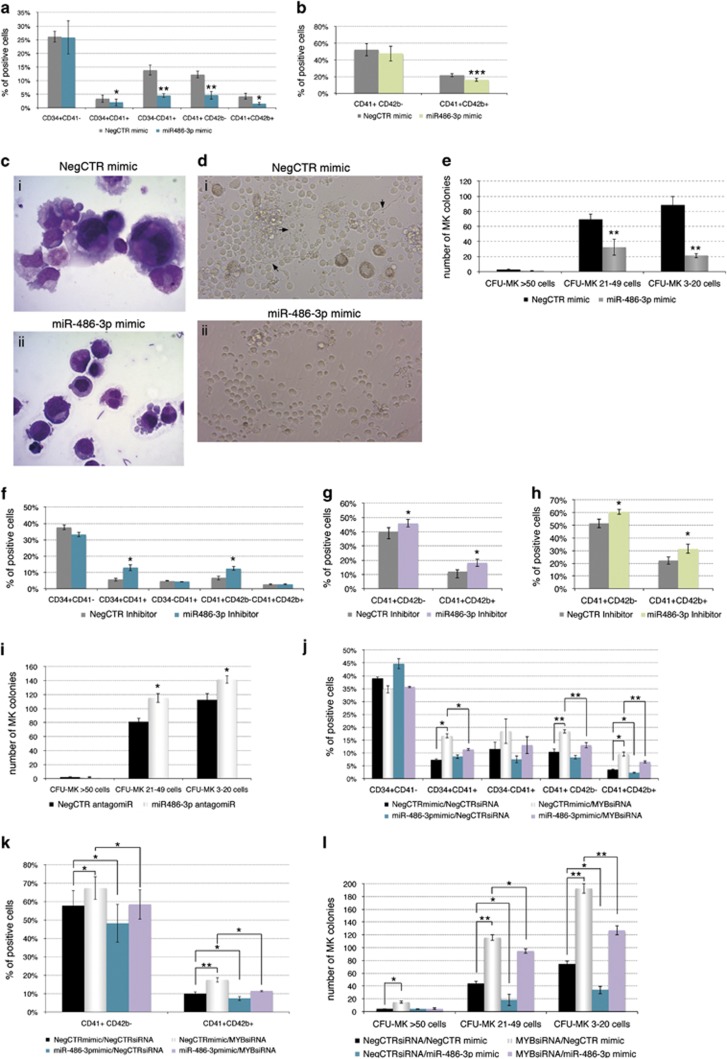
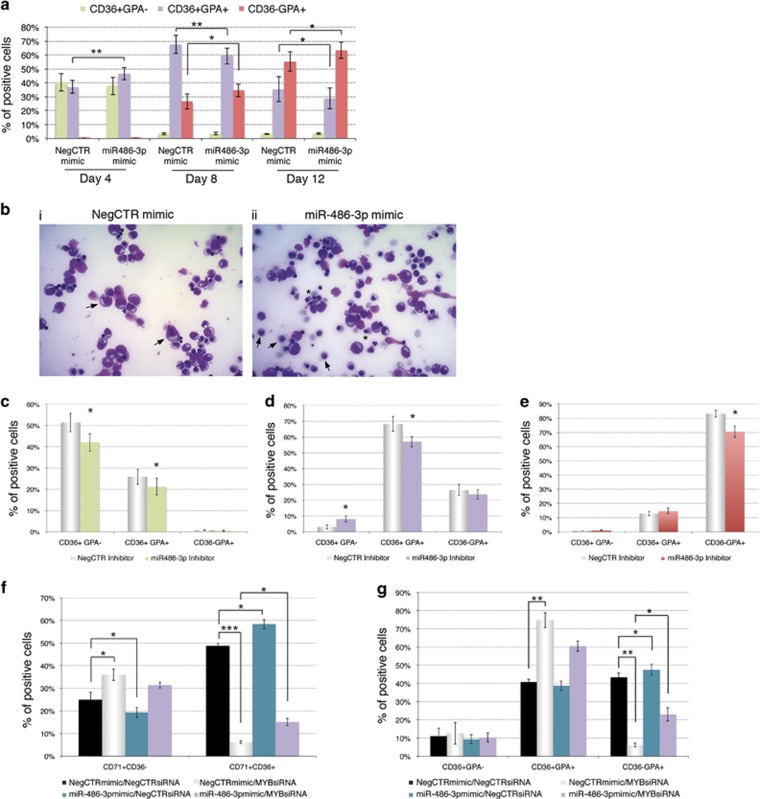
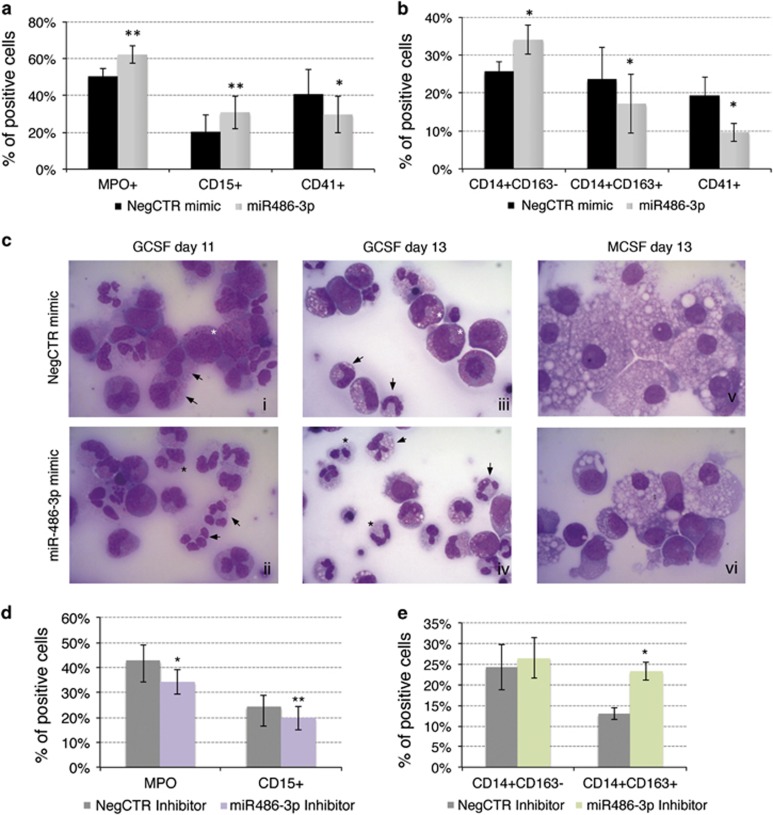
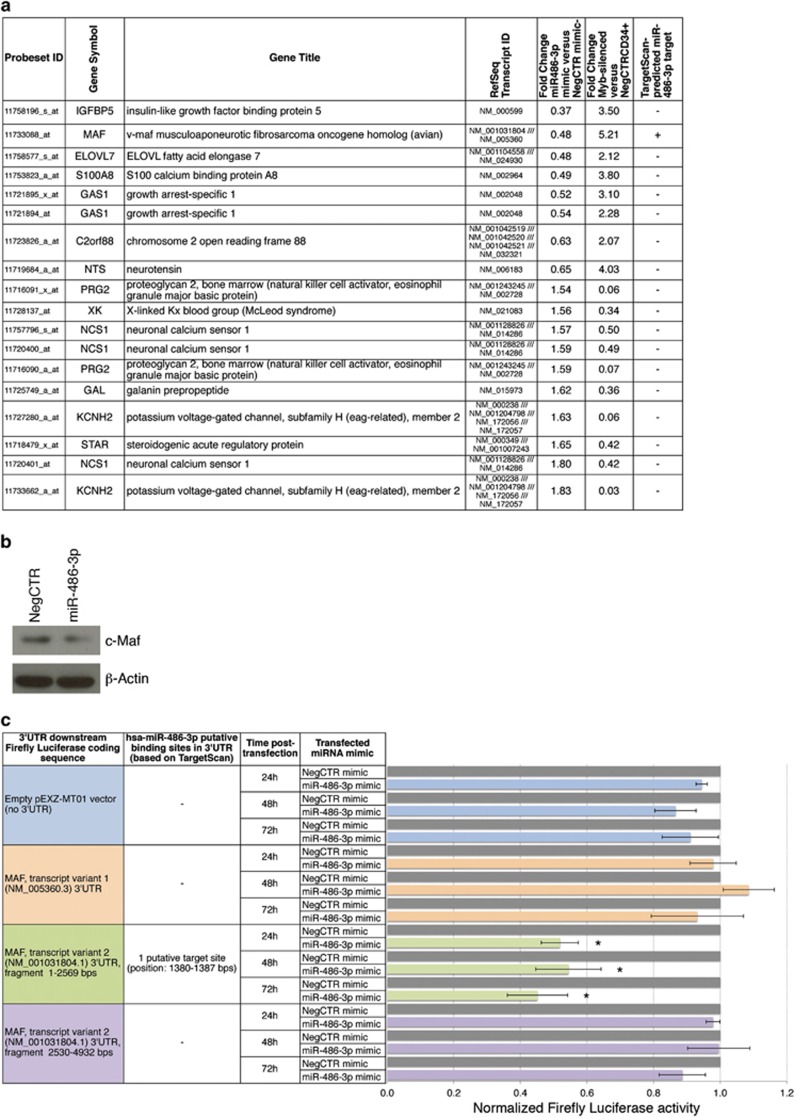
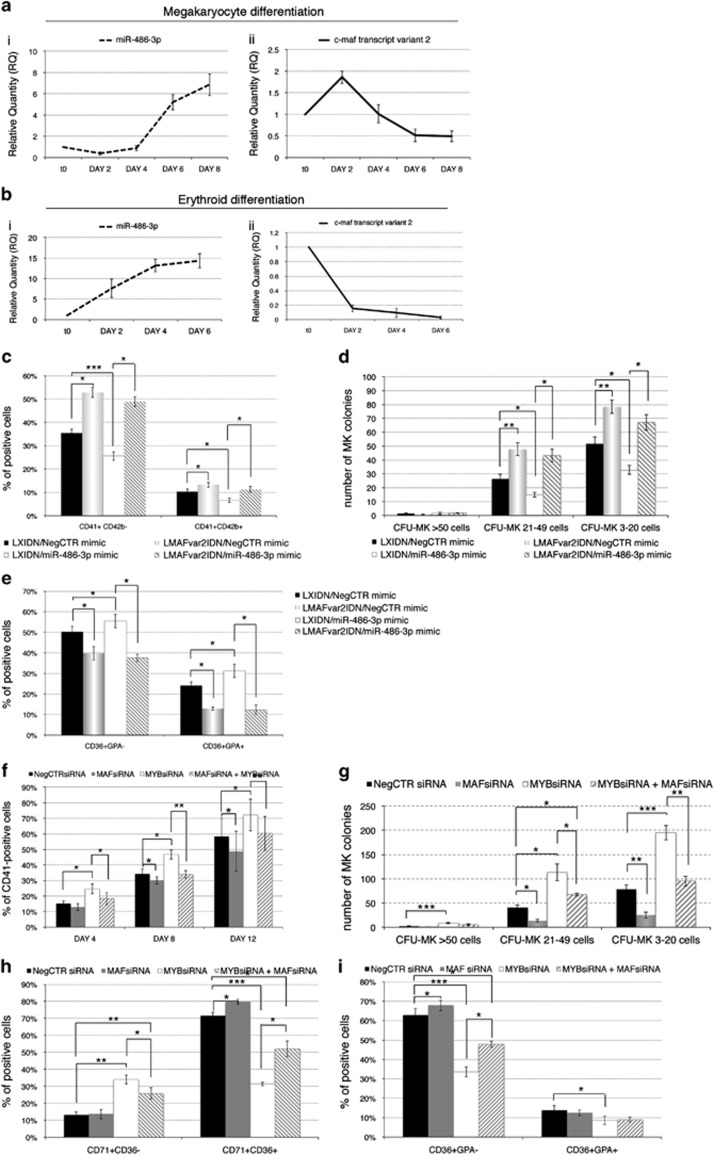
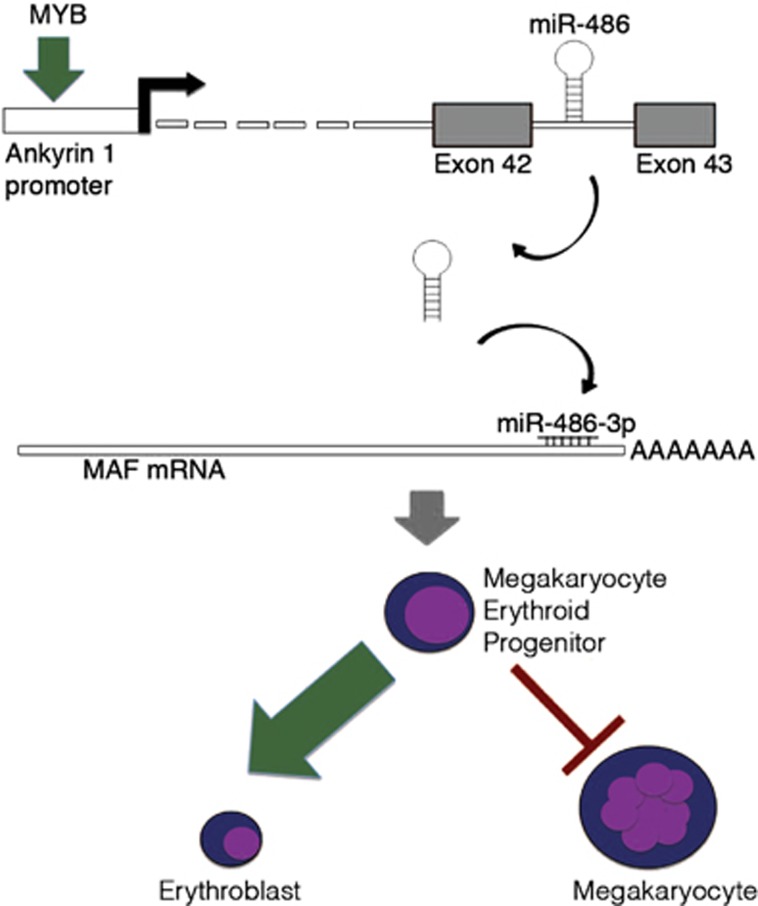
The transcription factor MYB has a key role in hematopoietic progenitor cells (HPCs) lineage choice, by enhancing erythropoiesis at the expense of megakaryopoiesis. We previously demonstrated that MYB controls erythroid versus megakaryocyte lineage decision by transactivating KLF1 and LMO2 expression. To further unravel the molecular mechanisms through which MYB affects lineage fate decision, we performed the integrative analysis of miRNA and mRNA changes in MYB-silenced human primary CD34+ HPCs. Among the miRNAs with the highest number of predicted targets, we focused our studies on hsa-miR-486-3p by demonstrating that MYB controls miR-486-3p expression through the transactivation of its host gene, ankyrin-1 (ANK1) and that miR-486-3p affects HPCs commitment. Indeed, overexpression and knockdown experiments demonstrated that miR-486-3p supports the erythropoiesis while restraining the megakaryopoiesis. Of note, miR-486-3p also favors granulocyte differentiation while repressing the macrophage differentiation. To shed some light on the molecular mechanisms through which miR-486-3p affects HPCs lineage commitment, we profiled the gene expression changes upon miR-486-3p overexpression in CD34+ cells. Among the genes downregulated in miR-486-3p-overexpressing HPCs and computationally predicted to be miR-486-3p targets, we identified MAF as a miR-486-3p target by 3'UTR luciferase reporter assay. Noteworthy, MAF overexpression was able to partially reverse the effects of miR-486-3p overexpression on erythroid versus megakaryocyte lineage choice. Moreover, the MYB/MAF co-silencing constrained the skewing of erythroid versus megakaryocyte lineage commitment in MYB-silenced CD34+ cells, by restraining the expansion of megakaryocyte lineage while partially rescuing the impairment of erythropoiesis. Therefore, our data collectively demonstrate that MYB favors erythropoiesis and restrains megakaryopoiesis through the transactivation of miR-486-3p expression and the subsequent downregulation of MAF. As a whole, our study uncovers the MYB/miR-486-3p/MAF axis as a new mechanism underlying the MYB-driven control of erythroid versus megakaryocyte lineage fate decision.


Figures

Figure 1
Figure 1
MYB-driven regulation of the ANK1 gene and the embedded miR-486-3p expression. (a) miR-486 is under the transcriptional regulation of the ankyrin 1 (ANK1) locus; data from UCSC Human Genome Browser-hg19 assembly. (b) miR-486-3p and ANK1 expression kinetics during erythroid differentiation of CD34+ cells. The expression levels of miR-486-3p and ANK1 mRNA were monitored by qRT-PCR at different culture time points after the EPO-driven induction of the erythroid differentiation in CD34+ cells. miR-486-3p mature miRNA and ANK1 mRNA levels were normalized versus housekeeping U6 snRNA and HPRT1 mRNA, respectively, and are reported as RQ respect to CD34+ cells at time 0 of treatment with EPO, which was set as calibrator. P≤0.05 at day 4 and day 6 compared with t0 for both miR-486-3p and ANK1. (c) ANK1 promoter-specific PCR performed in a representative ChIP experiment. PCR data are reported for both the putative MYB binding sites with the highest computational prediction scores (i.e. −1292/−1287 and −1008/−999, see Supplementary Table S5 for further details). ChIP and PCRs were performed in triplicate. (d) MYB transactivation of ANK1 promoter-driven luciferase expression. The amounts (in ng) of co-transfected plasmids are reported. Renilla-normalized Firefly luciferase levels (mean±S.E.M.; n=5) are normalized by setting the pXP1-ANK1(−1498/+47)/pCMV6XL5 empty vector-transfected sample as=1. Error bars represent S.E.M. **P≤0.01 compared with pXP1ANK1(−1498/+47)/pCMV6XL5 empty vector-transfected sample. n=number of experiments
Figure 2
Figure 2
Effects of miR-486-3p overexpression, miR-486-3p knockdown and miR-486-3p rescue upon MYB silencing on megakaryocyte differentiation. (a) Flow cytometric analysis (mean±S.E.M.; n=4) of CD34, CD41 and CD42b expression at day 4 of megakaryocyte unilineage culture post nucleofection. (b) Flow cytometric analysis (mean±S.E.M.; n=4) of CD41 and CD42b expression at day 12 of megakaryocyte unilineage culture post nucleofection. (c) Morphological analysis of NegCTR mimic (i) and miR-486-3p mimic-transfected cells (ii) after May–Grünwald–Giemsa staining at day 8 of megakaryocyte unilineage culture post nucleofection in a representative experiment. Magnification, × 1000. (d) Culture micrographs of NegCTR mimic (i) and miR-486-3p mimic-transfected cells (ii) at day 11 of megakaryocyte culture at × 200 magnification in a representative experiment. NegCTR mimic sample (i) shows the large, polyploid cells together with several proplatelet-forming (see black arrows) cells, which are almost undetectable in miR-486-3p-overexpressing sample (ii). (e) Megakaryocyte clonogenic assay results (mean±S.E.M.; n=4). CFU-MKs were scored according to the manufacturer's protocol based on their size, which reflects the maturation stage of the progenitor giving rise to each colony, as large (>50 cells, arising from more primitive MK progenitors), medium (21–49 cells) and small (3–21 cells, deriving from more mature megakaryocyte progenitors) colonies. The cells were plated 24 hours after the last nucleofection and scored after 12 days. Values are reported as number of megakaryocyte colonies for 4000 plated cells. *P≤0.05, **P≤0.01 and ***P≤0.001 in miR-486-3p mimic compared with NegCTR mimic sample. The efficient upregulation of miR-486-3p expression upon mimic transfection was checked at 24 hours post nucleofection by qRT-PCR (RQ±SE, 74.4±19.2, P<0.05) (fh) Flow cytometric analysis (mean±S.E.M.; n=3) of CD34, CD41 and CD42b expression at day 4 (f) and CD41 and CD42b at day 8 (g) and day 12 (h) of megakaryocyte unilineage culture post nucleofection with miR-486-3p/NegCTR inhibitor. (i) Megakaryocyte clonogenic assay results (mean±S.E.M.; n=3) for miR-486-3p and NegCTR Inhibitor-transfected CD34+ cells. CFU-MKs were scored according to the manufacturer's protocol based on their size, as reported above. Values are reported as number of megakaryocyte colonies for 4000 plated cells. *P≤0.05 in miR-486-3p inhibitor compared with NegCTR-inhibitor sample. The efficient knockdown of miR-486-3p expression upon inhibitor transfection was checked at 24 hours post nucleofection by qRT-PCR (RQ±SE, 0.593±0.161, P<0.05) (j and k) Flow cytometric analysis (mean±S.E.M.; n=3) of CD34, CD41 and CD42b expression at day 4 (j) and CD41 and CD42b at day 12 (k) of megakaryocyte unilineage culture post nucleofection with MYBsiRNA/NegCTRsiRNA and/or miR-486-3p/NegCTR mimics. (l) Megakaryocyte clonogenic assay results (mean±S.E.M.; n=3) for CD34+ cells transfected with MYBsiRNA/NegCTRsiRNA and/or miR-486-3p/NegCTR mimic. CFU-MKs were scored according to the manufacturer's protocol based on their size, as reported above. Values are reported as number of megakaryocyte colonies for 4000 plated cells. *P≤0.05, **P≤0.01 and ***P≤0.001. MYB and miR-486-3p expression levels were checked at 24 hours post nucleofection by qRT-PCR (RQ±SE, 0.423±0.122 in MYBsiRNA/NegCTR mimic and 0.487±0.148 in MYBsiRNA/miR-486-3p mimic for MYB; 75.821±13.347 in NegCTRsiRNA/miR-486-3p mimic and 70.382±11.027 in MYBsiRNA/miR-486-3p mimic for miR-486-3p levels; NegCTRsiRNA/NegCTR mimic set as calibrator). Abbreviations: CFU, colony forming unit; MK, megakaryocyte; MYBsiRNA, MYB-targeting siRNA; NegCTR inhibitor, negative control inhibitor; NegCTR mimic, negative control mimic; NegCTRsiRNA, negative control siRNA; and n=number of experiments
Figure 3
Figure 3
Effects of miR-486-3p overexpression, miR-486-3p knockdown and miR-486-3p rescue upon MYB silencing on erythroid differentiation. (a) Flow cytometric detection (mean±S.E.M.; n=4) of CD36 and GPA (intermediate and late erythroid markers, respectively) at days 4, 8 and 12 of erythroid unilineage culture post nucleofection. *P≤0.05 and **P≤0.01 in miR-486-3p mimic compared with NegCTR mimic sample. (b) Morphological analysis of NegCTR (i) and miR-486-3p mimic-transfected cells (ii) after May–Grünwald–Giemsa staining at day 8 of erythroid unilineage culture post nucleofection in a representative experiment. Magnification, × 400. NegCTR mimic sample (i) displays more immature cells such as proerythroblasts and basophilic erythroblasts (see black arrows), while miR-486-3p mimic sample (ii) is enriched in cells from later steps of erythroid differentiation such as orthocromatic erythroblasts (see black arrows) together with nuclear extrusion phenomena (see asterisks) and enucleated reticulocytes/erythrocytes. The efficient upregulation of miR-486-3p expression upon mimic transfection was checked at 24 hours post nucleofection by qRT-PCR (RQ±SE, 74.4±19.2, P<.05) (ce) Flow cytometric detection (mean±S.E.M.; n=3) of CD36 and GPA at days 4 (c), 8 (d) and 12 (e) of erythroid unilineage culture post nucleofection with miR-486-3p/NegCTR inhibitors. *P≤0.05 in miR-486-3p inhibitor compared with NegCTR inhibitor sample. The efficient knockdown of miR-486-3p expression upon inhibitor transfection was checked at 24 hours post nucleofection by qRT-PCR (RQ±SE, 0.593±0.161, P<.05) (f, g) Flow cytometric data (mean±S.E.M.; n=3) for the expression of CD71, CD36 and GPA (early, intermediate and late erythroid markers, respectively) during erythroid unilineage culture. Data reported in the graphs display the percentages of CD71+CD36- (early erythroid) and CD71+CD36+ (intermediate erythroid cells) at day 4 (f) and the fractions of CD36+GPA- (intermediate), CD36+GPA+ (more mature) and CD36-GPA+ (late) erythroid cells (g) at day 8 of erythroid unilineage culture post nucleofection with MYBsiRNA/NegCTRsiRNA and/or miR-486-3p mimic/NegCTR mimic. *P≤0.05, **P≤0.01 and ***P≤0.001. MYB and miR-486-3p expression levels were checked at 24 hours post nucleofection by qRT-PCR (RQ±SE, 0.423±0.122 in MYBsiRNA/NegCTR mimic and 0.487±0.148 in MYBsiRNA/miR-486-3p mimic for MYB; 75.821±13.347 in NegCTRsiRNA/miR-486-3p mimic and 70.382±11.027 in MYBsiRNA/miR-486-3p mimic for miR-486-3p levels; NegCTRsiRNA/NegCTR mimic set as calibrator). Abbreviations: GPA, glycophorin A; MYBsiRNA, MYB-targeting siRNA; NegCTR mimic, negative control mimic; NegCTR inhibitor, negative control inhibitor; NegCTRsiRNA, negative control siRNA; n=number of experiments
Figure 4
Figure 4
Effects of miR-486-3p overexpression and miR-486-3p knockdown on CD34+ cells granulocyte and mono-macrophage differentiation. (a) Flow cytometric detection (mean±S.E.M.; n=4) of granulocyte MPO and CD15 and megakaryocyte CD41 markers at day 10 of granulocyte unilineage culture post nucleofection. (b) Flow cytometric detection (mean±S.E.M.; n=4) of mono-macrophage CD14, macrophage-specific CD163 and megakaryocyte CD41 differentiation markers at day 10 of mono-macrophage unilineage culture post nucleofection. *P≤0.05 and **P≤0.01 in miR-486-3p mimic compared with NegCTR mimic sample. (c) Morphological analysis of NegCTR (i, iii, v) and miR-486-3p mimic-transfected cells (ii, iv, vi) after May–Grünwald–Giemsa staining at days 11 (i, ii) and 13 (iii, iv) of granulocyte and day 13 (v, vi) of mono-macrophage unilineage culture post nucleofection in a representative experiment. GCSF-driven granulocyte unilineage culture highlighted at day 11 post nucleofection in NegCTR mimic sample (i) a higher fraction of more immature cells such as promyelocytes (see white asterisk) and neutrophilic metamyelocytes (black arrows), while miR-486-3p mimic sample (ii) was enriched in more mature cells, such as two-lobed (black asterisk) and segmented neutrophils (black arrows). Similarly, at 13 days of granulocyte unilineage culture NegCTR mimic sample (iii) presented a more immature phenotype, mainly represented by neutrophilic metamyelocytes (white asterisks) and neutrophilic band cells (black arrows), while miR-486-3p mimic sample (iv) was enriched in two-lobed (black asterisks) and segmented neutrophils (black arrows), representing the last steps of granulocyte differentiation. By contrast, morphological analysis at day 13 of MCSF-driven mono-macrophage unilineage culture showed a uniform macrophage morphology in NegCTR cells (v), while miR-486-3p-overexpressing cells (vi) still displayed a large portion of monocytes besides terminally differentiated macrophages. Magnification, × 1000. The efficient upregulation of miR-486-3p expression upon mimic transfection was checked at 24 hours post nucleofection by qRT-PCR (RQ±SE, 74.4±19.2, P<.05) (d and e) Flow cytometric detection (mean±S.E.M.; n=3) of granulocyte MPO and CD15 at day 10 of granulocyte unilineage culture (d) and of mono-macrophage CD14 and macrophage-specific CD163 differentiation markers at day 6 of mono-macrophage unilineage culture post nucleofection (e) with miR-486-3p/NegCTR inhibitors. *P≤0.05 and **P≤0.01 in miR-486-3p inhibitor compared with NegCTR inhibitor sample. The efficient knockdown of miR-486-3p expression upon inhibitor transfection was checked at 24 hours post nucleofection by qRT-PCR (RQ±SE, 0.593±0.161, P<0.05). Abbreviations: GCSF, granulocyte colony stimulating factor; MCSF, macrophage colony stimulating factor; MPO, Myeloperoxidase; NegCTR mimic, negative control mimic; NegCTR inhibitor, negative control inhibitor; n=number of experiments
Figure 5
Figure 5
Gene expression profiling in miR-486-3p-overexpressing CD34+ cells and validation of the miR-486-3p/MAF 3'UTR interaction. (a) DEGs in miR-486-3p-overexpressing compared with the NegCTR mimic-transfected CD34+ cells at 24 hours post nucleofection. DEGs in table are selected as modulated in both miR-486-3p-overexpressing compared with NegCTR mimic cells and in MYB-silenced compared with NegCTRsiRNA cells. For both these comparisons, transcripts modulations are reported as fold change. Transcripts in the table are ranked based on the fold change in miR-486-3p mimic compared with NegCTR mimic samples. Data for the computational prediction of miR-486-3p targets from TargetScan are reported in the last column. (b) Western blotting analysis of MAF protein levels in protein lysates from miR-486-3p mimic-transfected compared with NegCTR mimic-transfected CD34+ cells at 24 hours after the last of two nucleofection cycles (i.e. at the same time point selected for gene expression profiling). β-actin protein levels are reported as loading control. (c) Renilla-normalized Firefly luciferase activity in K562 cells nucleofected with either a NegCTR mimic or a miR-486-3p mimic and the indicated 3′untranslated region (3′UTR) luciferase reporter vectors. Renilla-normalized Firefly luciferase activity (mean±S.E.M.; n=3) was measured at 24, 48 and 72 hours post nucleofection. Each bar represents the luciferase activity upon miR-486-3p overexpression normalized to the value of the same 3′UTR luciferase vector upon NegCTR mimic transfection. *P<0.05 compared with NegCTR mimic sample.
Figure 6
Figure 6
Rescue of MAF expression in miR-486-3p-overexpressing cells and co-silencing of MYB and MAF in CD34+ cells. (a and b) Expression kinetics of miR-486-3p (ai, bi) and MAF mRNA (transcript variant 2) (aii, bii) during the megakaryocyte (a) and the erythroid (b) differentiation of CD34+ cells; qRT-PCR-detected modulations are reported as RQ compared with CD34+ cells (day 0). Values in the graphs are reported as mean±S.E.M. (n=3). (c) Flow cytometric analysis (mean±S.E.M.; n=3) of CD41 and CD42b expression at day 4 of megakaryocyte unilineage culture post purification of miR-486-3p/NegCTR mimic-transfected, LMAFvar2IDN/LXIDN-transduced cells. (d) Megakaryocyte clonogenic assay results (mean±S.E.M.; n=3) for miR-486-3p/NegCTR mimic-transfected, LMAFvar2IDN/LXIDN-transduced CD34+ cells. Cells were plated after the NGFR-based selection of transduced cells and scored after 12 days. CFU-MKs were scored according to the manufacturer's protocol based on their size, as reported in Figure 2 legend. Values are reported as number of megakaryocyte colonies for 10 000 plated cells. *P≤0.05, **P≤0.01 and ***P≤0.001. (e) Flow cytometric detection (mean±S.E.M.; n=3) of CD36+GPA- and CD36+GPA+ erythroid populations at day 4 of erythroid unilineage culture post purification of miR-486-3p/NegCTR mimic-transfected, LMAFvar2IDN/LXIDN-transduced cells. In NGFR+ cells the efficient upregulation of miR-486-3p expression was checked by qRT-PCR (RQ±SE, 58.3±13.2 in miR-486-3p mimic/LXIDN and 67.9±17.1 in miR-486-3p mimic/LMAFvar2IDN, NegCTR mimic/LXIDN sample set as calibrator), while MAF protein levels were detected by western blot (data not shown). (f) Flow cytometric analysis (mean±S.E.M.; n=4) of the CD41 expression at day 4, 8 and 12 of megakaryocyte culture post nucleofection. (g) Megakaryocyte clonogenic assay results (mean±S.E.M.; n=4). Cells were plated 24 hours after the last nucleofection and scored after 12 days. CFU-MKs were scored according to the manufacturer's protocol based on their size, as detailed in Figure 2 legend. Values are reported as number of megakaryocyte colonies for 4000 plated cells. (h and i) Flow cytometry data (mean±S.E.M.; n=4) for the expression of of CD71, CD36 and GPA (early, intermediate and late erythroid markers, respectively) during erythroid unilineage culture. Data reported in the graphs display the percentages of CD71+CD36- (early) and CD71+CD36+ (intermediate) erythroid cells (h), besides the fractions of CD36+GPA- (intermediate) and CD36+GPA+ (more mature) cells (i) at day 4 of erythroid unilineage culture post nucleofection. qRT-PCR data demonstrated that, as expected, MAF was upregulated upon MYB silencing (RQ±SE, 6.758±0.559, P<0.01 in MYBsiRNA compared with NegCTRsiRNA, n=4); on the contrary it was efficiently downregulated after MAF silencing in both MAFsiRNA compared with NegCTRsiRNA (RQ±SE, 0.329±0.035, P<0.01, n=4) and MYBsiRNA+MAFsiRNA compared with MYBsiRNA (RQ±SE, 2.055±0.213, P<0.05, n=4) at 24 hours post nucleofection. *P≤0.05, **P≤0.01 and ***P≤0.001. Abbreviations: CFU, colony forming unit; GPA, glycophorin A; MK, megakaryocyte; NegCTRsiRNA, negative control siRNA; n=number of experiments
Figure 7
Figure 7
Schematic illustration of the mechanism through which the MYB/miR-486-3p/MAF axis regulates erythroid versus megakaryocyte lineage fate decision. MYB-mediated transactivation of ANK1 expression determines the upregulation of miR-486-3p, which in turn targets MAF mRNA for degradation. Therefore, through the downregulation of MAF, MYB restrains the megakaryocyte commitment and favors the erythroid one in megakaryocyte erythroid progenitors

References

    1. Mucenski ML, McLain K, Kier AB, Swerdlow SH, Schreiner CM, Miller TA et al. A functional c-myb gene is required for normal murine fetal hepatic hematopoiesis. Cell 1991; 65: 677–689. - PubMed
    1. Emambokus N, Vegiopoulos A, Harman B, Jenkinson E, Anderson G, Frampton J. Progression through key stages of haemopoiesis is dependent on distinct threshold levels of c-Myb. Embo J 2003; 22: 4478–4488. - PMC - PubMed
    1. Bianchi E, Zini R, Salati S, Tenedini E, Norfo R, Tagliafico E et al. c-myb supports erythropoiesis through the transactivation of KLF1 and LMO2 expression. Blood 2010; 116: e99–110. - PubMed
    1. Carpinelli MR, Hilton DJ, Metcalf D, Antonchuk JL, Hyland CD, Mifsud SL et al. Suppressor screen in Mpl-/- mice: c-Myb mutation causes supraphysiological production of platelets in the absence of thrombopoietin signaling. Proc Natl Acad Sci USA 2004; 101: 6553–6558. - PMC - PubMed
    1. Kauppi M, Murphy JM, de Graaf CA, Hyland CD, Greig KT, Metcalf D et al. Point mutation in the gene encoding p300 suppresses thrombocytopenia in Mpl-/- mice. Blood 2008; 112: 3148–3153. - PMC - PubMed

Publication types

MeSH terms