

Tobacco smoking and all-cause mortality in a large Australian cohort study: findings from a mature epidemic with current low smoking prevalence
- PMID: 25857449
- PMCID: PMC4339244
- DOI: 10.1186/s12916-015-0281-z
Tobacco smoking and all-cause mortality in a large Australian cohort study: findings from a mature epidemic with current low smoking prevalence
Abstract
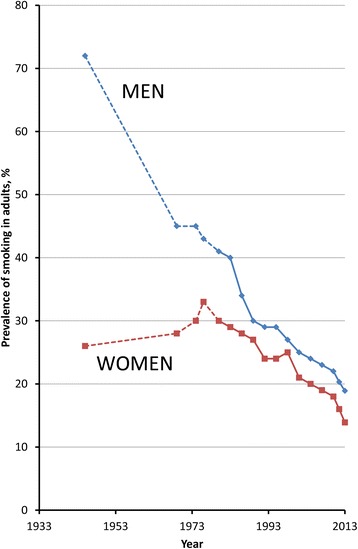
Background: The smoking epidemic in Australia is characterised by historic levels of prolonged smoking, heavy smoking, very high levels of long-term cessation, and low current smoking prevalence, with 13% of adults reporting that they smoked daily in 2013. Large-scale quantitative evidence on the relationship of tobacco smoking to mortality in Australia is not available despite the potential to provide independent international evidence about the contemporary risks of smoking.
Methods: This is a prospective study of 204,953 individuals aged ≥45 years sampled from the general population of New South Wales, Australia, who joined the 45 and Up Study from 2006-2009, with linked questionnaire, hospitalisation, and mortality data to mid-2012 and with no history of cancer (other than melanoma and non-melanoma skin cancer), heart disease, stroke, or thrombosis. Hazard ratios (described here as relative risks, RRs) for all-cause mortality among current and past smokers compared to never-smokers were estimated, adjusting for age, education, income, region of residence, alcohol, and body mass index.
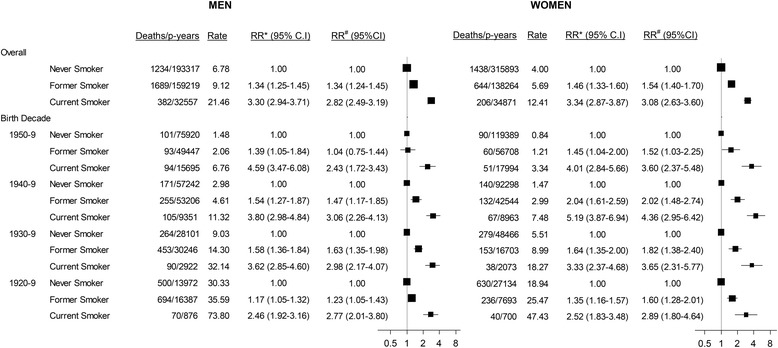
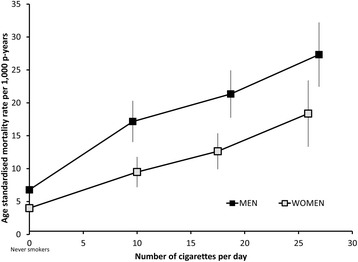
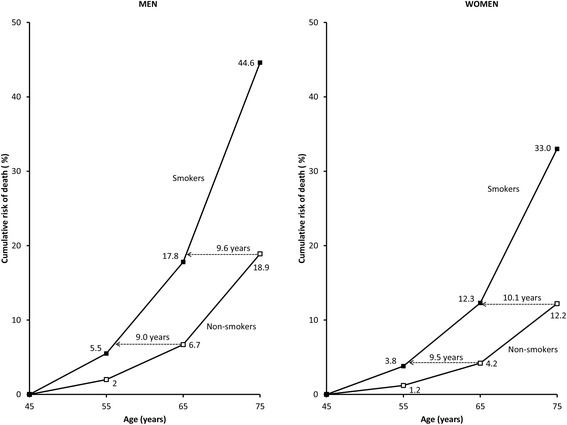
Results: Overall, 5,593 deaths accrued during follow-up (874,120 person-years; mean: 4.26 years); 7.7% of participants were current smokers and 34.1% past smokers at baseline. Compared to never-smokers, the adjusted RR (95% CI) of mortality was 2.96 (2.69-3.25) in current smokers and was similar in men (2.82 (2.49-3.19)) and women (3.08 (2.63-3.60)) and according to birth cohort. Mortality RRs increased with increasing smoking intensity, with around two- and four-fold increases in mortality in current smokers of ≤14 (mean 10/day) and ≥25 cigarettes/day, respectively, compared to never-smokers. Among past smokers, mortality diminished gradually with increasing time since cessation and did not differ significantly from never-smokers in those quitting prior to age 45. Current smokers are estimated to die an average of 10 years earlier than non-smokers.
Conclusions: In Australia, up to two-thirds of deaths in current smokers can be attributed to smoking. Cessation reduces mortality compared with continuing to smoke, with cessation earlier in life resulting in greater reductions.
Figures

References
-
- US Department of Health and Human Services. The health consequences of smoking—50 years of progress: a report of the surgeon general. Atlanta, GA; 2014. http://www.surgeongeneral.gov/library/reports/50-years-of-progress/.
-
- Lim SS, Vos T, Flaxman A, Danaei G, Shibuya K, Adair-Rohani H, et al. A comparative risk assessment of burden of disease and injury attributable to 67 risk factors and risk factor clusters in 21 regions, 1990–2010: a systematic analysis for the Global Burden of Disease Study 2010. Lancet. 2012;380:2224–60. doi: 10.1016/S0140-6736(12)61766-8. - DOI - PMC - PubMed
-
- Doll R, Peto R, Boreham J, Sutherland I. Mortality in relation to smoking: 50 years’ observations on male British doctors. Br Med J. 2004;328:1519–28. doi: 10.1136/bmj.38142.554479.AE. - DOI - PMC - PubMed
-
- Carter KN, Blakely T, Soeberg M. Trends in survival and life expectancy by ethnicity, income and smoking in New Zealand: 1980s to 2000s. N Z Med J. 2010;123:13–24. - PubMed
-
- Sitas F, Egger S, Bradshaw D, Groenewald P, Laubscher R, Kielkowski D, et al. Differences among the coloured, white, black, and other South African populations in smoking-attributed mortality at ages 35–74 years: a case–control study of 481,640 deaths. Lancet. 2013;382:685–93. doi: 10.1016/S0140-6736(13)61610-4. - DOI - PubMed
Publication types
MeSH terms
Grants and funding
LinkOut - more resources
Full Text Sources
Other Literature Sources
Miscellaneous
