. 2015 Jul;29(7):3100-9.
doi: 10.1096/fj.14-269084. Epub 2015 Apr 9.

Quantifying progression and regression of thrombotic risk in experimental atherosclerosis

Affiliations

Quantifying progression and regression of thrombotic risk in experimental atherosclerosis

Rohun U Palekar et al. FASEB J. 2015 Jul.

Abstract

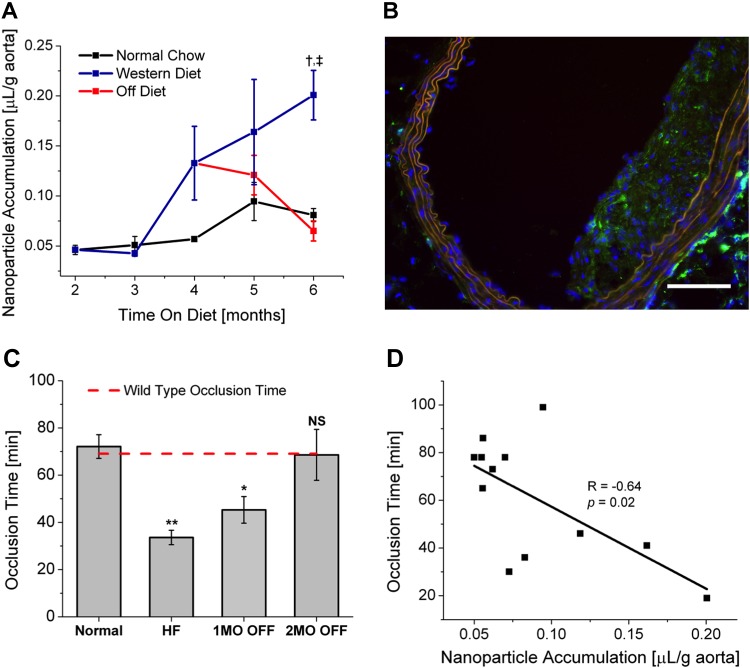
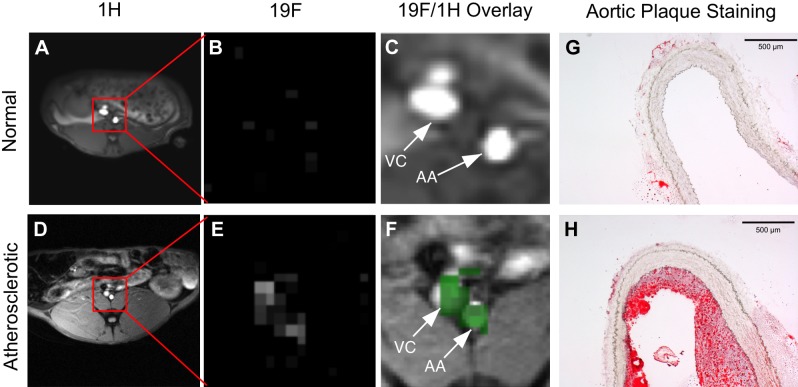
Currently, there are no generally applicable noninvasive methods for defining the relationship between atherosclerotic vascular damage and risk of focal thrombosis. Herein, we demonstrate methods to delineate the progression and regression of vascular damage in response to an atherogenic diet by quantifying the in vivo accumulation of semipermeable 200-300 nm perfluorocarbon core nanoparticles (PFC-NP) in ApoE null mouse plaques with [(19)F] magnetic resonance spectroscopy (MRS). Permeability to PFC-NP remained minimal until 12 weeks on diet, then increased rapidly following 12 weeks, but regressed to baseline within 8 weeks after diet normalization. Markedly accelerated clotting (53.3% decrease in clotting time) was observed in carotid artery preparations of fat-fed mice subjected to photochemical injury as defined by the time to flow cessation. For all mice on and off diet, an inverse linear relationship was observed between the permeability to PFC-NP and accelerated thrombosis (P = 0.02). Translational feasibility for quantifying plaque permeability and vascular damage in vivo was demonstrated with clinical 3 T MRI of PFC-NP accumulating in plaques of atherosclerotic rabbits. These observations suggest that excessive permeability to PFC-NP may indicate prothrombotic risk in damaged atherosclerotic vasculature, which resolves within weeks after dietary therapy.

Keywords: MRI; endothelium; nanoparticles; thrombosis.


Figures

Figure 1.
Figure 1.
A) [19F] MRS demonstrating time dependence of NP accumulation in ApoE null mouse aortas with or without a Western diet. Continuous Western diet feeding results in a significant increase in NP accumulation over age-matched normal chow controls. Return to a normal chow diet restores control levels of NP accumulation. Off-diet group at 6 months was not significantly different from age-matched normal chow controls. Trend analysis on Western diet and off-diet groups following 4 months on diet demonstrates significant difference in progression of NP accumulation (P = 0.015). P = 0.003; P = 0.0009 vs. age-matched Western diet group. B) Immunofluorescent staining confirms abundant intraplaque thrombin (green) in mouse aortic plaques. Scale bar, 100 μm. C) Return to normal chow progressively increases carotid occlusion times to control values for both normal chow ApoE null mice (leftmost bar) and wild-type mice (dashed line: based on prior published data (14). *P = 0.0056, **P = 0.004 vs. control. HF, high-fat diet; NS, not significant. D) Correlation plot of aortic NP accumulation and carotid occlusion time (R = −0.64, P = 0.02) demonstrating relationship between vascular permeability and thrombotic potential.
Figure 2.
Figure 2.
A) Scanning electron microscopy of cholesterol crystals densely deposited on surface of aortic plaque. Scale bar, 100 μm. (B) Scanning electron microscopy of cholesterol crystals on denuded plaque (P) but not on adjacent regular endothelium (E). Scale bar, 40 μm. C) Higher magnification scanning electron microscopy depicts morphology of cholesterol crystals. Scale bar, 20 μm. D–F) Immunofluorescent staining for CD31 (green) demonstrates little to no intraplaque angiogenesis in ApoE null fed a Western diet for (D) 4 months, (E) 5 months, and (F) 6 months. Scale bar, 50 μm.
Figure 3.
Figure 3.
A) Penetration of FITC-dextran (green) and PFC-NP (red) into a plaque is revealed with 3-dimensional 2-photon microscopy imaging of en face atherosclerotic rabbit aortic tissue. B) Two-photon microscopy of en face normal rabbit aortic tissue. Scale bar, 50 μm. Tissue autofluorescence is shown in blue. C) Side view 2-photon microscopy image of atherosclerotic rabbit tissue demonstrating penetration of FITC-dextran (green) and PFC-NP (red) into plaques. D) Side view 2-photon microscopy image of normal rabbit tissue demonstrating lack of FITC-dextran (green) and PFC-NP (red) penetration through intact tissue lumenal barriers. Scale bar, 50 μm.
Figure 4.
Figure 4.
A) FACS analysis reveals minimal cellular active uptake of rhodamine-labeled PFC-NP by 0.26% of circulating peripheral blood leukocytes. The RhodPE+ population comprises Ly6C+Ly6G+ cells (myeloid cells) and a small number of CD19+ cells (B cells). B) FACS analysis reveals minimal active uptake of PFC-NP by 0.93% of splenocytes. The RhodPE+ population comprises F40/80+ and Ly6C+F4/80+ cells (monocytes/macrophages) and a smaller percentage of CD19+ cells (B cells). T cells (TCRb+) do not take up PFC-NP.
Figure 5.
Figure 5.
Cross-sectional [1H] images at 3 T of (A) normal chow rabbit and (D) cholesterol fed rabbit showing location of abdominal aorta (red box). [19F] gradient echo images of PFCE NP [19F] signal in the region of interest for (B) normal chow-fed rabbit and (E) cholesterol-fed rabbit. Saturation bands proximal and distal to imaging slice eliminate [19F] signal from blood (see Supplemental Fig. 4). [19F] signal (green) overlaid on [1H] image showing [19F] signal colocalization for the region of interest in a (C) normal chow-fed rabbit and (F) cholesterol-fed rabbit, demonstrating deposition of PFC-NP only in inflamed abdominal aorta (AA) and vena cava (VC). Representative Oil Red O stains of the imaged area showing plaque elements in the (G) normal chow rabbit aorta and the (H) cholesterol-fed rabbit aorta. Scale bars, 500 μm.

References

    1. Stone G. W., Maehara A., Lansky A. J., de Bruyne B., Cristea E., Mintz G. S., Mehran R., McPherson J., Farhat N., Marso S. P., Parise H., Templin B., White R., Zhang Z., Serruys P. W.; PROSPECT Investigators (2011) A prospective natural-history study of coronary atherosclerosis. N. Engl. J. Med. 364, 226–235 - PubMed
    1. Saric M., Kronzon I. (2012) Aortic atherosclerosis and embolic events. Curr. Cardiol. Rep. 14, 342–349 - PubMed
    1. Croce K., Libby P. (2007) Intertwining of thrombosis and inflammation in atherosclerosis. Curr. Opin. Hematol. 14, 55–61 - PubMed
    1. Demetz G, Ott I. (2012) The interface between inflammation and coagulation in cardiovascular disease. Int. J. Inflam. 2012, 860301. - PMC - PubMed
    1. Gerrity R. G., Richardson M., Somer J. B., Bell F. P., Schwartz C. J. (1977) Endothelial cell morphology in areas of in vivo Evans blue uptake in the aorta of young pigs. II. Ultrastructure of the intima in areas of differing permeability to proteins. Am. J. Pathol. 89, 313–334 - PMC - PubMed

Publication types

MeSH terms