. 2015 Jul;29(7):3014-26.
doi: 10.1096/fj.14-265694. Epub 2015 Apr 9.

A proton current associated with sour taste: distribution and functional properties

Affiliations

A proton current associated with sour taste: distribution and functional properties

Jeremy D Bushman et al. FASEB J. 2015 Jul.

Abstract

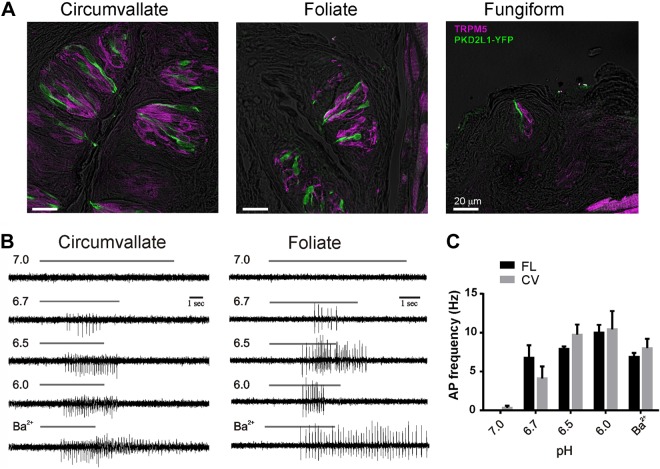
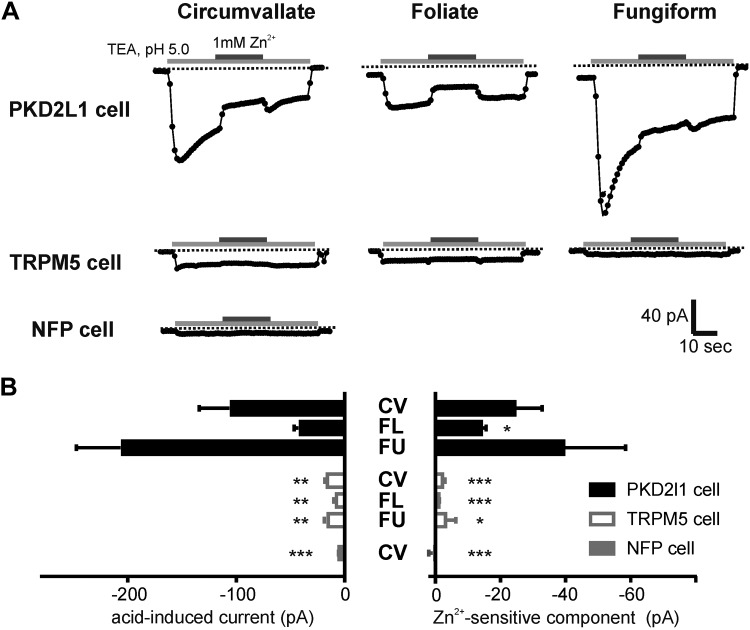
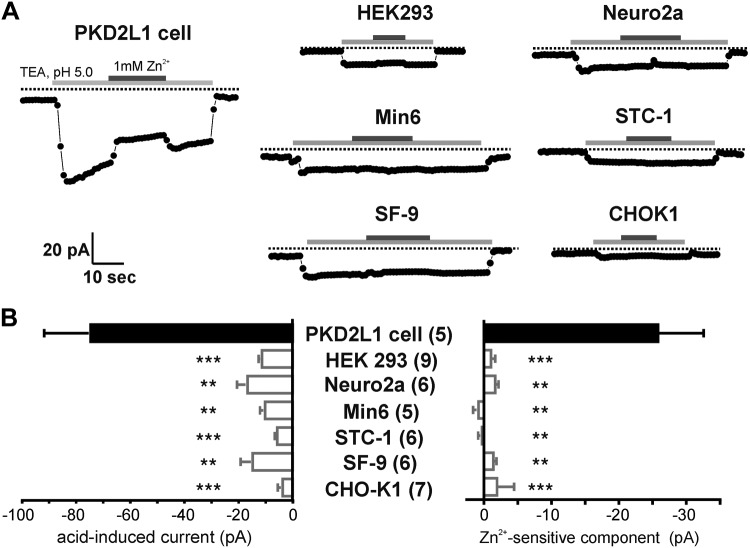
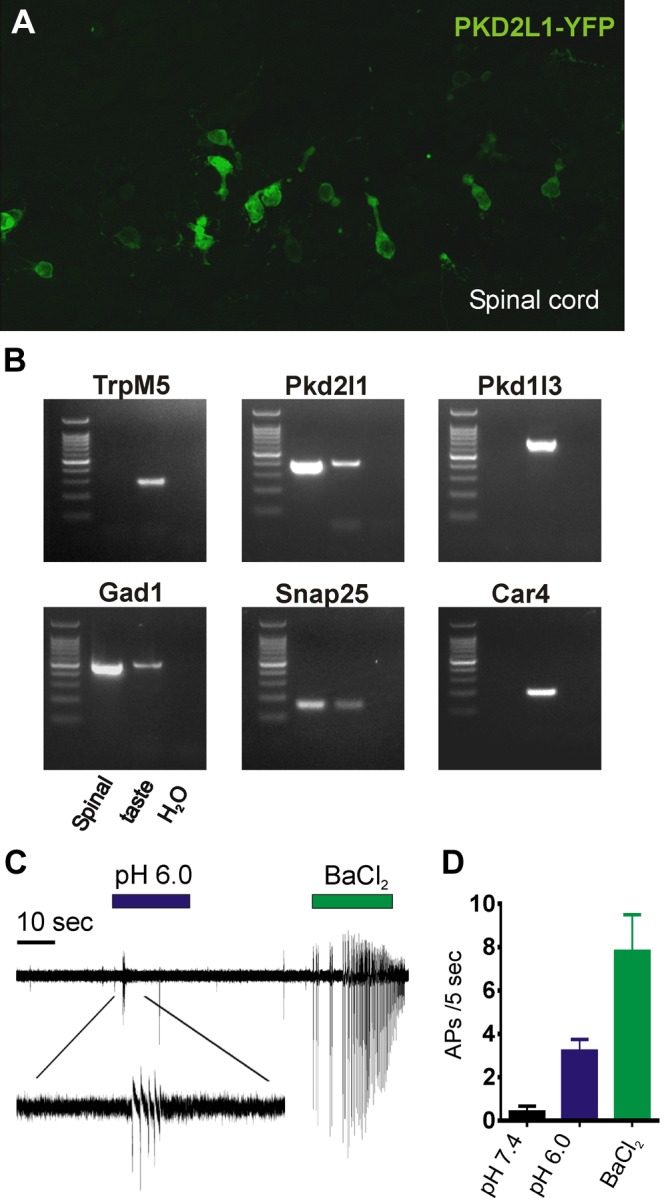
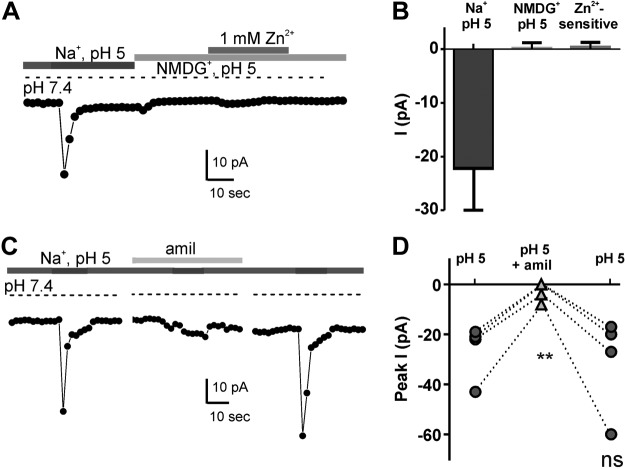
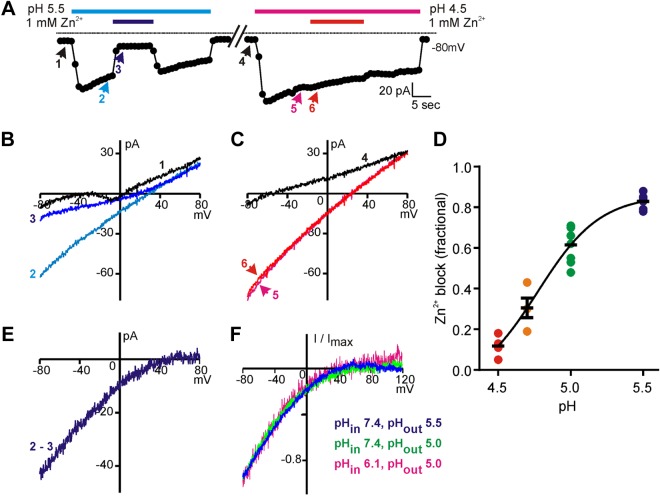
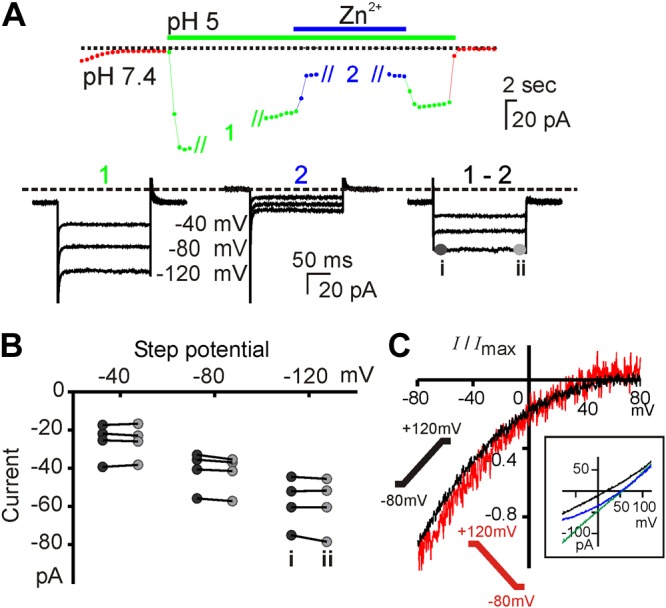
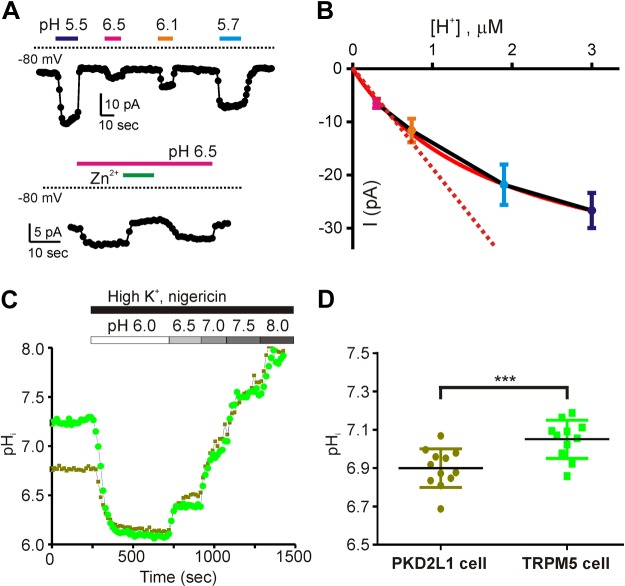
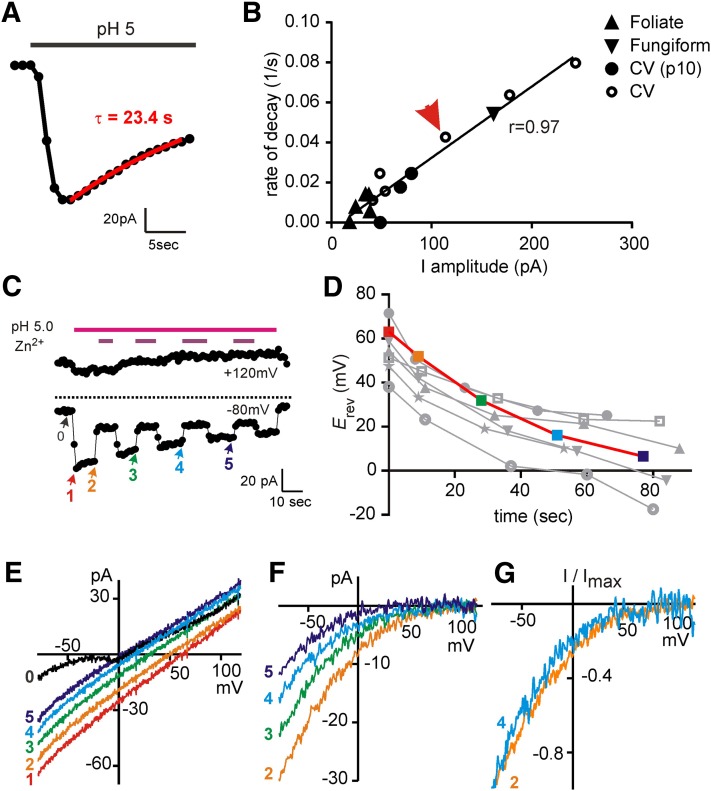
Sour taste is detected by taste receptor cells that respond to acids through yet poorly understood mechanisms. The cells that detect sour express the protein PKD2L1, which is not the sour receptor but nonetheless serves as a useful marker for sour cells. By use of mice in which the PKD2L1 promoter drives expression of yellow fluorescent protein, we previously reported that sour taste cells from circumvallate papillae in the posterior tongue express a proton current. To establish a correlation between this current and sour transduction, we examined its distribution by patch-clamp recording. We find that the current is present in PKD2L1-expressing taste cells from mouse circumvallate, foliate, and fungiform papillae but not in a variety of other cells, including spinal cord neurons that express PKD2L1. We describe biophysical properties of the current, including pH-dependent Zn(2+) inhibition, lack of voltage-dependent gating, and activation at modest pH values (6.5) that elicit action potentials in isolated cells. Consistent with a channel that is constitutively open, the cytosol of sour taste cells is acidified. These data define a functional signature for the taste cell proton current and indicate that its expression is mostly restricted to the subset of taste cells that detect sour.

Keywords: PKD2L1; acid; ion channel; pH; sensory transduction.


Figures

Figure 1.
Figure 1.
PKD2L1 cells from different parts of the tongue fire action potentials in response to acids. A) Confocal image showing the distribution of PKD2L1 cells identified by expression of YFP under the PKD2L1 promoter in each of the major taste fields on the tongue. YFP (green) and TRPM5 (purple) were detected with protein-specific antibodies, and fluorescent images were overlaid onto a differential interference contrast image of the same field (gray). Note that there is no overlap between the 2 populations. B) Action potentials evoked by solutions of varying pH recorded from dissociated PKD2L1 taste cells from the 2 taste fields indicated using the loose patch recording method. Barium (2 mM) was used as a positive control. Each vertical series is from the same cell except for pH 6.7 in foliate was from a different cell than other pHs. C) Summary data of AP frequency in response to acid stimuli; 4 cells were tested for each condition. No significant differences were found between cells from the CV or FL papillae (2-tailed Student's t test).
Figure 2.
Figure 2.
A Zn2+-sensitive inward proton current is found in PKD2L1 cells from each of the taste fields on the tongue. A) Time course of the response to pH 5 solution in whole-cell recording mode from different taste cell types identified either by YFP expressed under the PKD2L1 promoter or GFP expression under the TRPM5 promoter or by the absence of either YFP or GFP (NFP) in a double transgenic animal. Cells were bathed in TEA-based solution at pH 7.4 before the stimulus. The voltage was held at −80 mV and ramped from −80 to +80 mV (1 V/s). Symbols show the current at −80 mV. B) Summary data of peak current and Zn2+-sensitive component. There was no significant difference in the magnitude of the currents in PKD2L1 cells from each taste field (2-tailed Student t test). The Zn2+-sensitive component of the current was smaller in FL taste cells (P < 0.05; 2-tailed Student's t test). Significance for GFP+ and NFP+ cells is by comparison with PKD2L1-expressing cells in the same taste field. *P < 0.05, **P < 0.01, ***P < 0.001 (1-tailed Student's t test).
Figure 3.
Figure 3.
Absence of a proton current in other cell types. A) Response to acidic solutions measured in whole-cell recording from the cell types indicated. Cells were bathed in TEA-based solution at pH 7.4 before the stimulus. The voltage was held at −80 mV and ramped from −80 to +80 mV (1 V/s). Current at −80 mV is plotted. B) Summary data of peak current and zinc-sensitive component. Numbers in parentheses are number of cells recorded. **P < 0.01, ***P < 0.001 compared with PKD2L1 cells using 1-tailed Student's t test.
Figure 4.
Figure 4.
PKD2L1-expressing spinal neurons fire APs to acid. A) Confocal image of the central canal of the spinal cord from a postnatal day 4 PKD2L1-YFP mouse labeled with anti-GFP antibody. B) PCR-based expression analysis of indicated genes in samples from YFP+ spinal cord neurons, taste cDNA, or water control. Note that spinal neurons express Pkd2l1 but not Pkd1l3 or Car4. C) Loose patch recordings of acutely dissociated spinal cord neurons. Solutions are Tyrode’s at the indicated pH or with 2 mM BaCl2. D) Average data from experiments as in B (n = 4). APs were counted for the first 5 s both before the onset of the stimulus (pH 7.4) and after the onset of the stimulus (pH 6.0 or 2 mM BaCl2).
Figure 5.
Figure 5.
Absence of an inward proton current in PKD2L1-expressing spinal cord neurons. A) Whole-cell recording of acid-evoked currents in spinal neurons. Voltage was held at −80 mV and ramped from −80 to +80 mV (1 V/s). Note that the response to pH solution rapidly decays and that no acid-evoked current is observed in the absence of Na+. B) Average data from experiments as in A. Amplitudes measured relative to baseline at pH 7.4 for response to pH 5 with Na or NMDG and relative to NMDG pH 5 for Zn2+-sensitive. n = 4 cells. C) Acid-evoked current in a spinal neuron in the presence and absence of amiloride (amil). D) Data from experiments as in C. Dotted lines connect data points from same cells. **P < 0.01. ns, not significant, paired 2-tailed Student's t test.
Figure 6.
Figure 6.
Zn2+ blocks the proton current in a pH-dependent manner. A) Representative example of the block by 1 mM Zn2+ of current evoked in a PKD2L1 taste cell in response to pH 5.5 and pH 4.5 in TEA-MA–based solution. Note that Zn2+ blocks a larger percentage of the acid-evoked current in pH 5.5 than in pH 4.5. B, C) The I-V relationships measured at the indicated time points from the trace in A. D) The fraction of the acid-evoked currents blocked by 1 mM Zn2+ at each indicated pH; data from all cells is plotted, along with the means ± sem. The data were fit with a dose-response curve with a Hill coefficient of 2.0 and IC50 of pH 4.8. E) The I-V relationship of the Zn2+-blocked component of the proton current in B, obtained by subtracting the current recorded in the presence of Zn2+ from the current recorded in its absence. F) The averaged normalized I-V relationships of the Zn2+-sensitive currents recorded at the pHout and pHin indicated (n = 2–7).
Figure 7.
Figure 7.
Lack of voltage dependence to the activation of the taste cell proton conductance. A) The current (Vm = −80 mV) in a PKD2L1 taste cell evoked in response to pH 5 extracellular solution (green and blue symbols; TEA-based solution). During stimulus applications 1 and 2, the recording protocol was changed to 200 ms voltage steps from a holding potential of 0 mV to voltages shown. Subtraction of 1 – 2 gives the Zn2+-sensitive component of the proton current. B) Summary data of the current amplitude measured at the beginning (i) and end (ii) of each voltage step from 4 cells. Comparison of i and ii for each voltage was not significant using multiple 2-tailed Student's t tests with Sidak-Bonferroni correction. C) The Zn2+-sensitive current evoked by pH 5 solution measured in response to a depolarizing ramp (−80 to +120 mV; 1 V/s) from a holding potential of −80 mV (black) or hyperpolarizing voltage ramp from a holding potential of 0 mV (red) from experiments as in Fig. 6. Average of normalized traces from 4 experiments. Inset) I-V relationship of 1 cell under the reversal ramp in pH 7.4 (black), pH 5 (green), and pH 5 with 1 mM Zn2+ (blue). Note that there was no difference in rectification under the 2 conditions.
Figure 8.
Figure 8.
Proton channels in sour taste cells are open near neutral pH. A) Current evoked in a PKD2L1-YFP taste cell to extracellular acidification (TEA-MA based) from a solution at pH 7.4. The current elicited at pH 6.5 is completely blocked by 1 mM Zn2+. B) Current amplitude plotted against H+ concentration (n = 4 cells). The relationship is linear at low concentrations of protons, but saturates beyond pH 6.0. The red curve shows the fit to a one site binding curve with a Kd of 1.9 μM. C) Time series of cytosolic pH (pHi) for PKD2L1 and TRPM5 taste cells loaded with BCECF-AM in Tyrode’s from which resting values of pHi were measured. High-K+ + 20 μM nigericin (pH 6.0 to pH 8.0 in 0.5 pH unit increments) was used to generate a linear calibration curve from which fluorescent intensities were converted to pHi. D) Scatterplot of resting pHi in Tyrode’s pH 7.4 determined as in C. ***P < 0.001, 1-tailed Student's t test.
Figure 9.
Figure 9.
Time-dependent decay of the proton currents. A) Representative data showing the activation and decay of the proton current in the presence of a steady stimulus. The decay was fit with a monoexponential function with a time constant of 23.4 s. B) Plot of the rate of current decay as a function of current amplitude. Each point represents data from a different cell isolated from the taste field indicated (same cells as in Fig. 2). There is a linear relationship with the correlation coefficient shown. Arrow denotes a representative cell from A. C) The current magnitude as a function of time for a representative cell (TEA-MA–based solution). Zn2+ was added every 20 s to allow leak subtraction. D) The reversal potential of the current elicited as in C with no leak subtraction (n = 7; each symbol represents data from a different cell, with the cell shown in C highlighted in color). E) The unsubtracted I-V relationships from the experiment in C at the time points indicated. Note that Erev is shifted leftward as plotted in D. F) The I-V relationships of the Zn2+-sensitive component of the current at the time points indicated in C. G) The Zn2+-sensitive component of the current at 2 time points, normalized to the current at −80 mV. Note that the rectification properties do not change as a function of time.

Similar articles

Cited by

References

    1. Yarmolinsky D. A., Zuker C. S., Ryba N. J. (2009) Common sense about taste: from mammals to insects. Cell 139, 234–244 - PMC - PubMed
    1. Liman E. R., Zhang Y. V., Montell C. (2014) Peripheral coding of taste. Neuron 81, 984–1000 - PMC - PubMed
    1. Gilbertson T. A., Roper S. D., Kinnamon S. C. (1993) Proton currents through amiloride-sensitive Na+ channels in isolated hamster taste cells: enhancement by vasopressin and cAMP. Neuron 10, 931–942 - PubMed
    1. Ugawa S., Minami Y., Guo W., Saishin Y., Takatsuji K., Yamamoto T., Tohyama M., Shimada S. (1998) Receptor that leaves a sour taste in the mouth. Nature 395, 555–556 - PubMed
    1. Stevens D. R., Seifert R., Bufe B., Müller F., Kremmer E., Gauss R., Meyerhof W., Kaupp U. B., Lindemann B. (2001) Hyperpolarization-activated channels HCN1 and HCN4 mediate responses to sour stimuli. Nature 413, 631–635 - PubMed

Publication types

MeSH terms