. 2015 Jul;73(5):ftv025.
doi: 10.1093/femspd/ftv025. Epub 2015 Apr 9.

Development and evaluation of murine lung-specific disease models for Pseudomonas aeruginosa applicable to therapeutic testing

Affiliations

Development and evaluation of murine lung-specific disease models for Pseudomonas aeruginosa applicable to therapeutic testing

Matthew B Lawrenz et al. Pathog Dis. 2015 Jul.

Abstract

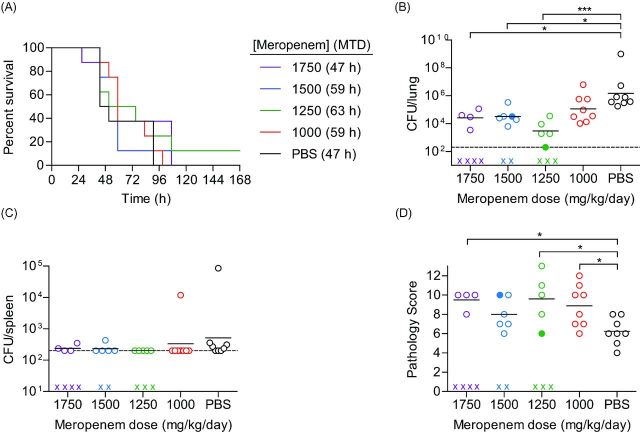
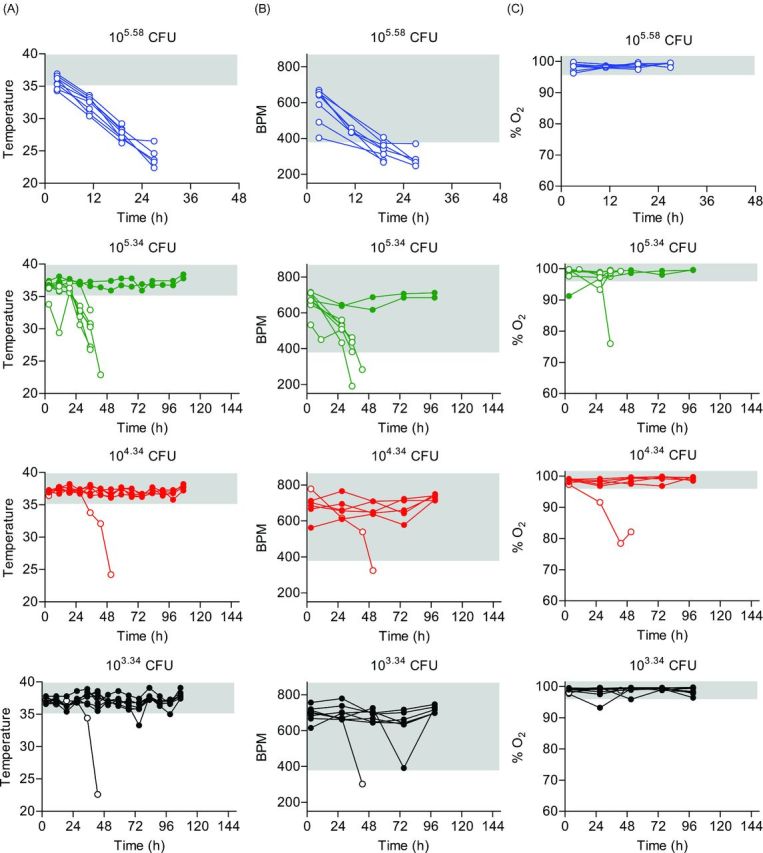
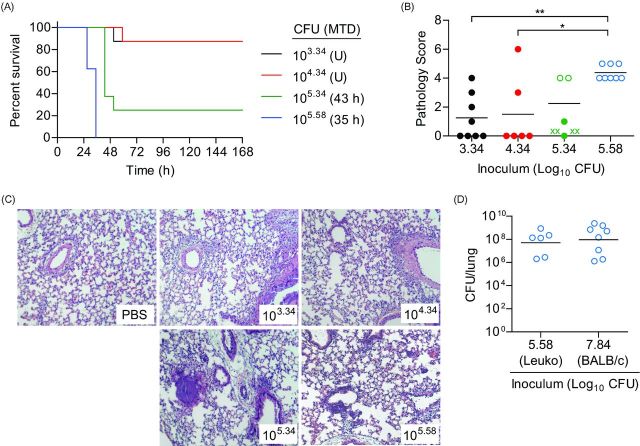
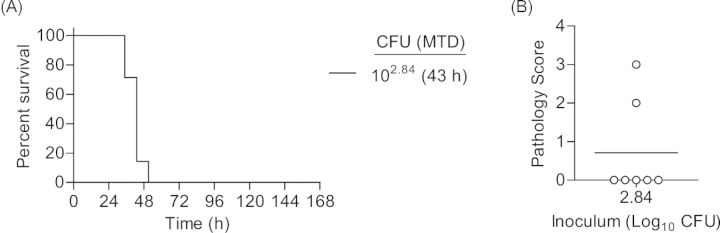
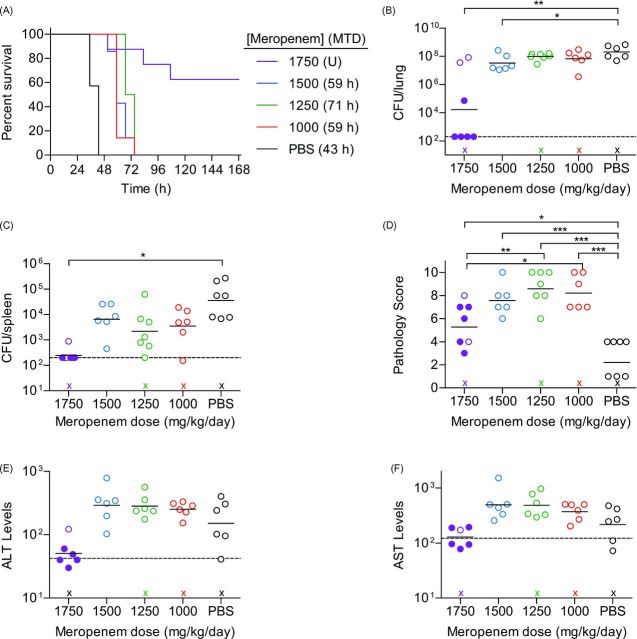
Pseudomonas aeruginosa is an opportunistic bacterial pathogen capable of causing a wide range of disease manifestations, including severe bacterial pneumonia. Recently, clinics have reported a rise in nosocomial infections with multidrug resistant (MDR) species, including MDR strains of P. aeruginosa. In order to quickly evaluate the efficacy of new therapeutics for MDR infections, highly reproducible and validated animal models need to be developed for pre-clinical testing. Here, we describe the characterization of two murine models to study MDR P. aeruginosa respiratory disease. We evaluated and compared these models using a non-invasive intratracheal instillation method and established the 50% lethal dose, course of infection, biometric parameters of disease and degree of pneumonia development for each model. Further, we tested meropenem as a proof-of-concept therapeutic and report efficacy data that suggests that the leukopenic model could serve a robust pre-clinical model to test novel therapeutics.

Keywords: MDR Pseudomonas aeruginosa; biometric endpoint criteria; intubation-mediated intratracheal (IMIT) inoculation; murine respiratory disease; therapeutic model.


Figures

Graphical Abstract Figure.
This article describes the development of a respiratory disease model for the testing of therapeutics against multidrug resistant Pseudomonas aeruginosa.
Figure 1.
Figure 1.
Biometrics of immunocompetent mice during P. aeruginosa UNC-D infection. BALB/c mice (n = 8) were inoculated with 107.84 (blue), 107.59 (green), 107.34 (red) or 107.09 (black) CFU of P. aeruginosa UNC-D via IMIT, and (A) temperature, (B) heart rate (BPM) and (C) concentration of blood oxygen (% O2) were monitored for 144 h. Each line represents an individual animal. Solid color symbols represent animals that survived the entire course of infection. Open symbols represent animals that succumbed to infection. The gray shaded area represents the mean ±3 standard deviations of the baseline values for each biometric. Data are representative of two independent experiments.
Figure 2.
Figure 2.
Susceptibility of immunocompetent mice to P. aeruginosa UNC-D respiratory challenge. BALB/c mice (n = 8) were challenged with 107.84 (blue), 107.59 (green), 107.34 (red) or 107.09 (black) CFU of P. aeruginosa UNC-D via IMIT and (A) monitored for survival. MTD indicated in parenthesis; U = undefined. (B) At the time of euthanasia, lungs were harvested and severity of lung pathology was scored (ANOVA with Tukey: * = P < 0.05; *** = P < 0.001). Solid circles represent animals that survived the entire course of infection. Open circles represent moribund animals that were euthanized. Bar represents the mean. (C) Comparison of lung pathology between animals that met euthanasia criteria [E, open circles] or survived [S, solid circles] to the end of the study (Unpaired student's t-test: ***P < 0.001). (D) Representative lungs (H&E stain) from each group. Data are representative of two independent experiments.
Figure 3.
Figure 3.
Susceptibility of BALB/c mice to P. aeruginosa PA01 respiratory challenge. BALB/c mice (n = 8) were infected with 107.08 (red) or 106.09 (black) CFU of P. aeruginosa PA01 and (A) monitored for survival. MTD indicated in parenthesis; U = undefined. The LD50 was calculated by the method of Reed and Muench to be 106.59 CFU. (B) At the time of euthanasia, lungs were harvest and pathology was determined. Solid circles represent animals that survived the entire course of infection and open cirlces represent moribund animals that were euthanized. Bar represents the mean.
Figure 4.
Figure 4.
Efficacy of meropenem in immunocompetent mice challenged with P. aeruginosa UNC-D. BALB/c mice (n = 8) were challenged with 108.4 CFU of UNC-D and mock treated (PBS, black) or treated with meropenem beginning 3 h post-infection with 1750 (violet), 1500 (blue), 1250 (green) or 1000 (red) mg/kg/day and (A) monitored for survival. MTD indicated in parenthesis. At the time of euthanasia, tissues were harvest and bacteria were enumerated from the (B) lungs and (C) spleen (One-way ANOVA with Tukey: * = P < 0.05; *** = P < 0.001). (D) Severity of lung pathology at the time of euthanasia (Unpaired Student's t-test: * = P < 0.05). (B–D) Solid circles represent animals that survived the entire course of infection. Open circles represent moribund animals that were euthanized. X represents animals that succumbed to infection and tissues were not harvested. Bar represents the mean. Dotted line represents the limit of detection. Data are representative of two independent experiments.
Figure 5.
Figure 5.
Biometrics of leukopenic mice during P. aeruginosa UNC-D infection. Cy-treated BALB/c mice (n = 8) were inoculated with 105.58 (blue), 105.34 (green), 104.34 (red) or 103.34 (black) CFU of P. aeruginosa UNC-D via IMIT and (A) temperature, (B) heart rate (BPM) and (C) concentration of blood oxygen (% O2) were monitored for 144 h. Each line represents an individual animal. Solid circles represent animals that survived the entire course of infection. Open circles represent animals that succumbed to infection. The gray shaded area represents the mean ±3 standard deviations of the baseline values for each biometric. Data are representative of two independent experiments.
Figure 6.
Figure 6.
Susceptibility of leukopenic mice to P. aeruginosa UNC-D respiratory challenge. Cy-treated BALB/c mice (n = 8) were inoculated with 105.58 (blue), 105.34 (green), 104.34 (red) or 103.34 (black) CFU of P. aeruginosa UNC-D via IMIT and (A) monitored for survival. MTD indicated in parenthesis; U = undefined. (B) At the time of euthanasia, lungs were harvested and severity of lung pathology was scored (ANOVA with Tukey: * = P < 0.05; ** = P < 0.01). Solid circles represent animals that survived the entire course of infection. Open circles represent moribund animals that were euthanized. X represents animals that succumbed to infection and tissues were not harvested. Bar represents the mean. (C) Representative lungs (H&E stain) from each group. (D) Comparison of endpoint lung bacterial burden of leukopenic (Leuko) and immunocompetent (BALB/c) receiving an ∼LD100 of UNC-D (105.58 and 107.84 CFU, respectively). Data are representative of two independent experiments.
Figure 7.
Figure 7.
Susceptibility of BALB/c mice to P. aeruginosa PA01 respiratory challenge. Cy-treated BALB/c mice (n = 8) were challenged with 102.84 CFU of P. aeruginosa PA01 and (A) monitored for survival. MTD indicated in parenthesis. (B) At the time of euthanasia, lungs were harvest and pathology was determined. Open circles represent moribund animals that were euthanized. Bar represents the mean.
Figure 8.
Figure 8.
Efficacy of meropenem in leukopenic mice challenged with P. aeruginosa UNC-D. Cy-treated BALB/c mice (n = 8) were challenged with 105.4 CFU of UNC-D and mock treated (PBS, black) or treated with meropenem beginning 3 h post-infection with 1750 (violet), 1500 (blue), 1250 (green) or 1000 (red) mg/kg/day and (A) monitored for survival. MTD indicated in parenthesis; U = undefined. At the time of euthanasia, tissues were harvest and bacteria were enumerated from the (B) lungs and (C) spleen. Dotted line represents the limit of detection. (D) Severity of lung pathology at the time of euthanasia. Clinical chemistries were performed on blood to evaluate (E) ALT or (F) AST markers of liver damage, with baseline enzyme values indicated by a horizontal dashed line. (B–F) Solid circles represent animals that survived the entire course of infection. Open circles represent moribund animals that were euthanized. X represents animals that succumbed to infection and tissues were not harvested. Bar represents the mean. (One-way ANOVA with Tukey: * = P < 0.05; ** = P < 0.01; *** = P < 0.001). Data are representative of two independent experiments.

References

    1. Abdi-Ali A, Mohammadi-Mehr M, Agha Alaei Y. Bactericidal activity of various antibiotics against biofilm-producing Pseudomonas aeruginosa. Int J Antimicrob Ag. 2006;27:196–200. - PubMed
    1. Biswal I, Arora BS, Kasana D, et al. Incidence of multidrug resistant Pseudomonas aeruginosa isolated from burn patients and environment of teaching institution. J Clin Diagn Res. 2014;8:DC26–9. - PMC - PubMed
    1. Bonifacio SL, Kitterman JA, Ursell PC. Pseudomonas pneumonia in infants: an autopsy study. Hum Pathol. 2003;34:929–38. - PubMed
    1. Carmeli Y, Troillet N, Eliopoulos GM, et al. Emergence of antibiotic-resistant Pseudomonas aeruginosa: comparison of risks associated with different antipseudomonal agents. Antimicrob Agents Ch. 1999;43:1379–82. - PMC - PubMed
    1. Center for Drug Evaluation and Research (CDER) Guidance for Industry Estimating the Maximum Safe Starting Dose in Initial Clinical Trials for Therapeutics in Adult Healthy Volunteers. Rockville, MD: Food and Drug Administration; 2005.

Publication types

MeSH terms