. 2015 Apr 10:6:6771.
doi: 10.1038/ncomms7771.

Roles of lymphatic endothelial cells expressing peripheral tissue antigens in CD4 T-cell tolerance induction

Affiliations

Roles of lymphatic endothelial cells expressing peripheral tissue antigens in CD4 T-cell tolerance induction

Sherin J Rouhani et al. Nat Commun. .

Abstract

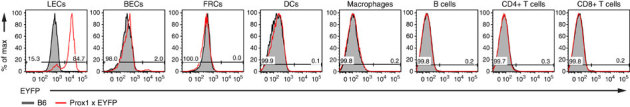
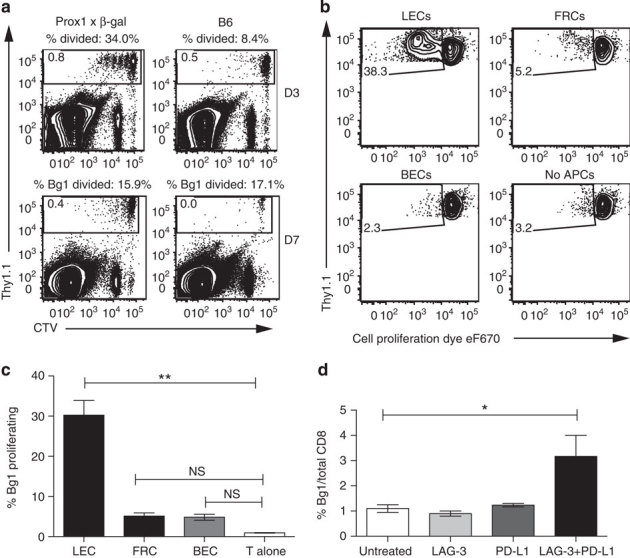
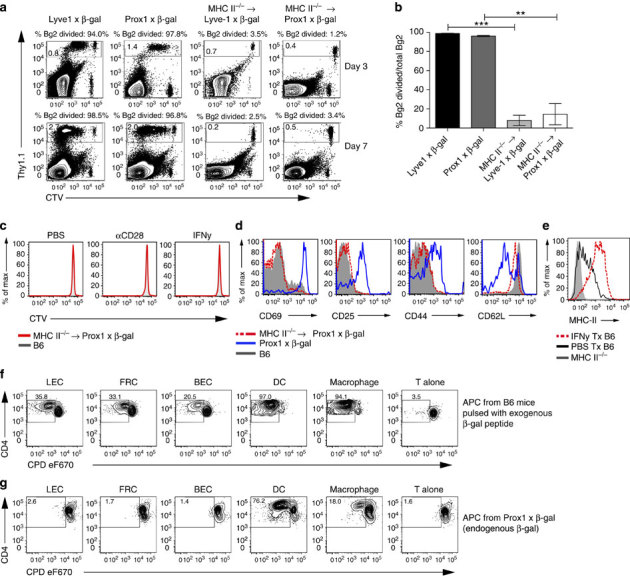
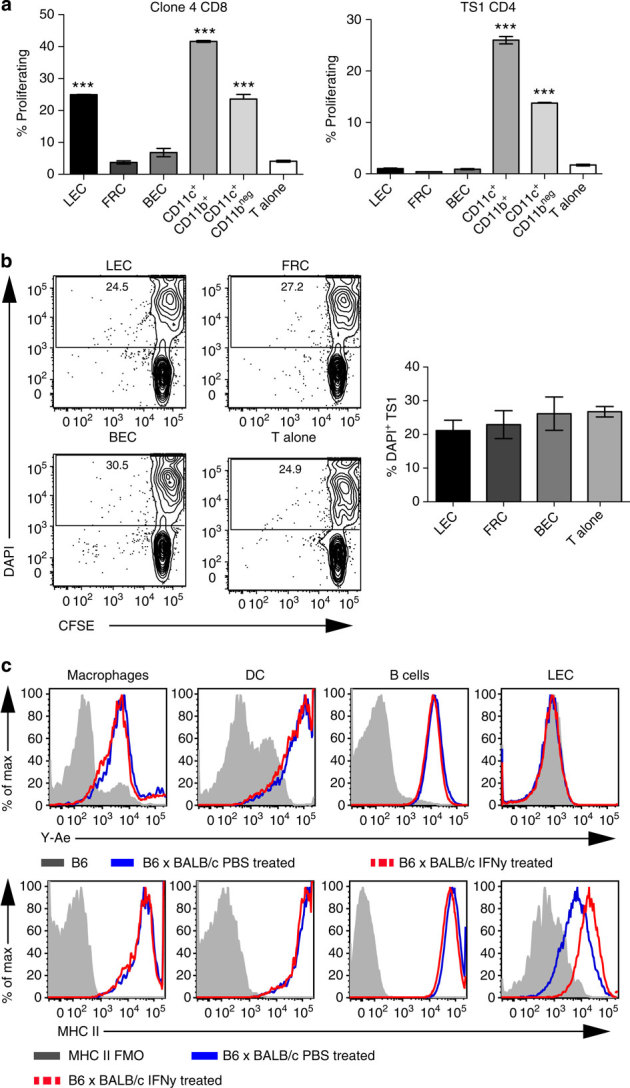
Lymphatic endothelial cells (LECs) directly express peripheral tissue antigens and induce CD8 T-cell deletional tolerance. LECs express MHC-II molecules, suggesting they might also tolerize CD4 T cells. We demonstrate that when β-galactosidase (β-gal) is expressed in LECs, β-gal-specific CD8 T cells undergo deletion via the PD-1/PD-L1 and LAG-3/MHC-II pathways. In contrast, LECs do not present endogenous β-gal in the context of MHC-II molecules to β-gal-specific CD4 T cells. Lack of presentation is independent of antigen localization, as membrane-bound haemagglutinin and I-Eα are also not presented by MHC-II molecules. LECs express invariant chain and cathepsin L, but not H2-M, suggesting that they cannot load endogenous antigenic peptides onto MHC-II molecules. Importantly, LECs transfer β-gal to dendritic cells, which subsequently present it to induce CD4 T-cell anergy. Therefore, LECs serve as an antigen reservoir for CD4 T-cell tolerance, and MHC-II molecules on LECs are used to induce CD8 T-cell tolerance via LAG-3.


Conflict of interest statement

The authors declare no conflict of interest.

Figures

Figure 1
Figure 1. LN-LECs endogenously express intermediate levels of MHC-II.
(a) Pooled LNs and diaphragms from B6 or MHC-II−/− mice were enzymatically digested. LECs (DAPInegCD45negCD31+gp38+), BECs (DAPInegCD45negCD31+gp38neg), FRCs (DAPInegCD45negCD31neggp38+), macrophages (DAPInegCD11cneg/lowCD11b+F4/80+) and B cells (DAPInegCD19+CD11cnegCD11bneg) were stained extracellularly for MHC-II, and gMFI was calculated. Data representative of at least three experiments with LN pooled from 1 to 2 mice. (b) B cells (DAPInegCD19+), macrophages (DAPInegCD11cneg/lowCD11b+), LECs (DAPInegCD45negCD31+gp38+), FRCs (DAPInegCD45negCD31neggp38+) and BECs (DAPInegCD45negCD31+gp38neg) from B6 mice were sorted by flow cytometry, and cultured 3T3 cells were harvested. Quantitative PCR for I-Ab was performed. Data shown from 2 to 3 independent experiments with LN pooled from 4 to 5 mice. (ce) Pooled LNs from B6, MHC-II−/−, CD45.1→MHC-II−/− or MHC-II−/−→CD45.1 mice were digested and stained extracellularly for MHC-II expression on LECs. Numbers in c represent gMFI. Representative data (c,d) or cumulative data (e) from 2 to 4 experiments with 1–2 mice each are shown. Groups compared using a one-way analysis of variance with Tukey post-test. *P<0.05; **P<0.01; ***P<0.001, NS=not significant. All data shown as mean±s.e.m.
Figure 2
Figure 2. Prox1-creERT2 is active in LECs but not other LNSCs or haematopoietically derived cells.
Prox1-CreERT2 x EYFPstop-flox (Prox1xEYFP) mice were maintained on tamoxifen chow for 2 weeks. Pooled inguinal, axillary and brachial LNs from B6 or Prox1xEYFP mice were enzymatically digested and EYFP expression in LECs (DAPInegCD45negCD31+gp38+), BECs (DAPInegCD45negCD31+gp38neg), FRCs (DAPInegCD45negCD31neggp38+), DCs (DAPInegCD11chigh), macrophages (DAPInegCD11cneg/lowCD11b+), B cells (DAPInegCD19+), CD4 T cells (DAPInegCD4+CD19neg) and CD8 T cells (DAPInegCD8+ CD19neg) was analysed by flow cytometry. Numbers refer to the percent of EYFP+ cells in the Prox1xEYFP mice. Data representative of two independent experiments with 1–2 mice each.
Figure 3
Figure 3. LECs induce deletion of β-gal-specific CD8 T cells via the PD-1/PD-L1 and LAG-3/MHC-II pathways.
(a) CTV-labelled Thy1.1+ Bg1 cells were adoptively transferred along with CTV-labelled Thy1.1neg cells as an injection control. Skin-draining LNs were analysed for Bg1 proliferation 3 or 7 days later. Plots are gated on total CD8+ T cells. Data representative of 2–3 experiments with 1-3 mice each. LNSCs from Prox1xβ-gal (b) or Lyve-1xβ-gal (c) mice were sorted and co-cultured with Thy1.1+ Bg1 T cells for 4 days. Plots are gated on CD8+Thy1.1+ Bg1 cells. Data representative of 2–3 experiments with LNs pooled from 4 to 9 mice. Each group was compared with T cells only using a one-way analysis of variance (ANOVA) with Bonferroni post-test. (d) CTV-labelled Thy1.1+ Bg1 cells were adoptively transferred along with CTV-labelled Thy1.1neg cells as an injection control. Mice were treated with blocking antibodies as described in Methods. Skin-draining LNs were analysed for Bg1 proliferation 7 days later. Data representative of 2 experiments with 1–2 mice each. Treatment groups were compared with untreated group using a one-way ANOVA with Bonferroni post-test. *P<0.05; **P<0.01; NS=not significant. All data shown as mean±s.e.m.
Figure 4
Figure 4. LECs do not present endogenous β-gal on MHC-II.
(a) Representative and (b) cumulative data of CTV-labelled Thy1.1+ Bg2 cells adoptively transferred into the indicated recipients. CTV-labelled Thy1.1neg cells were co-transferred as an injection control. Skin-draining LNs were analysed 3 (a) or 7 (a,b) days later, and plots are gated on CD4+ T cells. Data representative of 1–3 experiments with 1–4 mice each. Indicated groups were compared using a one-way analysis of variance (ANOVA) with Bonferroni post-test. (c) CTV-labelled Bg2 cells were adoptively transferred into B6 and MHC-II−/−→Prox1xβ-gal mice treated with PBS, αCD28 or IFN-γ, and proliferation was analysed 3 days later. Plots are gated on Thy1.1+CD4+ cells. Data representative of 2 experiments with 2 mice each. (d) CTV-labelled Thy1.1+ Bg2 cells were transferred into the indicated recipients and activation markers were analysed 16 h later. Plots are gated on Thy1.1+CD4+ cells. Data from one experiment. (e) LNs from MHC-II−/− and PBS- or IFN-γ-treated B6 mice were enzymatically digested 24 h after treatment, and MHC-II on LECs was analysed by flow cytometry. Data representative of 3 experiments with 1–2 mice each. (f) LNSCs, DCs and macrophages from B6 mice were sorted by flow cytometry, pulsed with 50 μM Bg2 peptide for 3 h, washed and co-cultured with CPD eF670-labelled Thy1.1+ Bg2 T cells for 4 days. (g) LNSCs, DCs and macrophages from Prox1xβ-gal mice were sorted by flow cytometry and co-cultured with CPD eF670-labelled Thy1.1+ Bg2 T cells for 4 days. (f,g) Plots are gated on DAPInegCD4+ Thy1.1+ cells. Data representative of 2 experiments with pooled LNs from 5 to 9 mice. All data shown as mean±s.e.m.
Figure 5
Figure 5. LECs do not present MHC-II peptides from the membrane proteins HA and I-Eα.
(a,b) LNSCs and DCs from Prox1xHA mice were sorted by flow cytometry and co-cultured with CFSE-labelled Thy1.1+ Clone 4 CD8 cells (left) or TS1 CD4 cells (right) for 4 days, and the percent of T cells proliferating was calculated. Each group was compared with T cells alone using a one-way analysis of variance (ANOVA) with Bonferroni post-test. ***P<0.001. Data representative of 2 experiments with LN pooled from 8 mice. (b) The percent of DAPI+ TS1 cells from the co-culture in a was calculated. Plots are gated on CD4+Thy1.1+ TS1 cells. No significant differences were seen when each group was compared with T cells alone using a one-way ANOVA with Bonferroni post-test. (c) LNs from PBS- or IFN-γ-treated B6 or (B6 x BALB/c) F1 mice were enzymatically digested, and extracellular I-Ab:I-Eα peptide complex expression (top) or MHC-II levels (bottom) were analysed on the indicated populations by flow cytometry. Data representative of 2–3 experiments with 1–3 mice. All data shown as mean±s.e.m.
Figure 6
Figure 6. LECs express Ii and cathepsin L, but do not express the peptide editor H2-M.
(a) B6 LECs (DAPInegCD45negCD31+10.1.1+) and B cells (DAPInegCD19+) were stained intracellularly for Ii and MHC-II or isotype control. The LEC-specific marker 10.1.1 (refs 10, 12) was used instead of gp38 since 10.1.1 is compatible with intracellular staining protocols. (b) LNs were enzymatically digested, depleted of CD45+ cells, stained with 10.1.1 (cyan) extracellularly and cathepsin L (white), LAMP1 (magenta) and DAPI (blue) intracellularly before being cytospun onto slides. Scale bar, 5 μm. (c). LECs and B cells were stained for MHC-II and H2-Mαβ2 intracellularly. (d) LECs, DCs and B cells from B6 mice were sorted by flow cytometry, and 3T3 cells were harvested from culture as in Fig. 1. mRNA was purified and quantitative PCR was performed for the indicated genes. LECs were compared with the other groups using a one-way analysis of variance (ANOVA) with Bonferroni post-test. *P<0.05; **P<0.01; ***P<0.001. (e) LECs and B cells from B6 or MHC-II−/− (negative control) mice were stained extracellularly for I-Ab:CLIP complexes and MHC-II. Data in ac, e are representative of at least 2 experiments with 1–2 mice each, and data in d is from 2 experiments with LN pooled from 4 to 5 mice. All data shown as mean±s.e.m.
Figure 7
Figure 7. Haematopoietically derived cells acquire β-gal from LECs and induce Bg2 anergy.
(a) CTV-labelled Thy1.1+ Bg2 cells were transferred into the indicated recipients, along with CTV-labelled Thy1.1neg cells as an injection control. Proliferation in skin-draining LNs was measured 7 days later. Data representative of 1–2 experiments with 2–5 mice each. (b) CTV-labelled Thy1.1+ Bg2 cells were transferred into the indicated recipients, and Treg development was measured 3 days later. Data representative of 2 experiments with 2–3 mice each. (c) Experimental design to measure tolerance induction. CTV-labelled CD25negThy1.1+ Bg2 CD4 T cells were adoptively transferred, and recipient mice were challenged 28 days later with peptide-pulsed BMDCs. Proliferation was measured 5 days later by Ki67 upregulation, and FoxP3 and CD25 were measured to assess Treg formation. (d) Representative and (e) cumulative data gated on CD4+Thy1.1+ Bg2 cells from skin-draining LN from 2 experiments with 1–7 mice each. *P<0.05; **P<0.01; ***P<0.001, NS=not significant. Indicated comparisons were made using a one-way analysis of variance with Bonferroni post-test. All data shown as mean±s.e.m.

References

    1. Hinterberger M. et al. Autonomous role of medullary thymic epithelial cells in central CD4(+) T cell tolerance. Nat. Immunol. 11, 512–519 (2010) . - PubMed
    1. Ramsdell F. & Fowlkes B. J. Clonal deletion versus clonal anergy: the role of the thymus in inducing self tolerance. Science 248, 1342–1348 (1990) . - PubMed
    1. Bonasio R. et al. Clonal deletion of thymocytes by circulating dendritic cells homing to the thymus. Nat. Immunol. 7, 1092–1100 (2006) . - PubMed
    1. Baba T., Nakamoto Y. & Mukaida N. Crucial contribution of thymic Sirp alpha+ conventional dendritic cells to central tolerance against blood-borne antigens in a CCR2-dependent manner. J. Immunol. 183, 3053–3063 (2009) . - PubMed
    1. Derbinski J., Schulte A., Kyewski B. & Klein L. Promiscuous gene expression in medullary thymic epithelial cells mirrors the peripheral self. Nat. Immunol. 2, 1032–1039 (2001) . - PubMed

Publication types

MeSH terms