. 2015 Oct;230(10):2552-78.
doi: 10.1002/jcp.25014.

GRP78/Dna K Is a Target for Nexavar/Stivarga/Votrient in the Treatment of Human Malignancies, Viral Infections and Bacterial Diseases

Affiliations

GRP78/Dna K Is a Target for Nexavar/Stivarga/Votrient in the Treatment of Human Malignancies, Viral Infections and Bacterial Diseases

Jane L Roberts et al. J Cell Physiol. 2015 Oct.

Abstract

Prior tumor cell studies have shown that the drugs sorafenib (Nexavar) and regorafenib (Stivarga) reduce expression of the chaperone GRP78. Sorafenib/regorafenib and the multi-kinase inhibitor pazopanib (Votrient) interacted with sildenafil (Viagra) to further rapidly reduce GRP78 levels in eukaryotes and as single agents to reduce Dna K levels in prokaryotes. Similar data were obtained in tumor cells in vitro and in drug-treated mice for: HSP70, mitochondrial HSP70, HSP60, HSP56, HSP40, HSP10, and cyclophilin A. Prolonged 'rafenib/sildenafil treatment killed tumor cells and also rapidly decreased the expression of: the drug efflux pumps ABCB1 and ABCG2; and NPC1 and NTCP, receptors for Ebola/Hepatitis A and B viruses, respectively. Pre-treatment with the 'Rafenib/sildenafil combination reduced expression of the Coxsackie and Adenovirus receptor in parallel with it also reducing the ability of a serotype 5 Adenovirus or Coxsackie virus B4 to infect and to reproduce. Sorafenib/pazopanib and sildenafil was much more potent than sorafenib/pazopanib as single agents at preventing Adenovirus, Mumps, Chikungunya, Dengue, Rabies, West Nile, Yellow Fever, and Enterovirus 71 infection and reproduction. 'Rafenib drugs/pazopanib as single agents killed laboratory generated antibiotic resistant E. coli which was associated with reduced Dna K and Rec A expression. Marginally toxic doses of 'Rafenib drugs/pazopanib restored antibiotic sensitivity in pan-antibiotic resistant bacteria including multiple strains of blakpc Klebsiella pneumoniae. Thus, Dna K is an antibiotic target for sorafenib, and inhibition of GRP78/Dna K has therapeutic utility for cancer and for bacterial and viral infections.


Figures

Figure 1
Figure 1
Regulation of chaperone expression and function by [sorafenib + sildenafil] or [regorafenib + sildenafil]. A: HEK293 cells were treated with vehicle; sorafenib (1.5 μM); regorafenib (0.5 μM); sildenafil (2 μM) or the drugs combined for the indicated amounts of time (2–6 h). At each time point cells were fixed in place and permeabilized with Triton X100. Immuno‐fluorescence at 10× magnification was performed to determine the expression of GRP78. B: HEK293 cells were treated with vehicle; sorafenib (1.5 μM); regorafenib (0.5 μM); sildenafil (2 μM) or the drugs combined for 6 h. At each time point cells were fixed in place and permeabilized with Triton X100. Immuno‐fluorescence at 10× magnification was performed to determine the expression of GRP94, HSP70 and HSP90. C: GBM14 glioblastoma cells were treated with vehicle; sorafenib (1.5 μM); sildenafil (2 μM) or the drugs combined for the indicated amounts of time (2–6 h). At each time point cells were fixed in place and permeabilized with Triton X100. Immuno‐fluorescence at 10× magnification was performed to determine the expression of GRP78. D: GBM14 and HEK293 cells were either transfected with a scrambled siRNA (siSCR) or were transfected with siRNA molecules to knock down the expression of GRP78, ABCB1, and ABCG2. In parallel studies, cells were transfected with either empty vector plasmid (CMV) or a plasmid to over‐express GRP78. Twenty‐four hours after transfection cells were fixed in place and permeabilized with Triton X100. Immuno‐fluorescence at 10× magnification was performed to determine the expression of GRP78, ABCB1, and ABCG2.
Figure 2
Figure 2
Drug combinations modulate chaperone expression in parental and stem cell like GBM variants. A–D: GBM tumor cells (parental and stem like derived) were treated with vehicle; OSU‐03012 (1 μM); sorafenib (1.5 μM); regorafenib (0.5 μM); sildenafil (2 μM) or the drugs combined for 6 h. Cells were fixed in place and permeabilized with Triton X100. Immuno‐fluorescence at 10× magnification was performed to determine the expression of HSP70, HSP90, and GRP78.
Figure 3
Figure 3
Drug combinations reduce ABCB1 and ABCG2 expression in GBM stem cells. GBM tumor cells (parental and stem like derived) were treated with vehicle; OSU‐03012 (1 μM); sorafenib (1.5 μM); regorafenib (0.5 μM); sildenafil (2 μM) or the drugs combined for 6 h. Cells were fixed in place and permeabilized with Triton X100. Immuno‐fluorescence at 10× magnification was performed to determine the expression of ABCB1 and ABCG2.
Figure 4
Figure 4
[Sorafenib + sildenafil] kills parental and stem cell‐like GBM cells. Parental and stem cell‐derived variants of GBM5/6/12/14 cells were treated with vehicle; sorafenib (1.5 μM); sildenafil (2 μM) or the drugs combined for 24 h. Cells were then visualized under the FITC and rhodamine filters to determine the numbers of viable (green) and dead (yellow + red) cells (n = 3 ± SEM). Stem cells are 95–100% dead whereas very little killing is observed in parental GBM cells.
Figure 5
Figure 5
Drug combinations modulate the expression of mitochondrial chaperones and mitochondrial proteins. GBM tumor cells (parental) were treated with vehicle; OSU‐03012 (1 μM); sorafenib (1.5 μM); regorafenib (0.5 μM); sildenafil (2 μM) or the drugs combined for 6 h. Cells were fixed in place and permeabilized with Triton X100. Immuno‐fluorescence at 10× magnification was performed to determine the expression of mitochondrial HSP70 (mtHSP70), HSP60, HSP56, HSP10, Frataxin, CyPA, CyPB.
Figure 6
Figure 6
The cellular distribution of GRP78 and HSP90. A: GBM14 tumor cells (parental) were treated with vehicle for 6 h. Cells were fixed in place and permeabilized with Triton X100. Immuno‐fluorescence was performed to determine the distribution of GRP78 determined at 60X. B: GBM tumor cells (parental) were treated with vehicle; sorafenib (1.5 μM); sildenafil (2 μM) or the drugs combined for 6 h. Cells were fixed in place and permeabilized with Triton X100. Immuno‐fluorescence was performed to determine the distribution of GRP78 determined at 60×. C: GBM14 tumor cells (parental) were treated with vehicle for 6 h. Cells were fixed in place and permeabilized with Triton X100. Immuno‐fluorescence was performed to determine the distribution of HSP90 determined at 60×. D: GBM tumor cells (parental) were treated with vehicle; sorafenib (1.5 μM); sildenafil (2 μM) or the drugs combined for 6 h. Cells were fixed in place and permeabilized with Triton X100. Immuno‐fluorescence was performed to determine the distribution of HSP90 determined at 60×.
Figure 7
Figure 7
The cellular distribution of HSP70 and mitochondrial HSP70. A: GBM14 tumor cells (parental) were treated with vehicle for 6 h. Cells were fixed in place and permeabilized with Triton X100. Immuno‐fluorescence was performed to determine the distribution of HSP70 determined at 60×. B: GBM14 tumor cells (parental) were treated with vehicle; sorafenib (1.5 μM); sildenafil (2 μM) or the drugs combined for 6 h. Cells were fixed in place and permeabilized with Triton X100. Immuno‐fluorescence was performed to determine the distribution of HSP70 determined at 60×. C: GBM14 tumor cells (parental) were treated with vehicle for 6 h. Cells were fixed in place and permeabilized with Triton X100. Immuno‐fluorescence was performed to determine the distribution of mitochondrial HSP70 determined at 60×. D: GBM tumor cells (parental) were treated with vehicle; sorafenib (1.5 μM); sildenafil (2 μM) or the drugs combined for 6 h. Cells were fixed in place and permeabilized with Triton X100. Immuno‐fluorescence was performed to determine the distribution of mitochondrial HSP70 determined at 60×.
Figure 8
Figure 8
The cellular distribution of HSP60 and HSP40. A: GBM14 tumor cells (parental) were treated with vehicle for 6 h. Cells were fixed in place and permeabilized with Triton X100. Immuno‐fluorescence was performed to determine the distribution of HSP60 determined at 60×. B: GBM tumor cells (parental) were treated with vehicle; sorafenib (1.5 μM); sildenafil (2 μM) or the drugs combined for 6 h. Cells were fixed in place and permeabilized with Triton X100. Immuno‐fluorescence was performed to determine the distribution of HSP60 determined at 60×. C: GBM14 tumor cells (parental) were treated with vehicle for 6 h. Cells were fixed in place and permeabilized with Triton X100. Immuno‐fluorescence was performed to determine the distribution of HSP40 determined at 60×. D: GBM tumor cells (parental) were treated with vehicle; sorafenib (1.5 μM); sildenafil (2 μM) or the drugs combined for 6 h. Cells were fixed in place and permeabilized with Triton X100. Immuno‐fluorescence was performed to determine the distribution of HSP40 determined at 60×.
Figure 9
Figure 9
The cellular distribution of HSP10 and Frataxin. A: GBM14 tumor cells (parental) were treated with vehicle for 6 h. Cells were fixed in place and permeabilized with Triton X100. Immuno‐fluorescence was performed to determine the distribution of HSP10 determined at 60×. B: GBM tumor cells (parental) were treated with vehicle; sorafenib (1.5 μM); sildenafil (2 μM) or the drugs combined for 6 h. Cells were fixed in place and permeabilized with Triton X100. Immuno‐fluorescence was performed to determine the distribution of HSP10 determined at 60×. C: GBM14 tumor cells (parental) were treated with vehicle for 6 h. Cells were fixed in place and permeabilized with Triton X100. Immuno‐fluorescence was performed to determine the distribution of Frataxin determined at 60×. D: GBM tumor cells (parental) were treated with vehicle; sorafenib (1.5 μM); sildenafil (2 μM) or the drugs combined for 6 h. Cells were fixed in place and permeabilized with Triton X100. Immuno‐fluorescence was performed to determine the distribution of Frataxin determined at 60×.
Figure 10
Figure 10
The cellular distribution of ABCB1 and ABCG2. A: GBM14 tumor cells (parental) were treated with vehicle for 6 h. Cells were fixed in place and permeabilized with Triton X100. Immuno‐fluorescence was performed to determine the distribution of ABCB1 determined at 60×. B: GBM tumor cells (parental) were treated with vehicle; sorafenib (1.5 μM); sildenafil (2 μM) or the drugs combined for 6 h. Cells were fixed in place and permeabilized with Triton X100. Immuno‐fluorescence was performed to determine the distribution of ABCB1 determined at 60×. C: GBM14 tumor cells (parental) were treated with vehicle for 6 h. Cells were fixed in place and permeabilized with Triton X100. Immuno‐fluorescence was performed to determine the distribution of ABCG2 determined at 60×. D: GBM tumor cells (parental) were treated with vehicle; sorafenib (1.5 μM); sildenafil (2 μM) or the drugs combined for 6 h. Cells were fixed in place and permeabilized with Triton X100. Immuno‐fluorescence was performed to determine the distribution of ABCG2 determined at 60×.
Figure 11
Figure 11
The cellular distribution of HSP56 and CyP‐A and CyP‐B. A: GBM14 tumor cells (parental) were treated with vehicle for 6 h. Cells were fixed in place and permeabilized with Triton X100. Immuno‐fluorescence was performed to determine the distribution of HSP56 determined at 60×. B: GBM tumor cells (parental) were treated with vehicle; sorafenib (1.5 μM); sildenafil (2 μM) or the drugs combined for 6 h. Cells were fixed in place and permeabilized with Triton X100. Immuno‐fluorescence was performed to determine the distribution of HSP56 determined at 60×. C: GBM14 tumor cells (parental) were treated with vehicle for 6 h. Cells were fixed in place and permeabilized with Triton X100. Immuno‐fluorescence was performed to determine the distribution of CyP‐A and CyP‐B determined at 60×. D: GBM tumor cells (parental) were treated with vehicle; sorafenib (1.5 μM); sildenafil (2 μM) or the drugs combined for 6 h. Cells were fixed in place and permeabilized with Triton X100. Immuno‐fluorescence was performed to determine the distribution of CyP‐A and CyP‐B determined at 60×.
Figure 12
Figure 12
Sildenafil combined with sorafenib/regorafenib reduced expression of chaperones as well as ABCB1 and ABCG2 in vivo. A–D: Athymic mice were treated PO with vehicle diluent (cremophore) or sildenafil (5 mg/kg) and regorafenib (15 mg/kg) or sildenafil (5 mg/kg) and sorafenib (25 mg/kg), for 5 days after which animals were sacrificed, their brains and livers obtained and fixed and sealed in paraffin wax. Sections (10 μm) were taken and subjected to immuno‐histochemistry at 10× magnification using manufacturer validated antibodies to determine the expression of GRP78, GRP94, HSP70, HSP90, mtHSP70, HSP60, HSP40, HSP10, ABCB1, and ABCG2.
Figure 13
Figure 13
Pazopanib + sildenafil reduces GRP78 and other chaperone levels in GBM cells. A: GBM tumor cells (parental) were treated with vehicle; pazopanib (1 μM); sildenafil (2 μM) or the drugs combined for 6 h. Cells were fixed in place and permeabilized with Triton X100. Immuno‐fluorescence at 10× magnification was performed to determine the expression of GRP78. B and C: GBM tumor cells were treated with vehicle; pazopanib (1 μM); sildenafil (2 μM) or the drugs combined for 6 h. Cells were fixed in place and permeabilized with Triton X100. Immuno‐fluorescence at 10× magnification was performed to determine the expression of HSP70, mitochondrial HSP70, HSP90, HSP60, HSP40, and HSP10.
Figure 14
Figure 14
Regulation of virus receptor expression in vitro by sildenafil combined with sorafenib or regorafenib. A: Primary mouse hepatocytes were treated with vehicle; regorafenib (0.5 μM); sildenafil (2 μM) or the drugs in combination for 6 h. Cells were fixed in place and permeabilized with Triton X100. Immuno‐fluorescence at 10× magnification was performed to determine the expression of the Coxsackie and Adenovirus receptor (CAR) or the Hepatitis B virus receptor Na+‐taurocholate cotransporting polypeptide (NTCP). B: HEK293 cells were treated with vehicle; sorafenib (1.5 μM); regorafenib (0.5 μM); sildenafil (2 μM) or the drugs combined for 6 h. At each time point cells were fixed in place and permeabilized with Triton X100. Immuno‐fluorescence at 10× magnification was performed to determine the expression of CAR. C: A549, HuH7 cells were transfected with empty vector plasmid or a plasmid to express GRP78. Twenty‐four hours later cells were were fixed in place and permeabilized with Triton X100. Immuno‐fluorescence at 10× magnification was performed to determine the expression of CAR.
Figure 15
Figure 15
Drug combinations reduce the expression of virus receptors in GBM stem cells in vitro. A–D: GBM tumor cells (parental and stem like derived) were treated with vehicle; OSU‐03012 (1 μM); sorafenib (1.5 μM); regorafenib (0.5 μM); sildenafil (2 μM) or the drugs combined for 6 h. Cells were fixed in place and permeabilized with Triton X100. Immuno‐fluorescence at 10× magnification was performed to determine the expression of CAR and NPC1.
Figure 16
Figure 16
Drug combinations reduce the expression of virus receptors in animals. A and B: Athymic mice were treated PO with vehicle diluent (cremophore) or sildenafil (5 mg/kg) and regorafenib (15 mg/kg) or sildenafil (5 mg/kg) and sorafenib (25 mg/kg), for 5 days after which animals were sacrificed, their brains and livers obtained and fixed and sealed in paraffin wax. Sections (10 μm) were taken and subjected to immuno‐histochemistry at 10× magnification to determine the expression of: CAR; NTCP; and the Ebola/Hepatitis A/C virus receptor proteins CD81, NPC1, and TIM1.
Figure 17
Figure 17
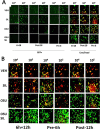
Regulation of viral gene expression and virus infectivity in vitro by sildenafil combined with sorafenib or regorafenib. A. Left parts: HEK293 cells were transfected with empty vector plasmid or a plasmid to express GRP78. After 24 h cells were infected with Ad5.GFP or Coxsackie virus B4. The percentage cell death was determined by live/dead assay determined after 18 h where green cells = alive and red/yellow cells = dead. Right parts: HEK293 cells were transfected with a scrambled siRNA (siSCR) or an siRNA to knock down GRP78 expression (siGRP78). Twenty‐four hours after transfection cells are infected with increasing amounts of Ad5.GFP or Coxsackie virus B4. The percentage cell death was determined by live/dead assay determined after 18 h where green cells = alive and red/yellow cells = dead. B: HEK293 cells were infected with increasing numbers of Ad.GFP virus particles (103–105) with sorafenib (0.75 μM) and sildenafil (2 μM) (LEFT block of 12 panels), regorafenib (0.3 μM) and sildenafil (2 μM) (RIGHT block of 12 panels). Cells were either: pre‐treated for 6 h only prior to viral infection; post‐treated after viral infection; or treated prior to infection and after infection for a total of 14 h. Cells were visualized under the FITC filter to determine the numbers of GFP+ cells. C: HEK293 cells were infected with increasing numbers of Ad.GFP virus particles (103–105) with sorafenib (0.75 μM) and sildenafil (2 μM) (LEFT block of 12 panels), regorafenib (0.3 μM) and sildenafil (2 μM) (RIGHT block of 12 panels). Cells were either: pre‐treated for 6 h only prior to viral infection; post‐treated after viral infection; or treated prior to infection and after infection for a total of 24 h. Cells were visualized under the FITC and rhodamine filters to determine the numbers of viable (green) and dead (yellow + red) cells. D: HEK293 cells were infected with increasing numbers of Coxsackie virus B4 particles (104–107) with sorafenib (0.75 μM) and sildenafil (2 μM) (LEFT block of 12 panels), regorafenib (0.3 μM) and sildenafil (2 μM) (RIGHT block of 12 panels). Cells were either: pre‐treated for 6 h only prior to viral infection or treated prior to infection and after infection for a total of 24 h. Cells were visualized under the FITC and rhodamine filters to determine the numbers of viable (green) and dead (yellow + red) cells.
Figure 18
Figure 18
Drug combinations with Viagra are more potent at preventing viral gene expression and viral reproduction than use of single kinase inhibitory drugs. A: HEK293 cells were infected with increasing numbers of Ad.GFP virus particles (104, 105) with the indicated amounts of OSU‐03012 (0.75 μM) and/or sildenafil (2.0 μM). Cells were either: pre‐treated for 6 h only prior to viral infection; post‐treated after viral infection; or treated prior to infection and after infection for a total of 14 or 18 h, as indicated. In Part A. Left images: cells were visualized under the FITC filter to determine the numbers of GFP+ cells. In Part A. Right images: cells were visualized under the FITC and rhodamine filters to determine the numbers of viable (green) and dead (yellow + red) cells. B: VERO E6 cells were infected with increasing numbers of Mumps virus particles (104, 105) with the indicated amounts of OSU‐03012 (0.75 μM) and/or sildenafil (2.0 μM). Cells were either: pre‐ and post‐treated with drugs for 48 h total; pre‐treated for 6 h only prior to viral infection or treated prior to infection and after infection for a total 18 h. Cells were visualized under the FITC and rhodamine filters to determine the numbers of viable (green) and dead (yellow + red) cells.
Figure 19
Figure 19
A: Treatment of cells before infection with Chikungunya virus with drug combinations prevents virus replication. VERO cells were pre‐treated with OSU‐03012 (2 μM) and/or sildenafil (2 μM); sorafenib (1 μM) and/or sildenafil (2 μM), as indicated. Drugs were removed and cells infected with increasing numbers of Chikungunya virus particles (104–105). Cells were fixed in situ and H&E stained 48 h after infection. B: Treatment of cells with drug combinations after infection with Yellow Fever virus prevents virus replication. VERO cells were infected with increasing numbers of Yellow Fever virus particles (102–105) followed by treatment with sorafenib (1 μM) and/or sildenafil (2 μM), as indicated either for 12 h after infection or for 6 h before infection. Fixed and H&E stained cells were assessed for their morphology 96 h after infection. C: Treatment of cells with drug combinations after infection with Dengue viruses prevents virus replication. VERO cells were infected with increasing numbers of Dengue virus particles (102–105) followed by treatment with sorafenib (1 μM) and/or sildenafil (2 μM), as indicated either for 12 h after infection or for 6 h before infection. Fixed and H&E stained cells were assessed for their morphology 96 h after infection.
Figure 20
Figure 20
A: Treatment of cells with drug combinations after infection with Enterovirus 71 prevents virus replication. VERO cells were infected with increasing numbers of Enterovirus 71 particles (103–105) followed by treatment with sorafenib (1 μM) and/or sildenafil (2 μM), as indicated either for 12 h after infection or for 6 h before infection. Fixed and H&E stained cells were assessed for their morphology 96 h after infection. B: Treatment of cells with drug combinations after infection with West Nile virus prevents virus replication. VERO cells were infected with increasing numbers of West Nile virus particles (103–105) followed by treatment with sorafenib (1 μM) and/or sildenafil (2 μM), as indicated either for 12 h after infection or for 6 h before infection. Fixed and H&E stained cells were assessed for their morphology 72 h after infection. C: Treatment of cells with drug combinations after infection with Rabies virus prevents virus replication. BHK‐21 cells were infected with increasing numbers of Rabies virus particles (102–105) followed by treatment with sorafenib (1 μM) and/or sildenafil (2 μM), as indicated either for 12 h after infection or for 6 h before infection. Fixed and H&E stained cells were assessed for their morphology 72 h after infection.
Figure 21
Figure 21
Multi‐kinase inhibitors as anti‐viral agents. A: HEK293 cells were infected with increasing numbers of Ad.GFP virus particles (104, 105) with the indicated amounts of sorafenib (0.75 μM) and/or sildenafil (2.0 μM). Cells were either: pre‐treated for 6 h only prior to viral infection; post‐treated after viral infection; or treated prior to infection and after infection for a total of 14 or 18 h, as indicated. In Part A. Left images: cells were visualized under the FITC filter to determine the numbers of GFP+ cells. In Part A. Right images: cells were visualized under the FITC and rhodamine filters to determine the numbers of viable (green) and dead (yellow + red) cells. B: HEK293 cells were infected with increasing numbers of Ad.GFP virus particles (104, 105) with celecoxib (10 μM) and sildenafil (2 μM). Cells were either: pre‐treated for 6 h only prior to viral infection; post‐treated after viral infection; or treated prior to infection and after infection for a total of 14 or 18 h, as indicated. Left images: cells were visualized under the FITC filter to determine the numbers of GFP+ cells. Right images: cells were visualized under the FITC and rhodamine filters to determine the numbers of viable (green) and dead (yellow + red) cells. C: HEK293 cells were infected with increasing numbers of Ad.GFP virus particles (104, 105) with the indicated amounts of pazopanib (1.0 μM) and/or sildenafil (2.0 μM). Cells were either: pre‐treated for 6 h only prior to viral infection; post‐treated after viral infection; or treated prior to infection and after infection for a total of 14 or 18 h, as indicated. In Part A. Left images: cells were visualized under the FITC filter to determine the numbers of GFP+ cells. In Part A. Right images: cells were visualized under the FITC and rhodamine filters to determine the numbers of viable (green) and dead (yellow + red) cells. D: VERO cells were infected with increasing numbers of Mumps virus particles (104, 105) with the indicated amounts of sorafenib (0.75 μM) and/or sildenafil (2.0 μM). Cells were either: pre‐ and post‐treated with drugs for 48 h total; pre‐treated for 6 h only prior to viral infection or treated prior to infection and after infection for a total 18 h. Cells were visualized under the FITC and rhodamine filters to determine the numbers of viable (green) and dead (yellow + red) cells.
Figure 22
Figure 22
Sorafenib and regorafenib suppress bacterial cell growth and reverse antibiotic resistance. A: Escherichia coli bacteria transformed with plasmids to be ampicillin and kanamycin resistant were grown without shaking in 50 ml of media with or without ampicillin (1.0 μg/ml) and kanamycin (1.0 μg/ml). Bacteria were treated with sorafenib (0.5–2.0 μM) or with regorafenib (0.25–1.0 μM) for up to 9 h and at each indicated time point 1 ml of media was removed and the bacteria isolated after centrifugation. The total amount of protein in the bacterial cell pellet was determined at each time point by Bradford assay (n = 3 ± SEM). B and C: Escherichia coli bacteria transformed to be ampicillin and kanamycin resistant were grown with rotary shaking in 50 ml of media with or without ampicillin and kanamycin. Bacteria were treated with sorafenib (0.5–2.0 μM) or with regorafenib (0.25–1.0 μM) for 9 h and 1 ml of media was removed and the bacteria isolated after centrifugation. The total amount of protein in the bacterial cell pellet was determined at after 9 h by Bradford assay (n = 3 ± SEM). D: Escherichia coli bacteria transformed to be ampicillin and kanamycin resistant were grown with rotary shaking in 50 ml of media with or without ampicillin and kanamycin. Bacteria were treated with celecoxib (2.0–8.0 μM) for up to 9 h and at each indicated time point 1 ml of media was removed and the bacteria isolated after centrifugation. The total amount of protein in the bacterial cell pellet was determined at each time point by Bradford assay (n = 3 ± SEM).
Figure 23
Figure 23
Antibiotic properties of OSU‐03012, sorafenib and of pazopanib. A: Streptococcus pyogenes bacteria were treated with OSU‐03012 (2.0 μM) or sorafenib (1.5 μM) or pazopanib (1.5 μM) for 9 h after which total bacterial biomass in 1 ml of media was determined using a 6 place electronic balance (n = 3 ± SEM). B: Salmonella typhimurium bacteria were treated with sorafenib (0.75 μM); OSU‐03012 (1.0 μM); pazopanib (1.5 μM) for 3 and 6 h and at each time point 1 ml of media was removed and the bacteria isolated after centrifugation. The total amount of protein in the bacterial cell pellet was determined by Bradford assay (n = 3 ± SEM). C: Vibrio cholerae bacteria were treated with sorafenib (0–9 μM); OSU‐03012 (0–9 μM); for 4 h. The optical density of the cell culture media was determined A600 nm (n = 3 ± SEM). D: Escherichia coli bacteria transformed to be ampicillin and kayamycin resistant were grown with rotary shaking in 50 ml of media with or without ampicillin (1.0 μg/ml) and kayamycin (1.0 μg/ml). At each indicated time point 1 ml of media was removed and the bacteria isolated after centrifugation. The total amount of protein in the bacterial cell pellet was determined and equal amounts of protein from each condition subjected to SDS PAGE. Immunoblotting was performed to determine the expression of Rec A, Dna K, and Dna J.
Figure 24
Figure 24
Sorafenib kills bacteria and re‐sensitizes bacteria to standard of care antibiotics. A–D: MRSE, MRSA, VRE, and Acinetobacter baumannii bacteria were treated with sorafenib (1.0 μM) or pazopanib (1.0 μM) as indicated in the presence or absence of ampicillin (2.0 μg/ml); meropenem (2.0 μg/ml) or vancomycin (2.0 μg/ml) and in the indicated combinations for 0–9 h and 1 ml of media was removed and the bacteria isolated after centrifugation. The total amount of protein in the bacterial cell pellet was determined by Bradford assay (n = 3 ±  SEM).
Figure 25
Figure 25
Sorafenib suppresses the growth of clinical isolate Klebsiella pneumoniaeblakpc superbug” bacteria and re‐sensitizes bacteria to ampicillin. Klebsiella pneumoniae strains were treated with OSU‐03012, sorafenib or pazopanib (Part A, laboratory generic variant, 0.75 μM each; Parts B and C, Klebsiella pneumoniae antibiotic resistant strains #1, #3, #4 (sorafenib, 2.0 μM each) in the presence or absence of 2.0 μg/ml ampicillin or 4.0 μg/ml meropenem and in the indicated combinations for 0‐9h and 1 ml of media was removed and the bacteria isolated after centrifugation. The total amount of protein in the bacterial cell pellet was determined by Bradford assay (n = 3 ± SEM).
Figure 26
Figure 26
Sorafenib suppresses the growth of clinical isolate Klebsiella pneumoniae “superbug” bacteria and re‐sensitizes bacteria to gentamicin. A–C: Klebsiella pneumoniae strains were treated with sorafenib (2.0–8.0 μM) in the presence or absence of 2.0 μg/ml ampicillin and/or 2.0 μg/ml gentamicin alone or combined, and in the indicated combinations for 6 h and 1 ml of media was removed and the bacteria isolated after centrifugation. The total amount of protein in the bacterial cell pellet was determined by Bradford assay (n = 3 ± SEM).
Figure 27
Figure 27
Sorafenib alone suppresses colony formation and sensitizes Klebsiella pneumoniae “superbug” bacteria strain #1 to ampicillin. Strain #1 bacteria that super‐over –express the resistance protein bla kpc were grown for 3 h in liquid media which is when the bacteria have entered log‐phase growth. Equal mounts of media (∼20 μl) containing bacteria were streaked onto nutrient broth agar plates in the standard format with sequential streaking so that each set of streaking results in dilution of the number of bacterial colony forming units. Each plate contained vehicle control agar; agar containing sorafenib (5 μM, 10 μM) and/or ampicillin (2 μg/ml; 6 μM). Bacterial were grown at 37°C in a humified atmosphere for 24 h. Bacteria in situ were then imaged using a Motorolla 10 mega‐pixel ‘phone camera.
Figure 28
Figure 28
Sorafenib suppresses colony formation in Klebsiella pneumoniae “superbug” bacteria strains #3 and #4. Strain #3 and Strain #4 bacteria were grown for 3 h in liquid media which is when the bacteria have entered log‐phase growth. Equal mounts of media (∼20 μl) containing bacteria were streaked onto nutrient broth agar plates in the standard format so that each set of streaking results in dilution of the number of bacterial colony forming units. Each plate contained vehicle control agar; agar containing sorafenib (5 μM) and/or ampicillin (2 μg/ml; 6 μM). Bacterial were grown at 37°C in a humified atmosphere for 24 h. Bacteria in situ were then imaged using a Motorolla ‘phone camera.
Figure 29
Figure 29
Sorafenib alters the morphology of Klebsiella pneumoniae bacteria from surviving bacterial colonies grown on sorafenib agar. Strains #1; #3; #4, after imaging (Figs. 27 and 28) were smeared onto glass slides, heat fixed and subjected to Gram staining. Stained cells were imaged at 100× under oil immersion using a Ziess microscope and black and white camera, and post hoc highlighting color added artificially to each image using AdobePhotoshop CS6.

Similar articles

Cited by

References

    1. Anderson K, Stott EJ, Wertz GW. 1992. Intracellular processing of the human respiratory syncytial virus fusion glycoprotein: amino acid substitutions affecting folding, transport and cleavage. J Gen Virol 73:1177–1188. - PubMed
    1. Bai LY, Weng JR, Tsai CH, Sargeant A, Lin CW, Chiu CF. 2010. OSU‐03012 sensitizes TIB‐196 myeloma cells to imatinib mesylate via AMP‐activated protein kinase and STAT3 pathways. Leuk Res 2010:816–820. - PubMed
    1. Black KL, Yin D, Ong JM, Hu J, Konda BM, Wang X, Ko MK, Bayan JA, Sacapano MR, Espinoza A, Irvin DK, Shu Y. 2008. PDE5 inhibitors enhance tumor permeability and efficacy of chemotherapy in a rat brain tumor model. Brain Res 1230:290–302. - PMC - PubMed
    1. Bolt G. 2001. The measles virus (MV) glycoproteins interact with cellular chaperones in the endoplasmic reticulum and MV infection upregulates chaperone expression. Arch Virol 146:2055–2068. - PubMed
    1. Booth L, Cazanave SC, Hamed HA, Yacoub A, Ogretmen B, Chen CS, Grant S, Dent P. 2012a. OSU‐03012 suppresses GRP78/BiP expression that causes PERK‐dependent increases in tumor cell killing. Cancer Biol Ther 13:224–236. - PMC - PubMed

Publication types

MeSH terms