. 2015 Apr;20(4):046002.
doi: 10.1117/1.JBO.20.4.046002.

In vivo optical microscopy of peripheral nerve myelination with polarization sensitive-optical coherence tomography

Affiliations

In vivo optical microscopy of peripheral nerve myelination with polarization sensitive-optical coherence tomography

Francis P Henry et al. J Biomed Opt. 2015 Apr.

Abstract

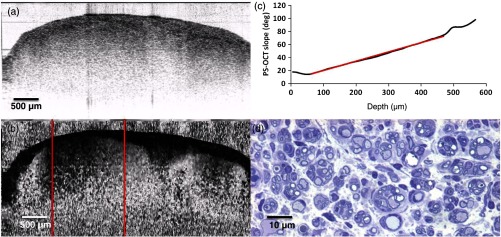
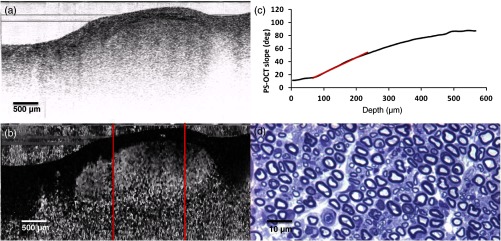
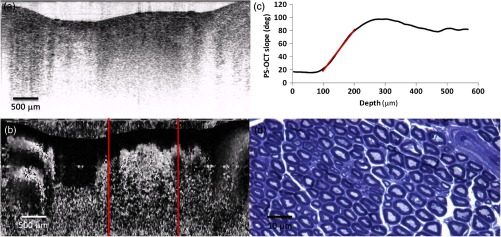
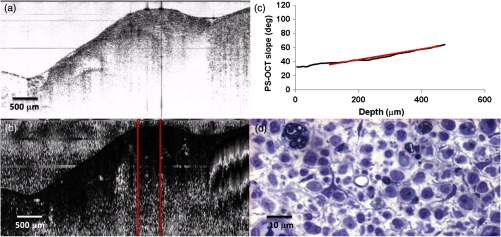
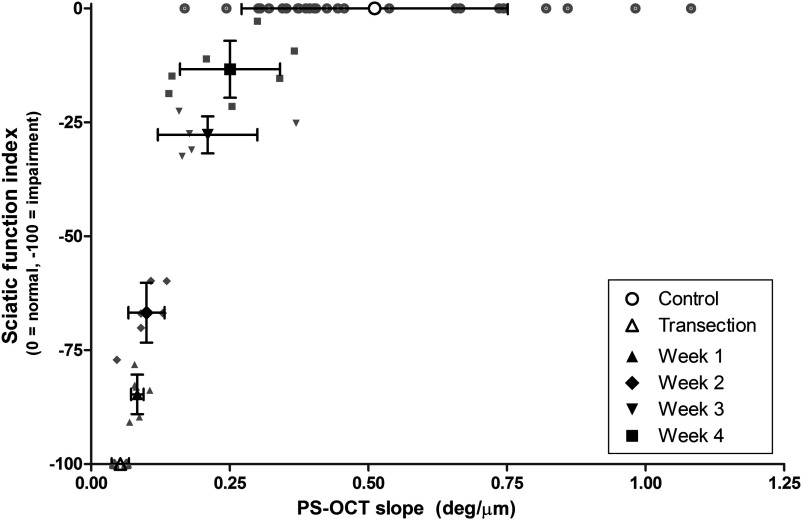
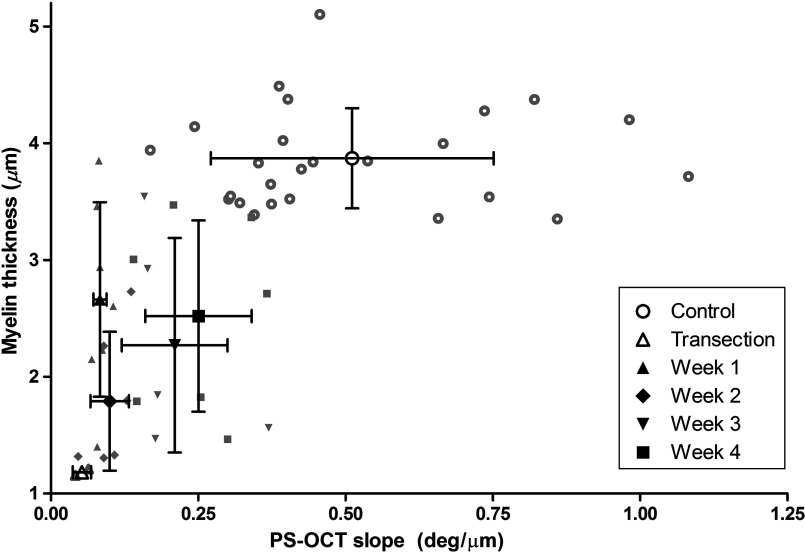
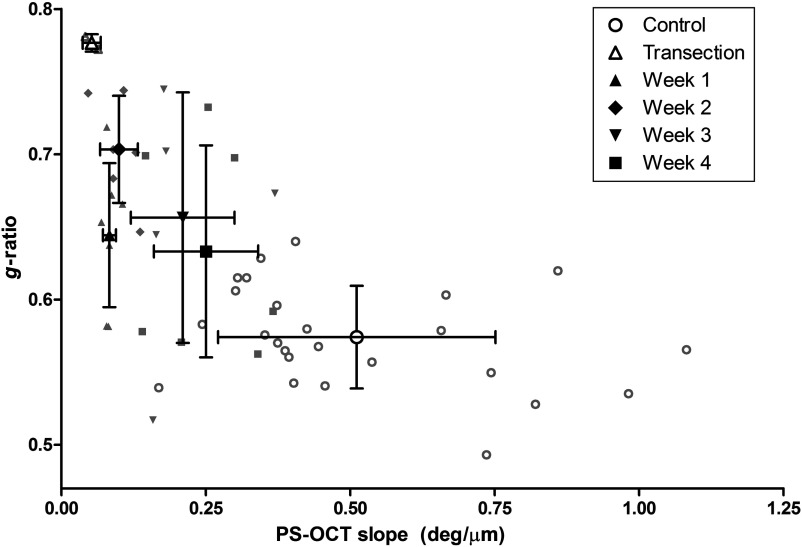
Assessing nerve integrity and myelination after injury is necessary to provide insight for treatment strategies aimed at restoring neuromuscular function. Currently, this is largely done with electrical analysis, which lacks direct quantitative information. In vivo optical imaging with sufficient imaging depth and resolution could be used to assess the nerve microarchitecture. In this study, we examine the use of polarization sensitive-optical coherence tomography (PS-OCT) to quantitatively assess the sciatic nerve microenvironment through measurements of birefringence after applying a nerve crush injury in a rat model. Initial loss of function and subsequent recovery were demonstrated by calculating the sciatic function index (SFI). We found that the PS-OCT phase retardation slope, which is proportional to birefringence, increased monotonically with the SFI. Additionally, histomorphometric analysis of the myelin thickness and g-ratio shows that the PS-OCT slope is a good indicator of myelin health and recovery after injury. These results demonstrate that PS-OCT is capable of providing nondestructive and quantitative assessment of nerve health after injury and shows promise for continued use both clinically and experimentally in neuroscience.


Figures

Fig. 1
Fig. 1
Schematic of polarization sensitive-optical coherence tomography (PS-OCT) system (pbs: polarizing beam splitter, pm: polarization modulator, oc: optical circulator, ndf: neutral density filter, pc: polarization controller, g: grating, pbs: polarizing beam splitter, pol: polarizer, and lsc: line scan camera).
Fig. 2
Fig. 2
Volume render of three-dimensional PS-OCT data (covering a 5×5×2  mm3 region) with the area corresponding to the central 50% of the sciatic nerve used to quantify the average phase retardation outlined in red for (a) control, (b) nerve transection, (c)–(f) 1 to 4 weeks postnerve crush injury.
Fig. 3
Fig. 3
Normal sciatic nerve: (a) normal and (b) polarization-sensitive OCT images, (c) plot of average phase retardation as a function of depth (slope of 0.4328  deg/μm), and (d) corresponding 400× histology.
Fig. 4
Fig. 4
Sciatic nerve, 7 days postinjury: (a) normal and (b) polarization-sensitive OCT images, (c) plot of average phase retardation as a function of depth (slope of 0.0872  deg/μm), and (d) corresponding 400× histology.
Fig. 5
Fig. 5
Sciatic nerve, 14 days postinjury: (a) normal and (b) polarization-sensitive OCT images, (c) plot of average phase retardation as a function of depth (slope of 0.0851  deg/μm), and (d) corresponding 400× histology.
Fig. 6
Fig. 6
Sciatic nerve, 21 days postinjury: (a) normal and (b) polarization-sensitive OCT images, (c) plot of average phase retardation as a function of depth (slope of 0.1261  deg/μm), and (d) corresponding 400× histology.
Fig. 7
Fig. 7
Sciatic nerve, 28 days postinjury: (a) normal and (b) polarization-sensitive OCT images, (c) plot of average phase retardation as a function of depth (slope of 0.3080  deg/μm), and (d) corresponding 400× histology.
Fig. 8
Fig. 8
Sciatic nerve, 14 days following transection: (a) normal and (b) polarization-sensitive OCT images, (c) plot of average phase retardation as a function of depth (slope of 0.0554  deg/μm) and (d) corresponding 400× histology.
Fig. 9
Fig. 9
Sciatic function index (SFI) versus PS-OCT slope. SFI and PS-OCT slope increase with time postinjury.
Fig. 10
Fig. 10
Myelin thickness versus PS-OCT slope. Myelin degeneration occurred through week 2, followed by myelin regeneration.
Fig. 11
Fig. 11
g-ratio versus PS-OCT slope.

References

    1. Prinz R. A. D., et al. , “Experimental chronic entrapment of the sciatic nerve in adult hamsters: an ultrastructural and morphometric study,” Braz. J. Med. Biol. Res. 36(9), 1241–1245 (2003).BJMRDK10.1590/S0100-879X2003000900015 - DOI - PubMed
    1. Stuart R. M., Koh E. S. C., Breidahl W. H., “Sonography of peripheral nerve pathology,” Am. J. Roentgenol. 182(1), 123–129 (2004).AJROAM10.2214/ajr.182.1.1820123 - DOI - PubMed
    1. Bendszus M., Stoll G., “Caught in the act: in vivo mapping of macrophage infiltration in nerve injury by magnetic resonance imaging,” J. Neurosci. 23(34), 10892–10896 (2003).JNRSDS - PMC - PubMed
    1. Bendszus M., Stoll G., “Technology insight: visualizing peripheral nerve injury using MRI,” Nat. Clin. Pract. Neurol. 1(1), 45–53 (2005).NCPND410.1038/ncpneuro0017 - DOI - PubMed
    1. Bendszus M., et al. , “Assessment of nerve degeneration by gadofluorine M-enhanced magnetic resonance imaging,” Ann. Neurol. 57(3), 388–395 (2005).ANNED310.1002/(ISSN)1531-8249 - DOI - PubMed

Publication types

MeSH terms