. 2015 Apr 10:6:6790.
doi: 10.1038/ncomms7790.

Controlled induction of DNA double-strand breaks in the mouse liver induces features of tissue ageing

Affiliations

Controlled induction of DNA double-strand breaks in the mouse liver induces features of tissue ageing

Ryan R White et al. Nat Commun. .

Abstract

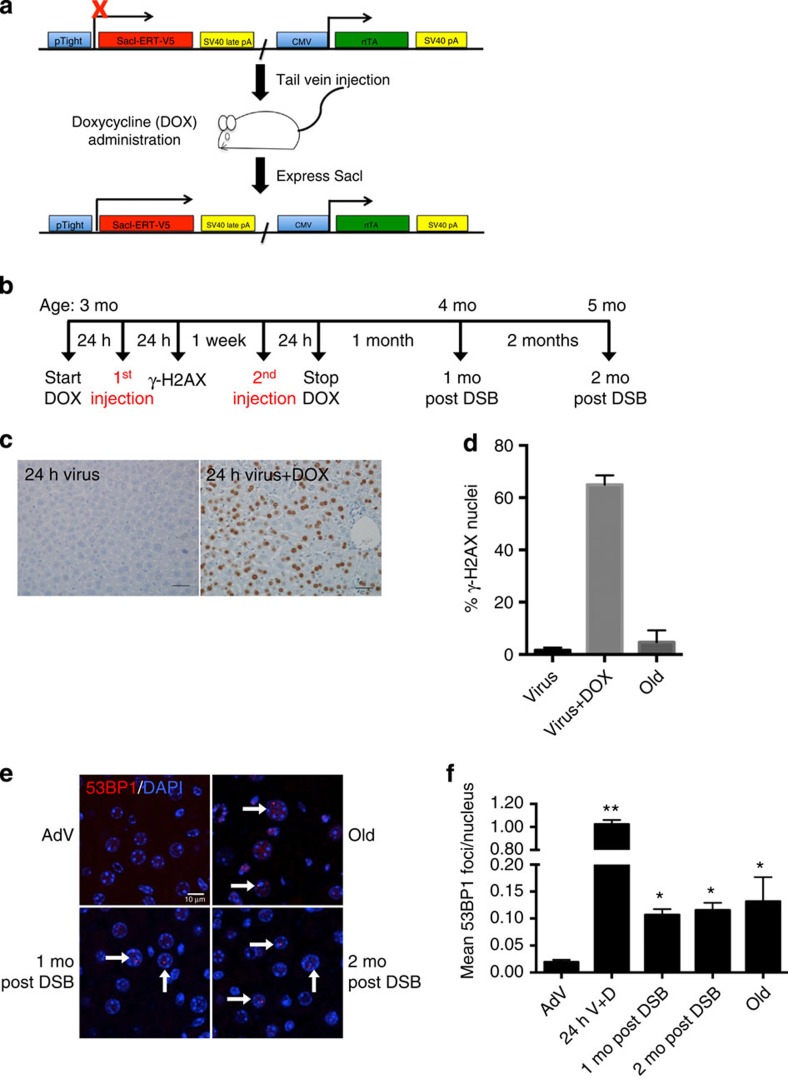
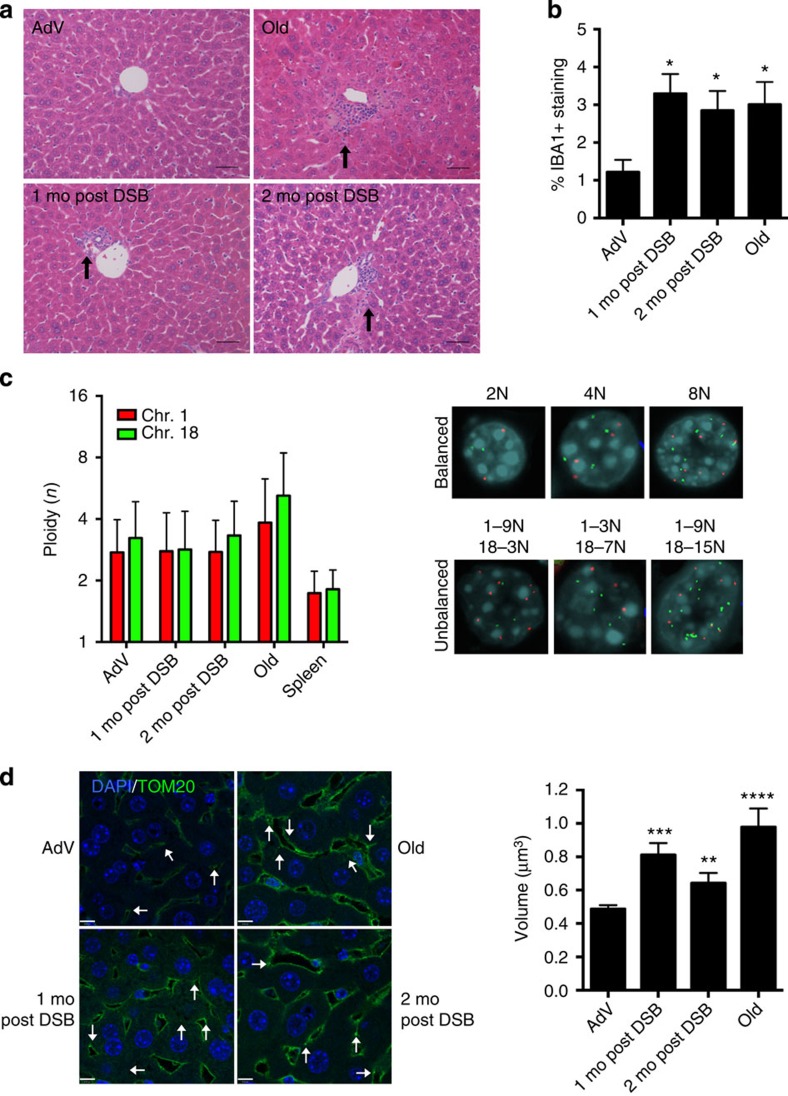
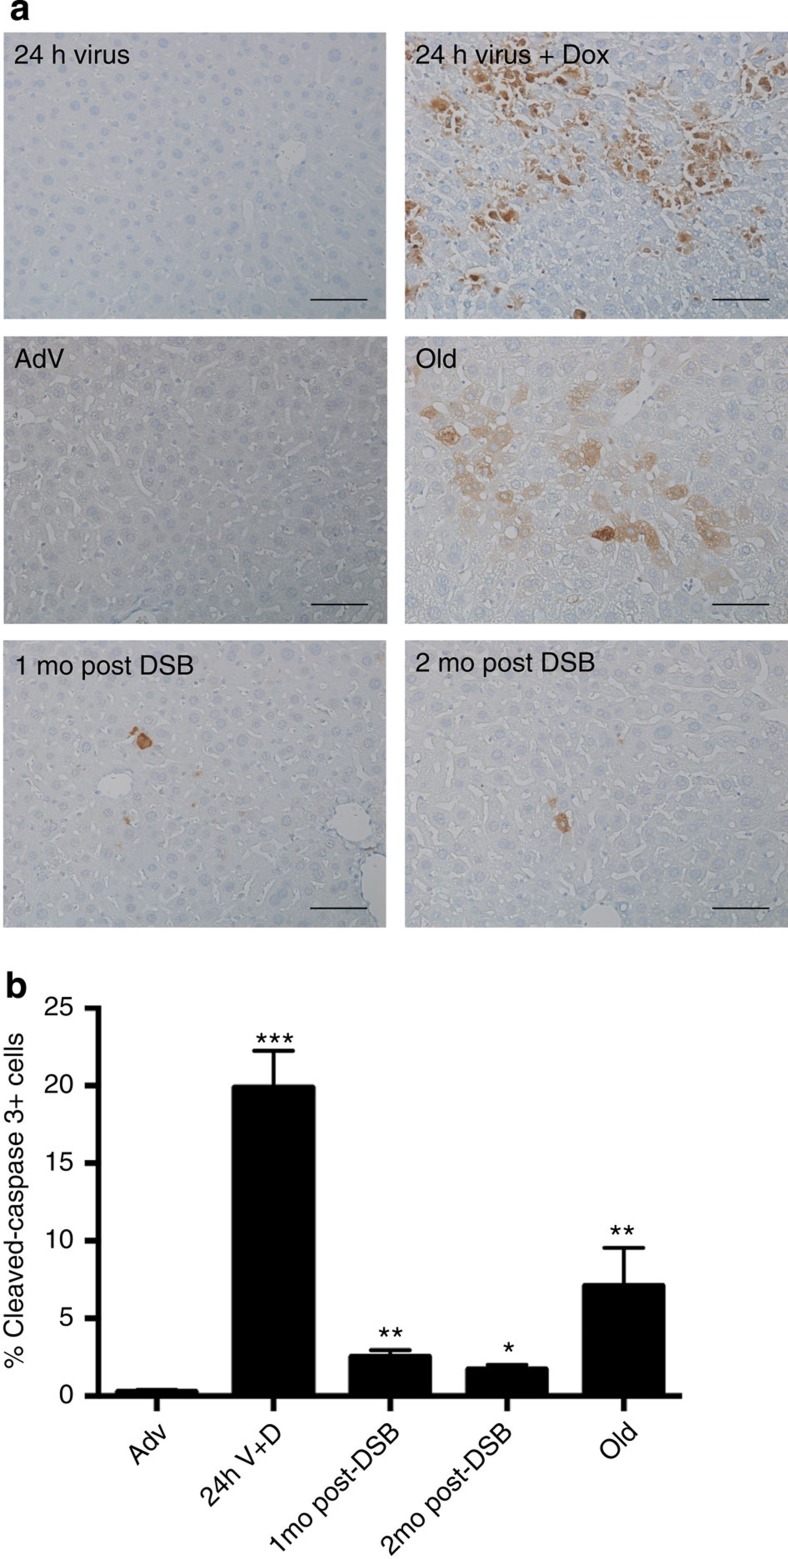
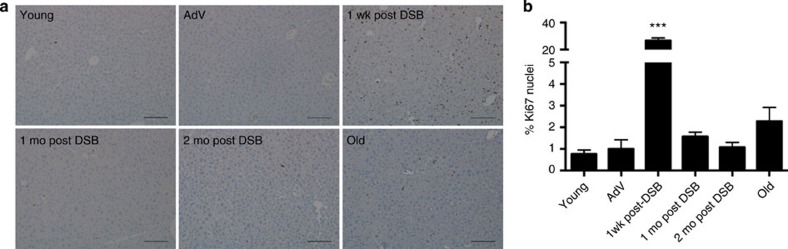
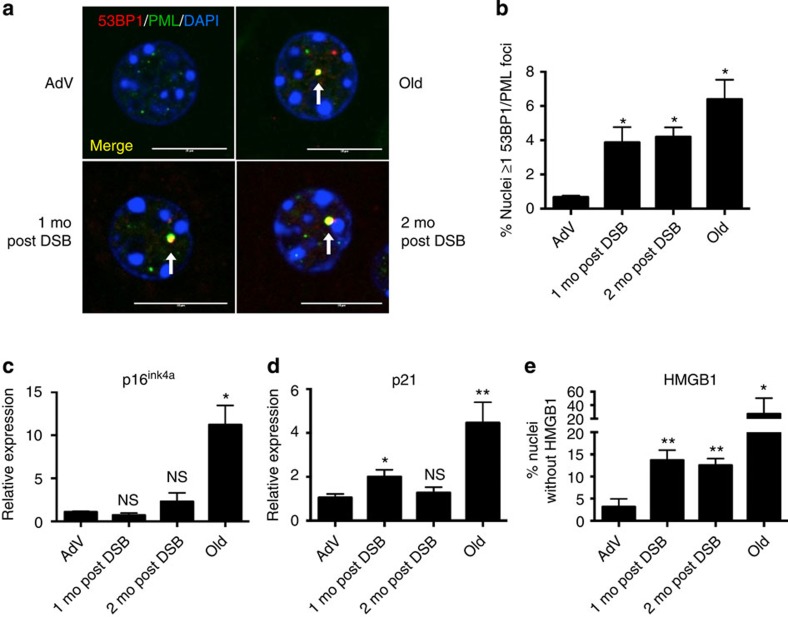
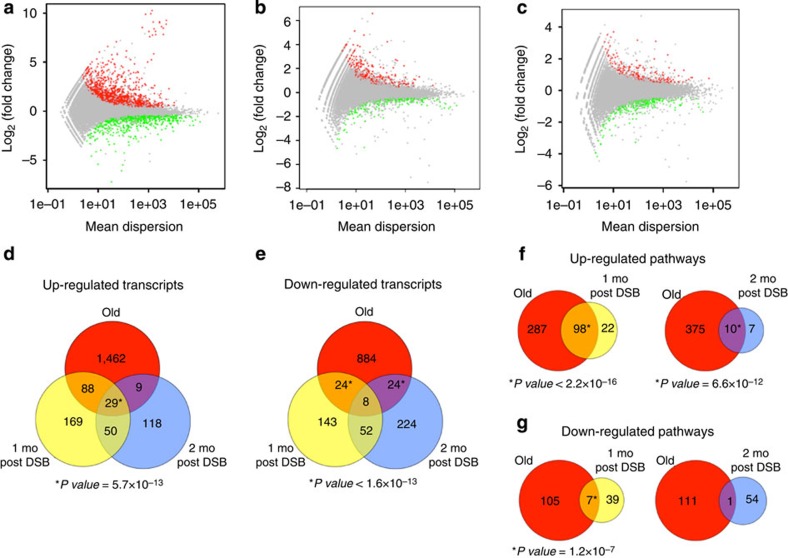
DNA damage has been implicated in ageing, but direct evidence for a causal relationship is lacking, owing to the difficulty of inducing defined DNA lesions in cells and tissues without simultaneously damaging other biomolecules and cellular structures. Here we directly test whether highly toxic DNA double-strand breaks (DSBs) alone can drive an ageing phenotype using an adenovirus-based system based on tetracycline-controlled expression of the SacI restriction enzyme. We deliver the adenovirus to mice and compare molecular and cellular end points in the liver with normally aged animals. Treated, 3-month-old mice display many, but not all signs of normal liver ageing as early as 1 month after treatment, including ageing pathologies, markers of senescence, fused mitochondria and alterations in gene expression profiles. These results, showing that DSBs alone can cause distinct ageing phenotypes in mouse liver, provide new insights in the role of DNA damage as a driver of tissue ageing.


Figures

Figure 1
Figure 1. DSB induction by SacI adenovirus.
(a) Schematic of the SacI adenoviral construct (SacI AdV) and its activation by DOX. (b) Schematic of the experimental timeline and mouse ages at which DSBs were induced. (c) Liver sections were immunostained for γ-H2AX 24 h after SacI AdV tail-vein injection either without (left panel) or with (right panel) DOX administration, and old (28 months) mice as a control. Scale bar, 100 μM. (d) Results were quantified and data shown as mean percentage of nuclei positively stained±s.d.; Virus n=3, Virus+Dox n=2, Old n=3. (e) Representative images of liver sections stained with 53BP1 (red) and DAPI (blue), analysed by confocal microscopy. White arrows indicate persistent 53BP1 foci. Scale bar, 10 μM. (f) Mean number of 53BP1 foci per nucleus was quantified. Data shown are the mean±s.e.m. of foci per nucleus, where AdV, 1 mo, 2 mo post DSB n=4, 24 h V+D n=2 and old n=3; >300 nuclei were scored per animal. P values were calculated using Student's unpaired t-test to AdV samples. *P<0.05, **P<0.01. Mo, months.
Figure 2
Figure 2. Phenotypic analysis of DSB-induced mouse liver.
(a) Representative haemotoxylin and eosin-stained liver sections (portal vein orientation) assessed blinded for pathological characteristics of aging at × 20 magnification. Black arrows indicate sites of lymphocytic infiltrates. (b) Quantification of activated macrophages determined by percentage of IBA1 staining. Data shown represents the mean±s.e.m. from three images per n, where n=4 for all cohorts. (c) Dual-colour interphase FISH was performed on liver sections. Ploidy for chromosome 1 (red) and chromosome 18 (green) was determined for 100 hepatocytes per n where n=3 for all cohorts. The ploidy of each chromosome was plotted as mean±s.d. Representative images are shown for cells with balanced chromosome ploidy for 2, 4 and 8 N and unbalanced cells. (d) Mitochondrial volume was quantified by immunofluorescent staining for TOM20 (green), a mitochondrial membrane-bound protein and nuclei (blue) and analysed by confocal microscopy. White arrows indicate analysable mitochondria after background noise subtraction from z-stack. Mean volume (in xyz planes) was calculated for eight images per n (>2,000 mitochondria), where AdV, 1 mo, 2 mo post DSB n=4 and old n=3. Data shown represents the mean±s.e.m. Scale bar, 8 μM. P values were determined using the Kruskal–Wallis test to AdV samples followed by a post hoc Dunn's test. *P<0.05, **P<0.01, ***P<0.001, ****P<0.0001. Mo, months.
Figure 3
Figure 3. Induction of apoptosis after DSB treatment.
(a) Liver sections were immunostained for cleaved caspase-3 after SacI adenoviral tail-vein injection as indicated. Magnification, × 20. Scale bar, 100 μM. (b) Quantification of cleaved caspase-3 from three images per n, where AdV, 1 mo, 2 mo post DSB n=4, 24 h V+D n=2 and old n=3. P values were calculated using the Kruskal–Wallis test to AdV samples followed by a post hoc Dunn's test. *P<0.05, **P<0.01, ***P<0.001. Mo, months.
Figure 4
Figure 4. Cell proliferation after DSB treatment.
(a) Liver sections were immunostained for Ki67 after SacI adenoviral tail-vein injection as indicated and images acquired at × 10 magnification. Scale bar, 150 μM. (b) Quantification of the per cent of Ki67+ nuclei of total nuclei from three images per n, where AdV, 1 mo, 2 mo post DSB n=4, 24 h V+D n=2 and old n=3. Data represent the mean±s.e.m. P values were determined using Student's unpaired t-test. ***P<0.001. Mo, months; wk, weeks.
Figure 5
Figure 5. DSBs trigger senescence in the mouse liver.
(a) Representative images of DNA-SCARS analysed by confocal microscopy; 53BP1 (red), PML nuclear bodies (green) and DAPI (blue). White arrows indicate DNA-SCARS (co-localized PML and 53BP1). Scale bar, 10 μM. (b) Quantification of nuclei with ≥1 co-localized 53BP1 and PML focus. Data shown are the mean±s.e.m. of all biological replicates for each cohort, where AdV, 1mo, 2mo post DSB n=4 and old n=3; >300 nuclei were scored per n. (c,d) Quantitative real-time PCR (qPCR) analysis of (c) p16ink4a and (d) p21 expression; relative expression was calculated using the ΔΔCt method and normalized to GAPDH expression levels. (e) Liver sections were immunostained for HMGB1 and scored as the per cent nuclei lacking HMGB1 staining. For ce, data shown represent the mean±s.e.m. of all biological replicates for each cohort, where AdV, 1 mo, 2 mo post DSB n=4 and old n=6 for each cohort and for e >1,000 nuclei were scored per n. P values were calculated using Student's unpaired t-test except for b, where the Kruskal–Wallis test to AdV samples followed by a post hoc Dunn's test was performed. *P<0.05, **P<0.01, NS, not significant.
Figure 6
Figure 6. RNA-seq gene expression profiles of mouse liver after DSB induction.
Differential expression plots of the normalized mean count dispersion of transcripts versus normalized log2(fold change) for (a) young versus old, (b) AdV versus 1 mo post DSB and (c) AdV versus 2 mo post DSB. P value cutoff is 0.05 for transcripts either significantly upregulated (red) or downregulated (green). (dg) Venn diagrams. (d) Upregulated or (e) downregulated transcript overlaps of old, 1 mo post DSB and 2 mo post DSB as compared with their respective controls. (f,g) Significantly differentially expressed transcripts were subjected to GO analysis for biological process using DAVID. (f) Overlap of 1 mo post DSB or 2 mo post DSB significantly upregulated or (g) downregulated pathways, compared with old. P value of overlaps were determined using a binomial distribution test for 37,310 annotated transcripts and 13,301 GO terms for biological processes at time analysis was performed.

References

    1. Jackson S. P. Sensing and repairing DNA double-strand breaks. Carcinogenesis 23, 687–696 (2002) . - PubMed
    1. Mine-Hattab J. & Rothstein R. Increased chromosome mobility facilitates homology search during recombination. Nat. Cell Biol. 14, 510–517 (2012) . - PubMed
    1. Soutoglou E. & Misteli T. On the contribution of spatial genome organization to cancerous chromosome translocations. J. Natl Cancer. Inst. Monogr. 39, 16–19 (2008) . - PubMed
    1. San Filippo J., Sung P. & Klein H. Mechanism of eukaryotic homologous recombination. Annu. Rev. Biochem. 77, 229–257 (2008) . - PubMed
    1. Lieber M. R. The mechanism of double-strand DNA break repair by the nonhomologous DNA end-joining pathway. Annu. Rev. Biochem. 79, 181–211 (2010) . - PMC - PubMed

Publication types

MeSH terms