. 2015 Nov;26(11):2741-52.
doi: 10.1681/ASN.2014090859. Epub 2015 Apr 9.

A Podocyte-Based Automated Screening Assay Identifies Protective Small Molecules

Affiliations

A Podocyte-Based Automated Screening Assay Identifies Protective Small Molecules

Ha Won Lee et al. J Am Soc Nephrol. 2015 Nov.

Abstract

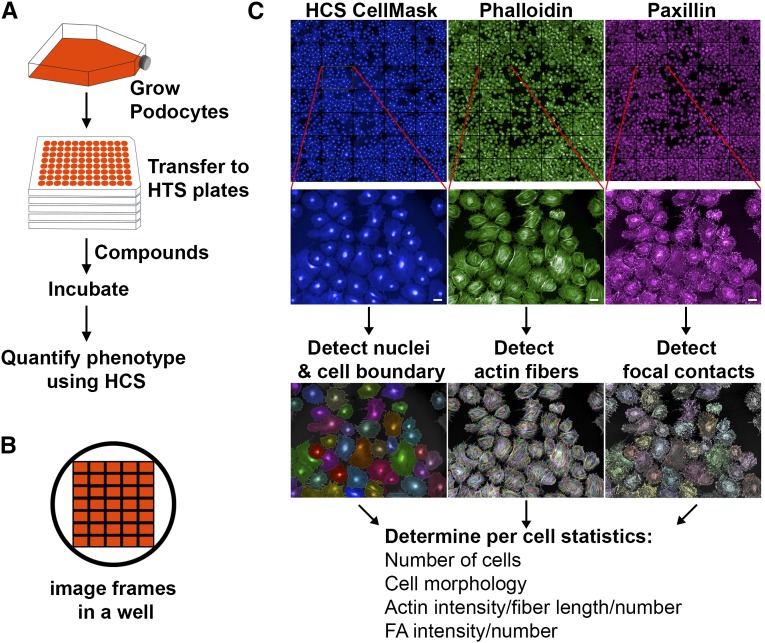
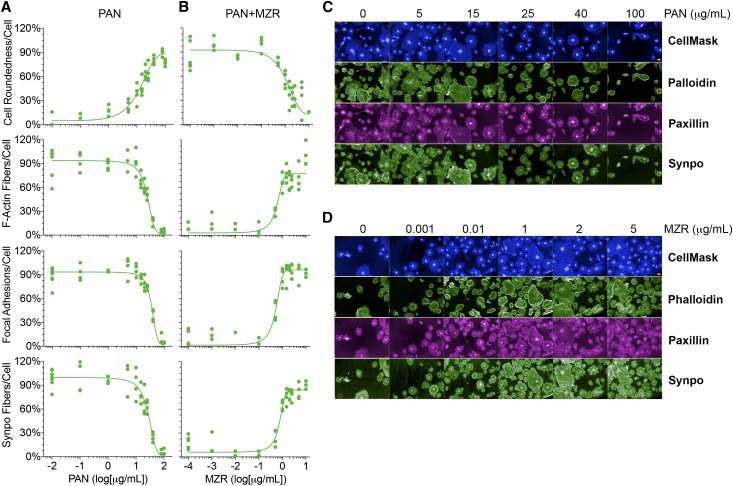
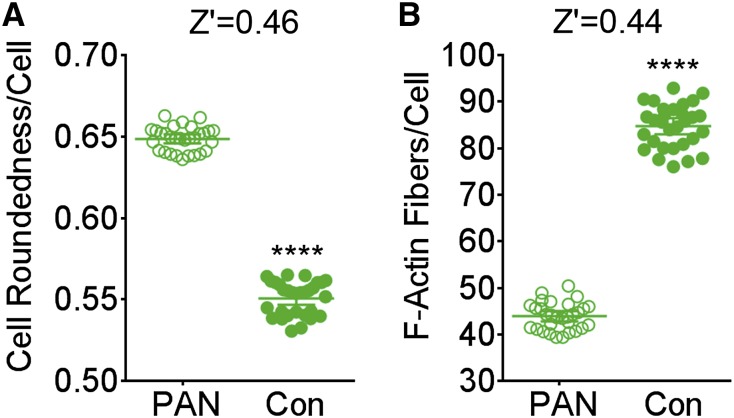
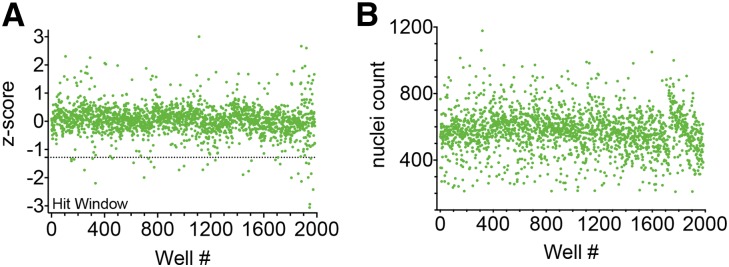
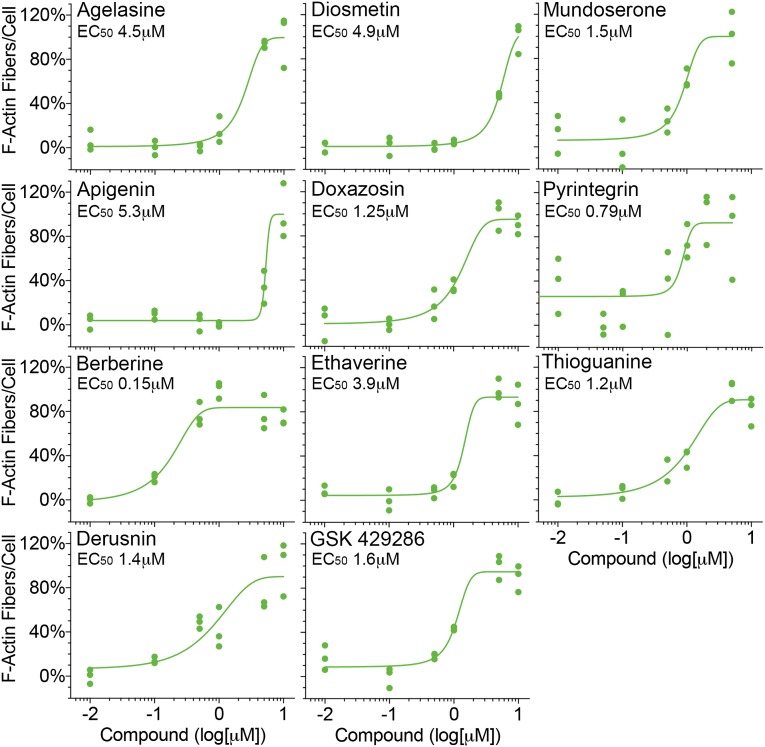
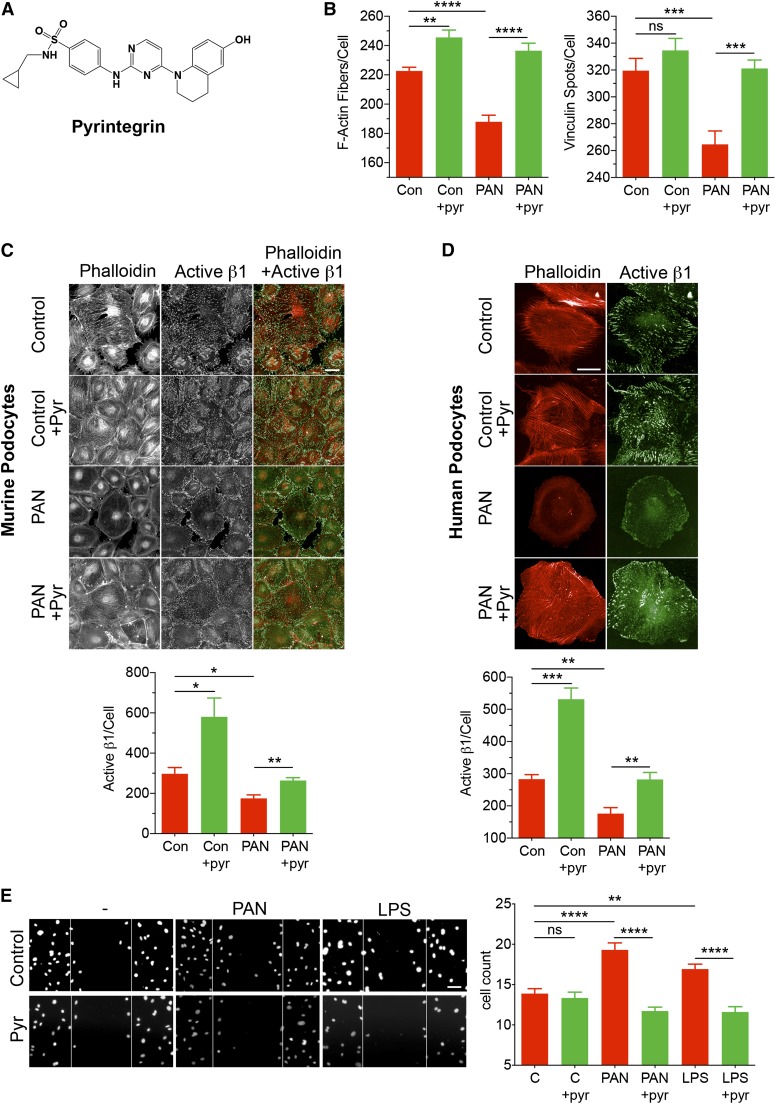
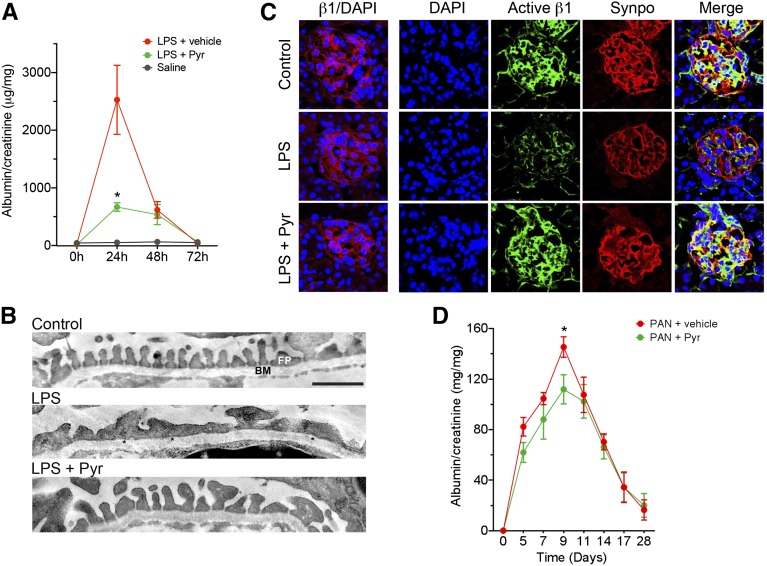
Podocyte injury and loss mark an early step in the pathogenesis of various glomerular diseases, making these cells excellent targets for therapeutics. However, cell-based high-throughput screening assays for the rational development of podocyte-directed therapeutics are currently lacking. Here, we describe a novel high-content screening-based phenotypic assay that analyzes thousands of podocytes per assay condition in 96-well plates to quantitatively measure dose-dependent changes in multiple cellular features. Our assay consistently produced a Z' value >0.44, making it suitable for compound screening. On screening with >2100 pharmacologically active agents, we identified 24 small molecules that protected podocytes against injury in vitro (1% hit rate). Among the identified hits, we confirmed an β1-integrin agonist, pyrintegrin, as a podocyte-protective agent. Treatment with pyrintegrin prevented damage-induced decreases in F-actin stress fibers, focal adhesions, and active β1-integrin levels in cultured cells. In vivo, administration of pyrintegrin protected mice from LPS-induced podocyte foot process effacement and proteinuria. Analysis of the murine glomeruli showed that LPS administration reduced the levels of active β1 integrin in the podocytes, which was prevented by cotreatment with pyrintegrin. In rats, pyrintegrin reduced peak proteinuria caused by puromycin aminonucleoside-induced nephropathy. Our findings identify pyrintegrin as a potential therapeutic candidate and show the use of podocyte-based screening assays for identifying novel therapeutics for proteinuric kidney diseases.

Keywords: adhesion molecule; glomerular disease; glomerular epithelial cells.


Figures

Figure 1.
Figure 1.
High content imaging and automated analysis can be used to design a podocyte phenotypic assay. (A) Schematic of the assay design. Immortalized podocytes were proliferated under permissive conditions (33°C) in large tissue culture flasks and thermoshifted to 37°C to induce differentiation according to published protocols., After 7 days in large flasks, cells were trypsinized, counted, and transferred to multiwell plates, and they were further cultured at 37°C for another 4 days and subsequently used in an HCS assay. (B) Schematic of a well of a 96-well optical plate and the layout of various imaging frames that were typically captured using an HCS imaging system. (C) HCS–based image analysis of a podocyte phenotypic assay. Podocytes in multiwell optical plates were washed, fixed with paraformaldehyde, fluorescently stained with various markers, and imaged using a PerkinElmer Opera HCS microscope. Images show a representative composite montage of multiple frames (three different channels) from a well of an optical multiwell plate after staining podocytes with HCS CellMask Blue, phallodin, and paxillin, which are labeled with different fluorophores. Zoomed-in images from single frames are shown below. Automated detection of nuclei and assignment of cellular regions to nuclei were performed (using Columbus Analysis System) from the segmented CellMask Blue images. Morphology properties were then calculated to determine cell area and roundness. Images from phalloidin-stained cells were used to identify actin fibers, and from cells stained with antipaxillin (or antivinculin), antibodies were used to find focal adhesions (FA). Subsequently, the detected nuclei and cell regions were merged with the detected actin fibers and focal adhesions to quantify the various phenotypic parameters on a per-cell basis. Scale bar, 50 μm.
Figure 2.
Figure 2.
The novel assay quantitatively measures phenotypic changes in podocytes. (A) PAN induces dose–dependent podocyte damage. Podocytes in 96-well optical plates were treated with an increasing dose of PAN at 37°C for 48 hours, and the cellular damage was assessed on staining podocytes with CellMask Blue (to measure cell morphology), phalloidin (to quantify F-actin fibers), anti-paxillin antibody (to quantify focal adhesions), and anti-synaptopodin (anti-synpo) antibody (to quantify synaptopodin levels) and analyzing them using the newly developed HCS assay. Dose-response curves showing the effects of increasing concentrations of PAN on four different cellular parameters (cell morphology [as defined by cell roundness], the number of actin fibers per cell, the number of focal adhesions per cell, and the number of synpo fibers per cell) as a way to measure PAN–induced podocyte injury. The x axis represents PAN concentration, and the y axis shows quantification of each of four parameters at a defined dose of PAN. Data shown are means±SEMs per cell from a single-assay well (n=500–1000 cells) performed in three replicate wells. (B) MZR dose dependently protects podocyte from PAN injury. Podocytes in 96-well optical plates were cotreated with PAN (30 μg/ml) and an increasing concentration of MZR at 37°C for 48 hours, and the cellular damage was assessed using an HCS system. Dose-response curves showing the protective effects of increasing concentration of MZR on various cellular parameters (as with PAN treatment) are presented. Data shown are means±SEMs per cell from a single-assay well (n=500–1000 cells) performed in three replicate wells. (C) Representative fluorescence images of cells treated with increasing doses of PAN (as shown), stained with CellMask Blue, phalloidin, antipaxillin antibody, or antisynpo antibody, and quantified as shown in A. Scale bar, 50 μm. (D) Representative fluorescence images of cells cotreated with PAN (30 μg/ml) and an increasing dose of MZR (as shown), stained with CellMask Blue, phalloidin, anti-paxillin antibody, or anti-synpo antibody, and quantified as shown in B. Scale bar, 50 μm.
Figure 3.
Figure 3.
Podocyte phenotypic assay has low variability. Graphs showing analysis of assay variability of the newly developed podocyte cell–based assay using automated microscope–based quantification of (A) cell roundness (morphology) or (B) F-actin fibers. Each graph shows quantified per-cell parameters from individual wells per condition (n=500–1000 cells per well) and the calculated means±95% confidence intervals across 30 wells and is representative of at least two independent assays. The calculated Z' value between cells treated with PAN alone (damaged) or media alone (Con) is also shown. In both types of analyses, Z' value is >0.44. ****P<0.001.
Figure 4.
Figure 4.
HCS assay using a library of bioactive compounds identifies novel podocyte-protective agents. (A) A graph showing results from the screening of a chemical library using the podocyte HCS assay. Podocytes in 96-well optical plates were treated with PAN (16 μg/ml) at 37°C for 48 hours, and 2121 pharmacologically active compounds were screened against it in the phenotypic assay. Each data point represents measured activity of each compound on cell roundness phenotype and its calculated Z score (Z score=0 means inactive compound, a positive value represents compounds that produce worse phenotypes, and a negative Z score represents active compounds). A dotted line marks the Z-score threshold of ≤−1.28 that was applied to obtain 34 primary hits in the hit window. Visual confirmation led to a final list of 24 active compounds. (B) A graph showing the nuclei count in each of the assay wells from the primary screen presented in A. Compounds resulting in a nuclei count of <200 were removed from the analyses as potentially cytotoxic agents.
Figure 5.
Figure 5.
Independent assays with select primary hits show dose-dependent protection of podocytes, confirming their validity as a hit. Graphs showing dose-dependent protection of podocytes from PAN injury by compounds identified in the primary screen. The name of each of the selected active compounds is shown on each graph. Podocytes in 96-well optical plates were incubated with PAN (16 μg/ml) at 37°C for 48 hours in the presence of increasing doses of each of the selected compounds, and the cellular damage was quantified by measuring change in F-actin fibers per cell. F-actin fiber counts from podocytes treated with PAN alone (16 μg/ml; negative control) or PAN (16 μg/ml) and MZR (5 μg/ml; positive control) were set at 0% and 100%, respectively, to normalize the data. Each data point on the graphs represents normalized per-cell F-actin fiber count from individual wells per condition (n=500–1000 cells per well). Curve fitting was used to calculate apparent half–maximal effective concentration (EC50) values (green line) and shows a dose-dependent protection of podocytes from PAN damage by each compound.
Figure 6.
Figure 6.
An β1-integrin agonist pyrintegrin (pyr) protects podocytes from damage. (A) The published chemical structure of pyr. (B–D) Pyr protects podocytes from PAN-induced loss of F-actin fibers and focal adhesions and enhances active β1-integrin levels. Podocytes in 96-well optical plates were cultured at 37°C for 48 hours in the absence (control [Con]) or presence of PAN (30 μg/ml) and cotreated with vehicle (DMSO; 1%) or pyr (1 μM). The cellular damage was assessed after staining the cells with phalloidin, anti-vinculin, and anti-active β1-integrin antibodies and quantified using the HCS system. (B) Graphs showing the effect of pyr on the number of F-actin fibers per cell and the number of vinculin spots per cell under each treatment condition. Data shown are means±SEMs per cell from three replicate wells (n=500–1000 cells per well). **P<0.01; ***P<0.001; ****P<0.001. (C) Representative fluorescence images of murine podocytes after various treatments and after staining with phalloidin and antiactive β1 antibody. Two–color costained images show cells stained with phalloidin (red) and anti-active β1 antibody 9EG7 (green). Images were acquired using the Opera HCS System. The graph (lower panel) shows quantification of the active β1-integrin spot intensity per cell under each treatment condition. Data shown are means±SEMs per cell from four to five replicate wells (n=500–1000 cells per well). Scale bar, 50 μm. *P<0.01; **P<0.001. (D) Representative fluorescence images of human podocytes after various treatments as shown. Images show cells stained with phalloidin (red) and anti-active β1-integrin antibody 12G10 (green). Images were acquired using the Opera HCS System. The graph (lower panel) shows quantification of the active β1-integrin spots per cell under each treatment condition. Data shown are medians±SEMs per cell from four to five replicate wells (n=500–1000 cells per well). Scale bar, 50 μm. **P<0.01; ***P<0.001. (E) Pyr reduces injury-mediated increase in podocyte migration in a scratch wound–healing assay. Representative images (left panel) and a bar graph (right panel) showing confocal microscopy–based quantitation of the number of migrating podocytes in a scratch wound–healing assay. Wounds were created in podocyte monolayers using sterile pipette tips, and the cells were incubated in the absence (−) or presence of PAN or LPS at 37°C for 48 hours. One set of wounds was cotreated with pyr. Subsequently, cells were fixed and stained with 4′,6-diamidino-2-phenylindole (DAPI), and the cells migrating inside the edge of the wounds were quantified. Lines represent the wound margins at the beginning of the experiment (0 hours). The data presented in the graph are plotted as means±SEMs (n≥15). C, control. Scale bar, 50 μm. **P<0.01; ****P<0.001.
Figure 7.
Figure 7.
β1-Integrin agonist protects animals against proteinuria. (A–C) Pyrintegrin (Pyr) protects mice from LPS-induced proteinuria. (A) Graph showing the ratio of albumin to creatinine in the urine of mice at the indicated time points after LPS administration and treatment with either Pyr (LPS+Pyr) or vehicle alone (LPS+vehicle). Control animals were administered saline alone. Data shown are means±SEMs (n=6–13 per group). *P<0.05. (B) Pyr protects against LPS–induced podocyte FP effacement. Representative electron microscopy image of mouse glomeruli treated with saline alone (control), LPS and vehicle (LPS), or LPS and Pyr (LPS+Pyr). *Effaced FPs in LPS-treated sections. BM, basement membrane. Scale bar, 1 μm. (C) Pyr preserves the level of active β1-integrin expression in the glomeruli. Representative confocal microscopy images of immunofluorescently labeled glomeruli from animals 24 hours after LPS administration. Frozen kidney sections from animals treated with saline alone (control), LPS and vehicle (LPS) or LPS and Pyr (LPS+Pyr) were imaged after staining with 4′,6-diamidino-2-phenylindole (DAPI) and antibodies against total β1 integrin (β1/DAPI), active β1 integrin (active β1), or synaptopodin (synpo). Merged active β1 and synpo channels are also shown (merge column). Scale bar, 25 μm. (D) Pyr protects rats from PAN-induced nephropathy. Graph showing the ratio of albumin to creatinine in the urine of rats at the indicated time points after PAN administration and treatment with either Pyr (PAN+Pyr) or vehicle alone (PAN+vehicle). Data shown are means±SEMs (n=4–6 per group). *P<0.05.

References

    1. Pavenstädt H, Kriz W, Kretzler M: Cell biology of the glomerular podocyte. Physiol Rev 83: 253–307, 2003 - PubMed
    1. Faul C, Asanuma K, Yanagida-Asanuma E, Kim K, Mundel P: Actin up: Regulation of podocyte structure and function by components of the actin cytoskeleton. Trends Cell Biol 17: 428–437, 2007 - PubMed
    1. Huber TB, Benzing T: The slit diaphragm: A signaling platform to regulate podocyte function. Curr Opin Nephrol Hypertens 14: 211–216, 2005 - PubMed
    1. Reiser J, Sever S: Podocyte biology and pathogenesis of kidney disease. Annu Rev Med 64: 357–366, 2013 - PMC - PubMed
    1. Wiggins RC: The spectrum of podocytopathies: A unifying view of glomerular diseases. Kidney Int 71: 1205–1214, 2007 - PubMed

Publication types

MeSH terms

LinkOut - more resources