. 2015 Apr 24;348(6233):aaa6090.
doi: 10.1126/science.aaa6090. Epub 2015 Apr 9.

RNA imaging. Spatially resolved, highly multiplexed RNA profiling in single cells

Affiliations

RNA imaging. Spatially resolved, highly multiplexed RNA profiling in single cells

Kok Hao Chen et al. Science. .

Abstract

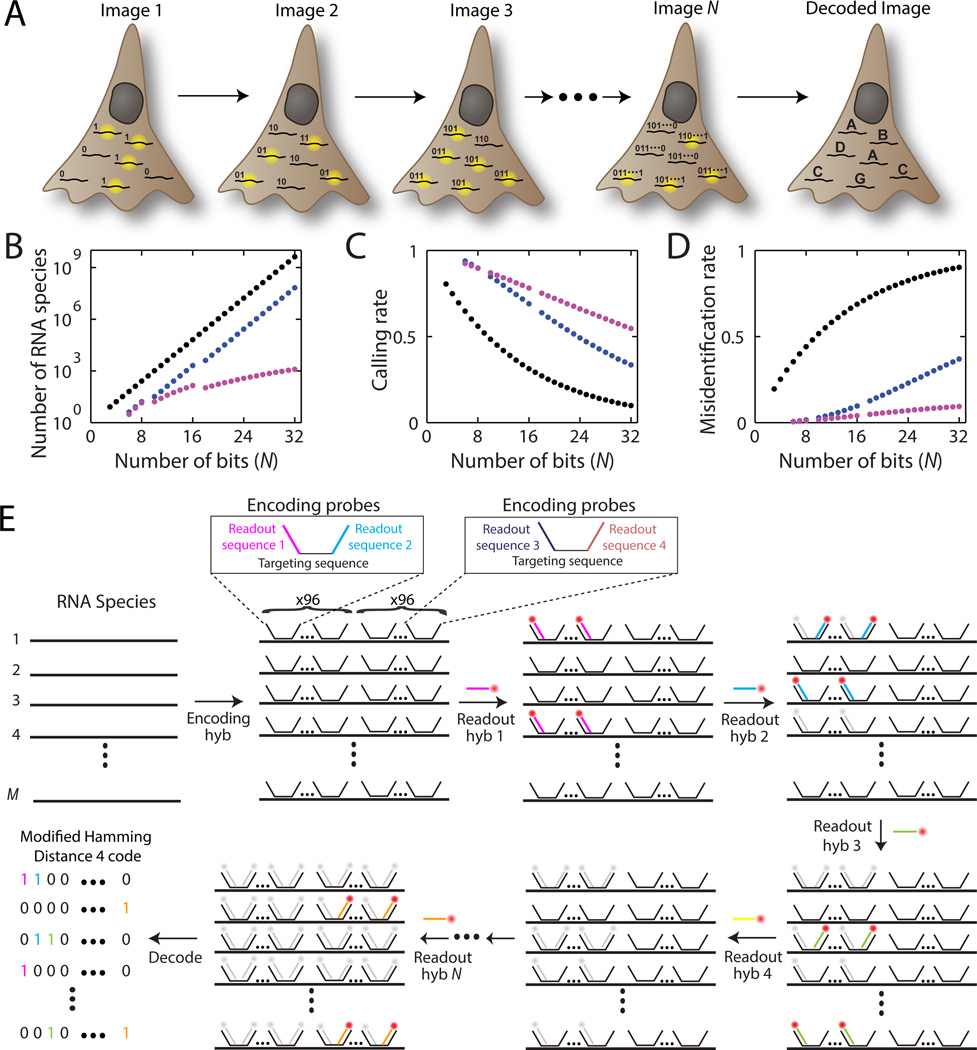
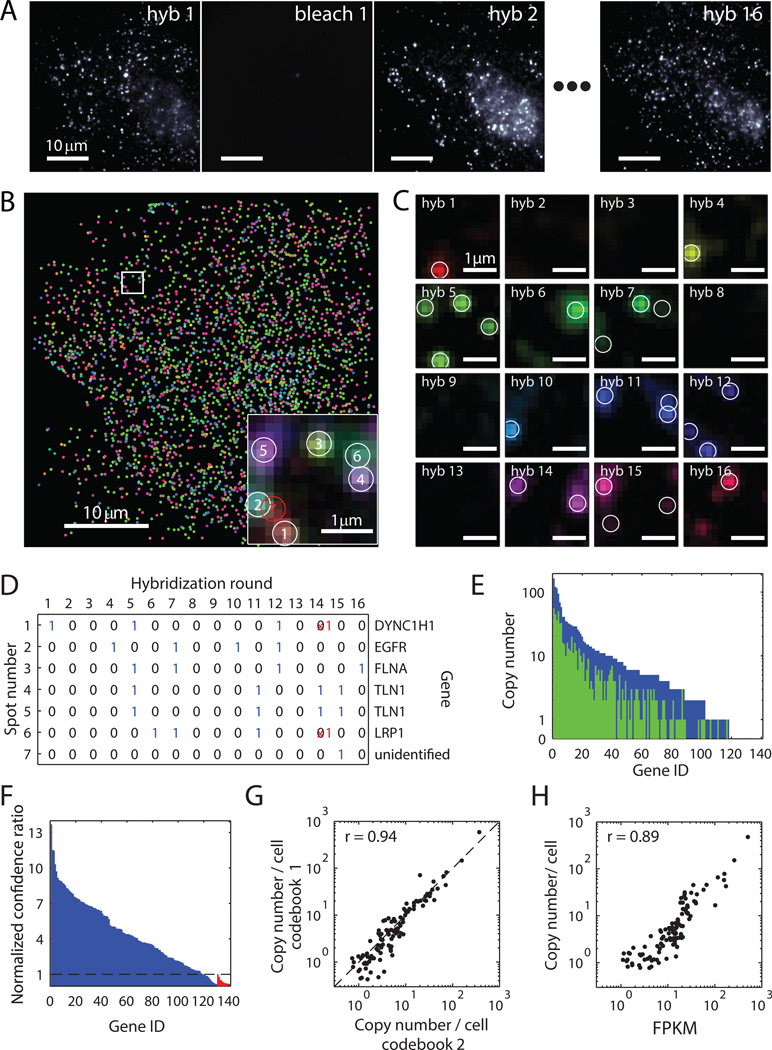
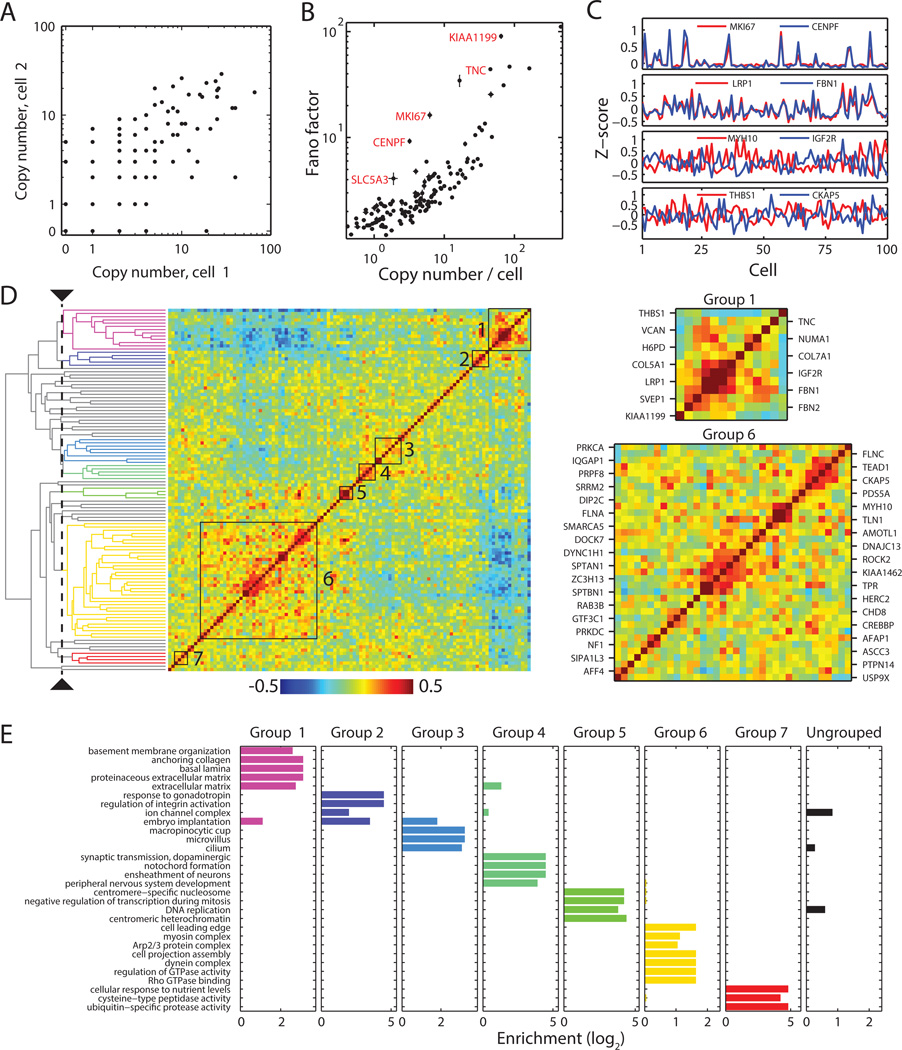
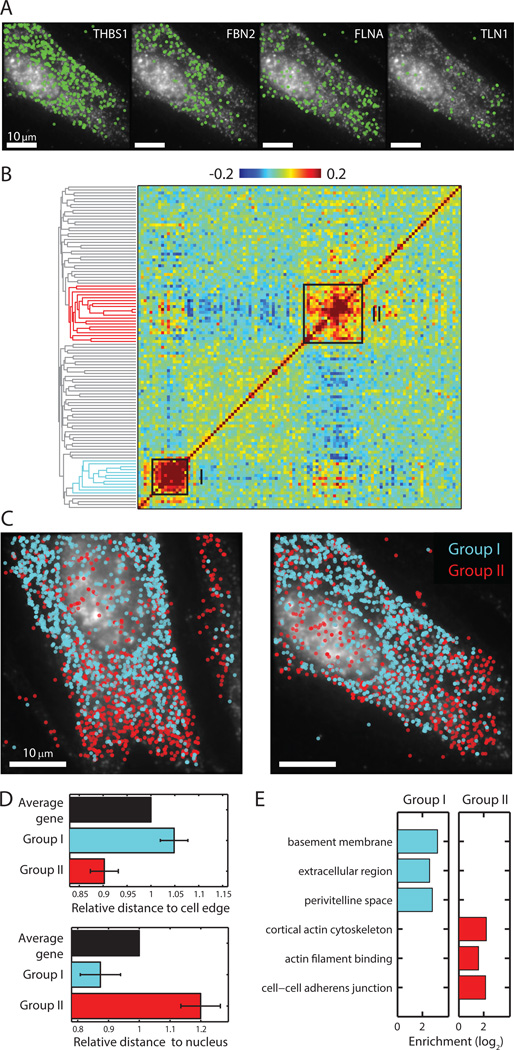
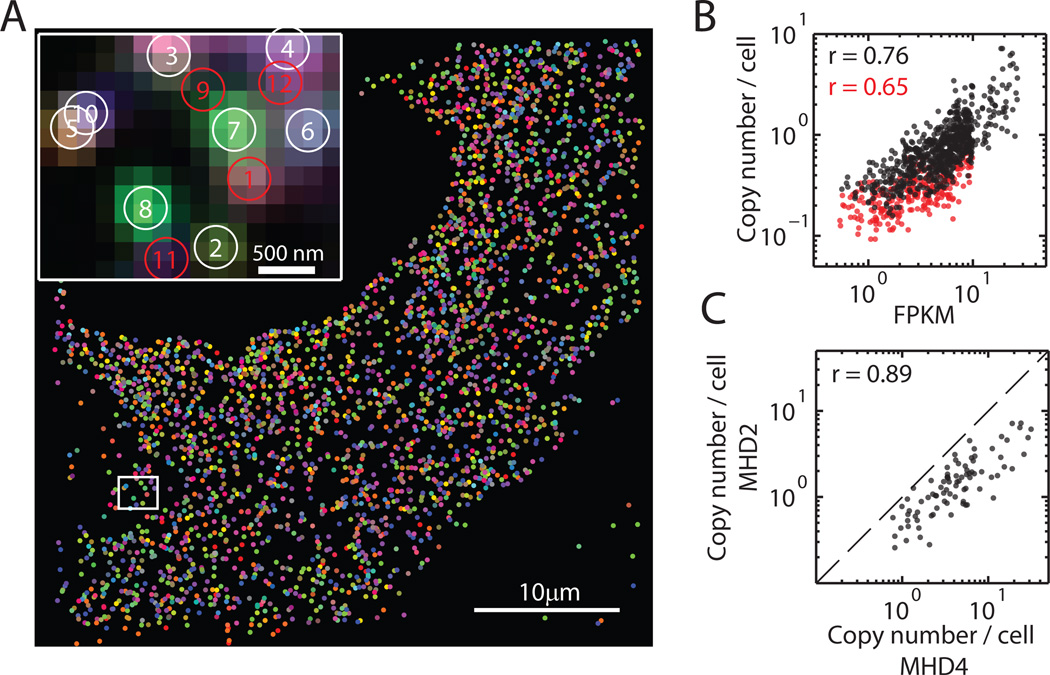
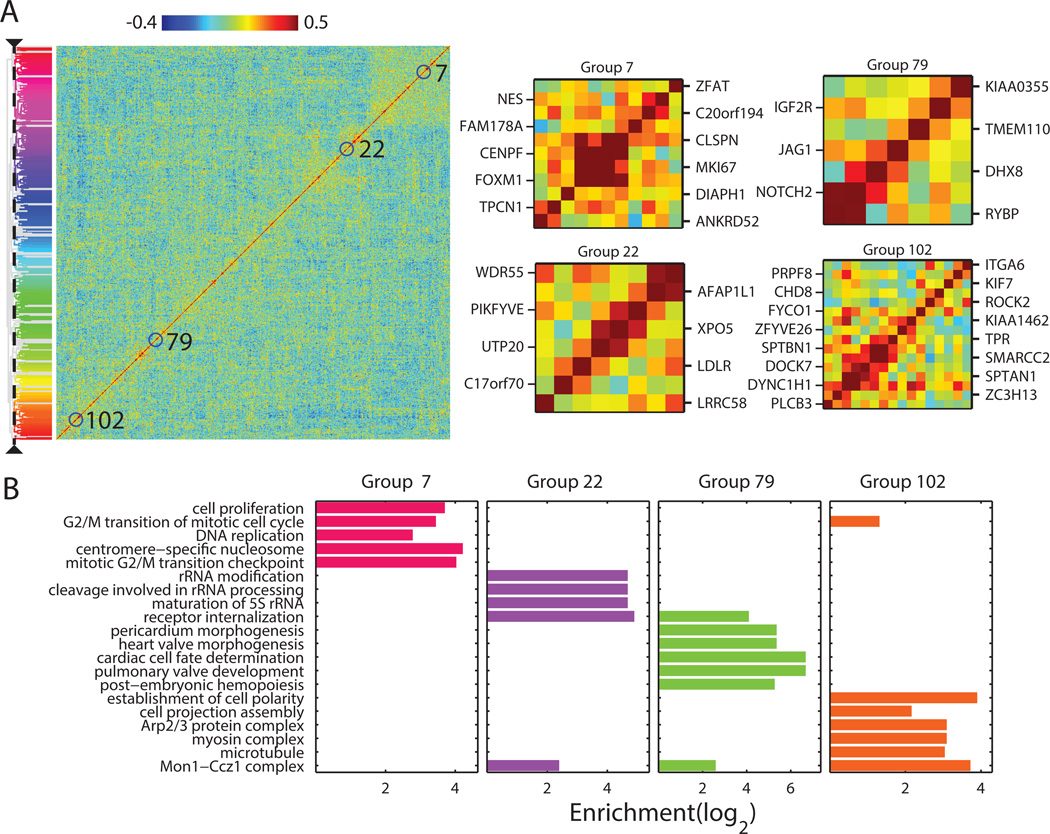
Knowledge of the expression profile and spatial landscape of the transcriptome in individual cells is essential for understanding the rich repertoire of cellular behaviors. Here, we report multiplexed error-robust fluorescence in situ hybridization (MERFISH), a single-molecule imaging approach that allows the copy numbers and spatial localizations of thousands of RNA species to be determined in single cells. Using error-robust encoding schemes to combat single-molecule labeling and detection errors, we demonstrated the imaging of 100 to 1000 distinct RNA species in hundreds of individual cells. Correlation analysis of the ~10(4) to 10(6) pairs of genes allowed us to constrain gene regulatory networks, predict novel functions for many unannotated genes, and identify distinct spatial distribution patterns of RNAs that correlate with properties of the encoded proteins.


Figures

Fig. 1
Fig. 1. MERFISH: a highly multiplexed smFISH approach enabled by combinatorial labeling and error-robust encoding
(A) Schematic depiction of the identification of multiple RNA species in N rounds of imaging. Each RNA species is encoded with a N-bit binary word and during each round of imaging, only the subset of RNAs that should read ‘1’ in the corresponding bit emit signal. (B–D) The number of addressable RNA species (B), the rate at which these RNAs are properly identified – calling rate (C), and the rate at which RNAs are incorrectly identified as a different RNA species – misidentification rate (D) plotted as a function of the number of bits (N) in the binary words encoding RNA. Black, a simple binary code that includes all 2N−1 possible binary words. Blue, the HD4 code where the Hamming distance separating words is 4. Magenta, the modified HD4 (MHD4) code where the number of ‘1’ bits are kept at four. The calling and misidentification rates are calculated with per bit error rates of 10% for the 1→0 error and 4% for the 0→1 error. (E) Schematic diagram of the implementation of a MHD4 code for RNA identification. Each RNA species is first labeled with ~192 encoding probes that convert the RNA into a unique combination of readout sequences (Encoding hyb). These encoding probes each contain a central RNA targeting region flanked by two readout sequences, drawn from a pool of N different sequences, each associated with a specific hybridization round. Encoding probes for a specific RNA species contain a unique combination of four of the N readout sequences, which correspond to the four hybridization rounds where this RNA should read ‘1’. N subsequent rounds of hybridization with the fluorescent readout probes are used to probe the readout sequences (hyb 1, hyb 2, …, hyb N). The bound probes are inactivated by photobleaching between successive rounds of hybridization. For clarity only one possible pairing of the readout sequences is depicted for the encoding probes; however, all possible pairs of the four readout sequences are used at the same frequency and distributed randomly along each cellular RNA in the actual experiments.
Fig. 2
Fig. 2. Simultaneous measurement of 140 RNA species in single cells using MERFISH with a 16-bit MHD4 code
(A) Images of RNA molecules in an IMR90 cell after each hybridization round (hyb 1 – hyb 16). The image after photobleaching (bleach 1) demonstrates efficient removal of fluorescent signals between hybridizations. (B) The localizations of all detected single molecules in this cell colored based on their measured binary words. Inset: the composite, false-colored fluorescent image of the 16 hybridization rounds for the boxed sub-region with numbered circles indicating potential RNA molecules. A red circle indicates an unidentifiable molecule, the binary word of which does not match any of the 16-bit MHD4 code words even after error correction. (C) Fluorescent images from each round of hybridization for the boxed sub-region in (B) with circles indicating potential RNA molecules. (D) Corresponding words for the spots identified in (C). Red crosses represent the corrected bits. (E) The RNA copy number for each gene observed without (green) or with (blue) error correction in this cell. (F) The confidence ratio measured for the 130 RNA species (blue) and the 10 misidentification control words (red) normalized to the maximum value observed from the misidentification controls (dashed line). (G) Scatter plot of the average copy number of each RNA species per cell measured with two shuffled codebooks of the MHD4 code. The Pearson correlation coefficient is 0.94 with a p-value of 1×10−53. The dashed line corresponds to the y = x line. (H) Scatter plot of the average copy number of each RNA species per cell versus the abundance determined by bulk sequencing in fragments per kilobase per million reads (FPKM). The Pearson correlation coefficient between the logarithmic abundances of the two measurements was 0.89 with a p-value of 3×10−39.
Fig. 3
Fig. 3. Cell-to-cell variations and pairwise correlations for the RNA species determined from the 140 gene-measurements
(A) Comparison of gene expression levels in two individual cells. (B) Fano factors for individual genes. Error bars represent standard error of the mean determined from 7 independent data sets. (C) Z-scores of the expression variations of four example pairs of genes showing correlated (top two) or anti-correlated (bottom two) variation for 100 randomly selected cells. Z-score is defined as the difference from the mean normalized by the standard deviation. (D) Matrix of the pairwise correlation coefficients of the cell-to-cell variation in expression for the measured genes, shown together with the hierarchical clustering tree. The seven groups identified by a specific threshold on the cluster tree (dashed line) are indicated by the black boxes in the matrix and colored lines on the tree, with grey lines on the tree indicating ungrouped genes. Different threshold choices on the cluster tree could be made to select either smaller subgroups with tighter correlations or larger super-groups containing more weakly coupled subgroups. Two of the seven groups are enlarged on the right. (E) Enrichment of 30 selected, statistically significantly enriched GO terms in the seven groups. Enrichment refers to the ratio of the fraction of genes within a group that have the specific GO term to the fraction of all measured genes having that term. Top 10 statistically significantly enriched GO terms for each of the seven groups are shown in Table S2. Not all of the GO terms presented here are in the top 10 list.
Fig. 4
Fig. 4. Distinct spatial distributions of RNAs observed in the 140-gene measurements
(A) Examples of the spatial distributions observed for four different RNA species in a cell. (B) Matrix of the pairwise correlation coefficients describing the degree with which the spatial distributions of each gene pair is correlated, shown together with the hierarchical clustering tree. Two strongly correlating groups are indicated by the black boxes on the matrix and color on the tree. (C) The spatial distributions of all RNAs in the two groups in two example cells. Cyan symbols: group I genes; Red symbols: group II genes. (D) Average distances for genes in group I and genes in group II to the cell edge or the nucleus normalized to the average distances for all genes. Error bars represent SEM across 7 data sets. (E) Enrichment of GO terms in each of the two groups.
Fig. 5
Fig. 5. Simultaneous measurements of 1001 RNA species in single cells using MERFISH with a 14-bit MHD2 code
(A) The localizations of all detected single molecules in a cell colored based on their measured binary words. Inset: the composite, false-colored fluorescent image of the 14 hybridization rounds for the boxed sub-region with numbered circles indicating potential RNA molecules. Red circles indicate unidentifiable molecules, the binary words of which do not match any of the 14-bit MHD2 code words. Images of individual hybridization round are shown in Fig. S9A. (B) Scatter plot of the average copy number per cell measured in the 1001-gene experiments versus the abundance measured via bulk sequencing. The black symbols are for the 73% of genes detected with confidence ratios higher than the maximum ratio observed for the misidentification controls. The Pearson correlation coefficient is 0.76 with a p-value of 3×10−133. The red symbols are for the remaining 27% of genes. The Pearson correlation coefficient is 0.65 with a p-value of 3×10⁻³³. (C) Scatter plot of the average copy number for the 107 genes shared in both the 1001-gene measurement with the MHD2 code and the 140-gene measurement with the MHD4 code. The Pearson correlation coefficient is 0.89 with a p-value of 9×10⁻³⁰. The dashed line is correspond to the y = x line.
Fig. 6
Fig. 6. Co-variation analysis of the RNA species measured in the 1001-gene measurements
(A) Matrix of all pairwise correlation coefficients of the cell-to-cell variation in expression for the measured genes shown with the hierarchical clustering tree. The ~100 identified groups of correlated genes are indicated by color on the tree. Zoom in of four of the groups described in the text are shown on the right. (B) Enrichment of 20 selected, statistically significantly enriched GO terms in the four groups. The statistically most significantly enriched GO terms (maximum 10) for each of the ~100 groups are shown in Table S4.

Comment in

Similar articles

Cited by

References

    1. Crosetto N, Bienko M, van Oudenaarden A. Spatially resolved transcriptomics and beyond. Nat Rev Genet. 2015;16:57–66. - PubMed
    1. Femino AM, Fay FS, Fogarty K, Singer RH. Visualization of single RNA transcripts in situ. Science. 1998;280:585–590. - PubMed
    1. Raj A, van Den Bogaard P, Rifkin S, van Oudenaarden A, Tyagi S. Imaging individual mRNA molecules using multiple singly labeled probes. Nat. Methods. 2008;5:877–879. - PMC - PubMed
    1. Rodriguez AJ, Czaplinski K, Condeelis JS, Singer RH. Mechanisms and cellular roles of local protein synthesis in mammalian cells. Curr. Opin. Cell Biol. 2008;20:144–149. - PMC - PubMed
    1. Balagopal V, Parker R. Polysomes, P bodies and stress granules: states and fates of eukaryotic mRNAs. Curr. Opin. Cell Biol. 2009;21:403–408. - PMC - PubMed

Publication types

Associated data