

Thymoquinone, the main constituent of Nigella sativa, affects adenosine receptors in asthmatic guinea pigs
- PMID: 25859306
- PMCID: PMC4387224
Thymoquinone, the main constituent of Nigella sativa, affects adenosine receptors in asthmatic guinea pigs
Abstract
Objectives: For determining the mechanism of anti-asthmatic effect of thymoquinone, this investigation evaluated the effect of thymoquinone in the presence of selective A2A and A2B adenosine receptor antagonists (ZM241385 and MRS1706, respectively).
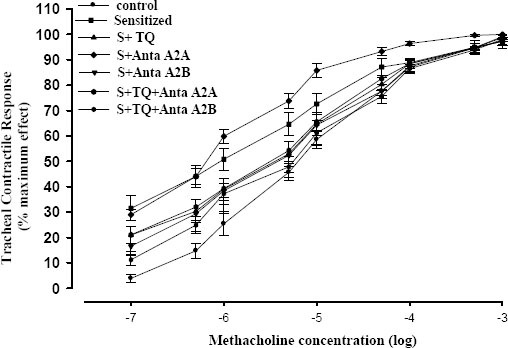
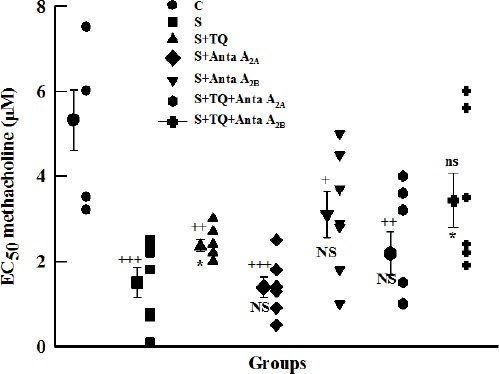
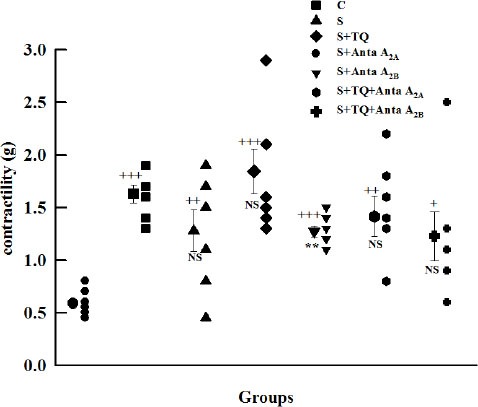
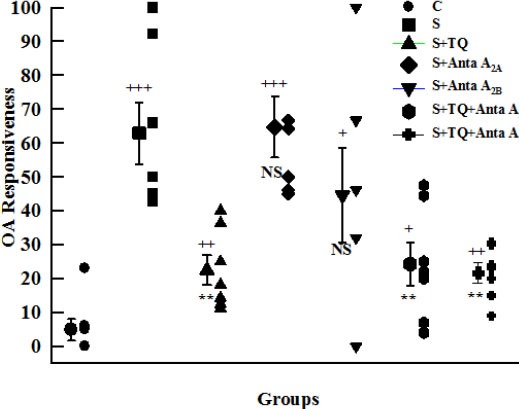
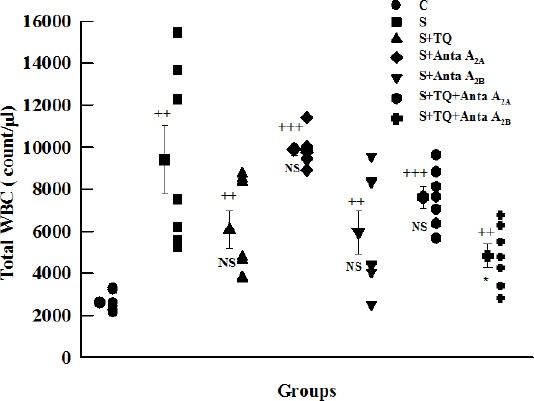
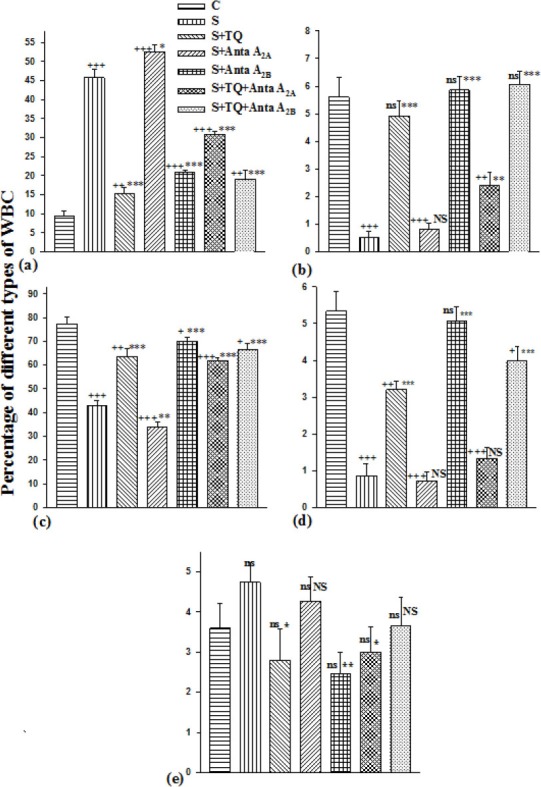
Materials and methods: Seventy guinea pigs were randomly divided to 7 groups; control (C), sensitized with ovalbumin (S), sensitized groups pretreated with thymoquinone (S+TQ), ZM241385 (S+Anta A2A), MRS1706 (S+Anta A2B), thymoquinone and antagonists (S+Anta A2A+TQ and S+Anta A2B+TQ). Thymoquinone and each of these antagonists with 3 mg/kg dose were injected i.p. on 10(th) day of sensitization protocol. Tracheal responsiveness (TR) to methacholine and ovalbumin (OA), and total and differential cell count in lung lavage fluid (LLF) in different groups were measured.
Results: Increased EC50 and LLF neutrophil count and decreased TR to methacholine and OA, LLF eosinophil and basophil counts were observed in S+TQ group compared to S group (P<0.001 to P<0.05). Significant decrease in EC50 (P<0.01), LLF neutrophil, lymphocyte and monocyte count (P<0.001 for all) and significant increase in TR to OA (P<0.01), LLF total WBC (P<0.01) and eosinophil count (P<0.001) were observed in S+A2A group compared to S+TQ group. There was significant increase in LLF eosinophil and monocyte counts in S+Anta A2B group compared with S+TQ group (P<0.001 for both). In S+TQ+Anta A2A group, there was significant increase in LLF eosinophil (P<0.001) and significant decrease in LLF neutrophil (P<0.01) and monocyte (P<0.001) counts compared with S+TQ group.
Conclusion: Thymoquinone affects adenosine receptors, which suggest that some of its anti-inflammatory effects may be mediated by these receptors.
Keywords: Adenosine receptor; Asthma; MRS1706; Thymoquinone; ZM241385.
Figures
Similar articles
-
The Effect of Adenosine A2A and A2B Antagonists on Tracheal Responsiveness, Serum Levels of Cytokines and Lung Inflammation in Guinea Pig Model of Asthma.Adv Pharm Bull. 2014;4(2):131-8. doi: 10.5681/apb.2014.020. Epub 2013 Dec 24. Adv Pharm Bull. 2014. PMID: 24511476 Free PMC article.
-
The effect of thymoquinone, the main constituent of Nigella sativa on tracheal responsiveness and white blood cell count in lung lavage of sensitized guinea pigs.Planta Med. 2010 Feb;76(3):218-22. doi: 10.1055/s-0029-1186054. Epub 2009 Aug 26. Planta Med. 2010. PMID: 19711253
-
The protective effect of α-hederin, the active constituent of Nigella sativa, on tracheal responsiveness and lung inflammation in ovalbumin-sensitized guinea pigs.J Physiol Sci. 2015 May;65(3):285-92. doi: 10.1007/s12576-015-0367-6. Epub 2015 Mar 10. J Physiol Sci. 2015. PMID: 25752254 Free PMC article.
-
Nigella sativa and Thymoquinone: A Natural Blessing for Periodontal Therapy.Antioxidants (Basel). 2020 Dec 11;9(12):1260. doi: 10.3390/antiox9121260. Antioxidants (Basel). 2020. PMID: 33322636 Free PMC article. Review.
-
Thymoquinone a Potential Therapeutic Molecule from the Plant Nigella sativa: Role of Colloidal Carriers in its Effective Delivery.Recent Pat Drug Deliv Formul. 2018;12(1):3-22. doi: 10.2174/1872211311666171129121128. Recent Pat Drug Deliv Formul. 2018. PMID: 29189187 Review.
Cited by
-
Early and late preventive effect of Nigella sativa on the bleomycin-induced pulmonary fibrosis in rats: An experimental study.Avicenna J Phytomed. 2018 May-Jun;8(3):263-275. Avicenna J Phytomed. 2018. PMID: 29881712 Free PMC article.
-
Hydroxysafflor Yellow A Alleviates Ovalbumin-Induced Asthma in a Guinea Pig Model by Attenuateing the Expression of Inflammatory Cytokines and Signal Transduction.Front Pharmacol. 2019 Apr 5;10:328. doi: 10.3389/fphar.2019.00328. eCollection 2019. Front Pharmacol. 2019. PMID: 31024302 Free PMC article.
-
Protective Effects of Thymoquinon on Pulmonary Disorders in Experimental Studies.Tanaffos. 2018 Oct;17(4):211-222. Tanaffos. 2018. PMID: 31143211 Free PMC article. Review.
References
-
- Keir S, Page C. The rabbit a model to study asthma and other lung diseases. Pulm Pharmacol Ther. 2008;21:721–730. - PubMed
-
- Spicuzza L, Di Maria G, Polosa R. Adenosine in the airways: implications and applications. Eur J Pharm Biopharm. 2006;533:77–88. - PubMed
-
- Mansour M, Tornhamre S. Inhibition of 5-lipoxygenase and leukotriene C4 synthase in human blood cells by thymoquinone. J Enzyme Inhib Med Chem. 2004;19:431–436. - PubMed
LinkOut - more resources
Full Text Sources