

Uses of NHANES Biomarker Data for Chemical Risk Assessment: Trends, Challenges, and Opportunities
- PMID: 25859901
- PMCID: PMC4590763
- DOI: 10.1289/ehp.1409177
Uses of NHANES Biomarker Data for Chemical Risk Assessment: Trends, Challenges, and Opportunities
Abstract
Background: Each year, the U.S. NHANES measures hundreds of chemical biomarkers in samples from thousands of study participants. These biomarker measurements are used to establish population reference ranges, track exposure trends, identify population subsets with elevated exposures, and prioritize research needs. There is now interest in further utilizing the NHANES data to inform chemical risk assessments.
Objectives: This article highlights a) the extent to which U.S. NHANES chemical biomarker data have been evaluated, b) groups of chemicals that have been studied, c) data analysis approaches and challenges, and d) opportunities for using these data to inform risk assessments.
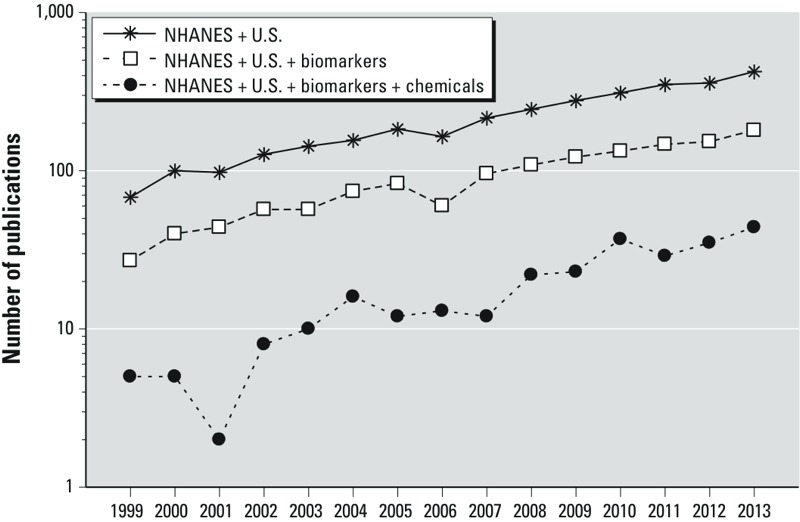
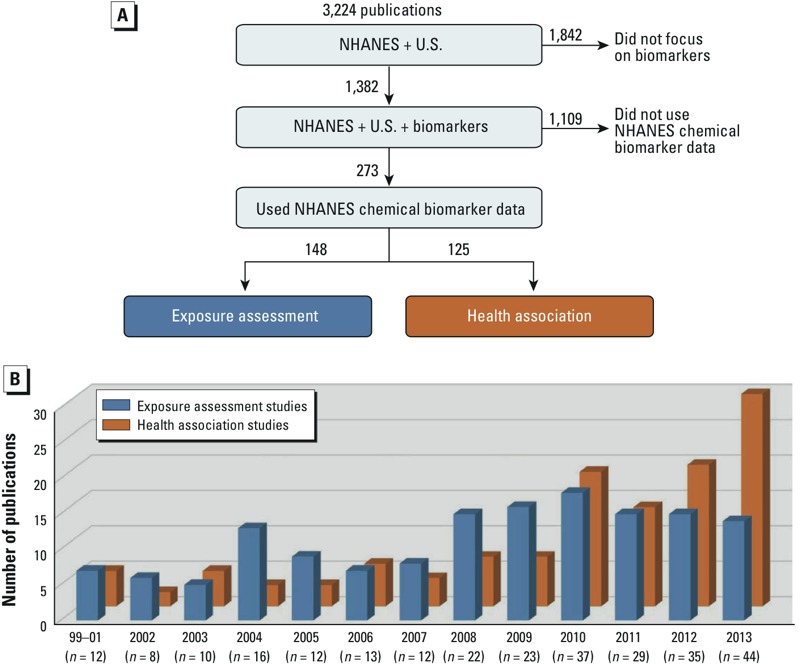
Methods: A literature search (1999-2013) was performed to identify publications in which U.S. NHANES data were reported. Manual curation identified only the subset of publications that clearly utilized chemical biomarker data. This subset was evaluated for chemical groupings, data analysis approaches, and overall trends.
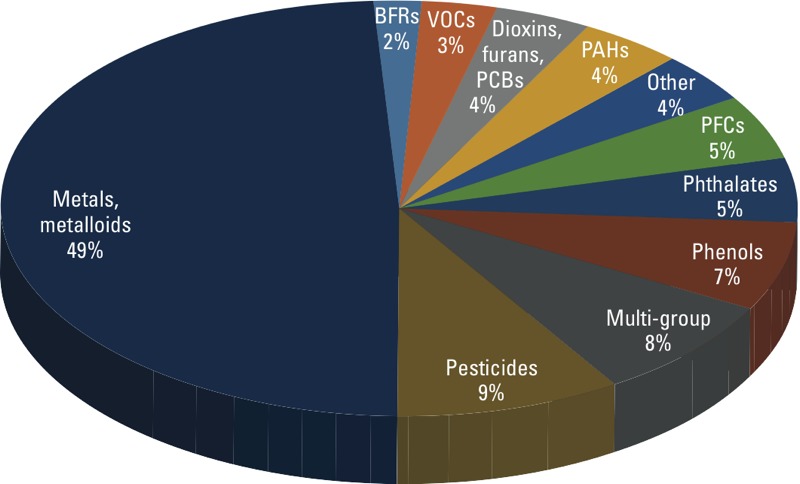
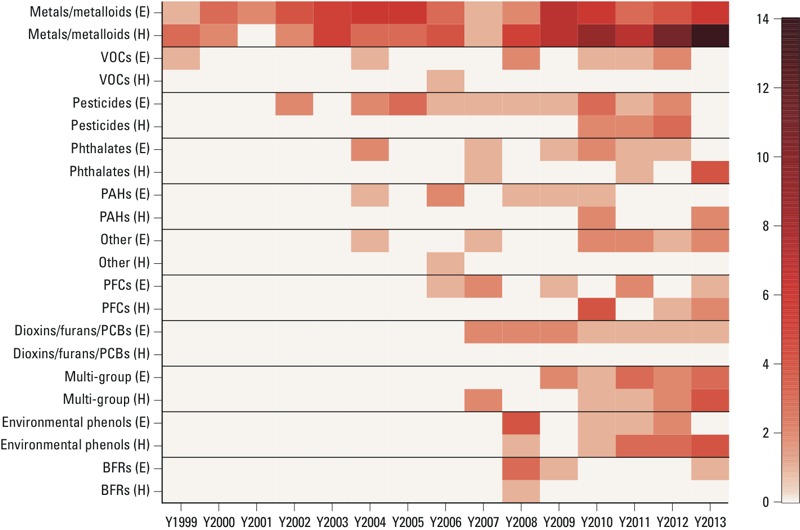
Results: A small percentage of the sampled NHANES-related publications reported on chemical biomarkers (8% yearly average). Of 11 chemical groups, metals/metalloids were most frequently evaluated (49%), followed by pesticides (9%) and environmental phenols (7%). Studies of multiple chemical groups were also common (8%). Publications linking chemical biomarkers to health metrics have increased dramatically in recent years. New studies are addressing challenges related to NHANES data interpretation in health risk contexts.
Conclusions: This article demonstrates growing use of NHANES chemical biomarker data in studies that can impact risk assessments. Best practices for analysis and interpretation must be defined and adopted to allow the full potential of NHANES to be realized.
Conflict of interest statement
The authors declare they have no actual or potential competing financial interests.
Figures
References
-
- Allen BC, Hack CE, Clewell HJ. Use of Markov Chain Monte Carlo analysis with a physiologically-based pharmacokinetic model of methylmercury to estimate exposures in US women of childbearing age. Risk Anal. 2007;27:947–959. - PubMed
-
- Aylward LL, Hays SM, Smolders R, Koch HM, Cocker J, Jones K, et al. Sources of variability in biomarker concentrations. J Toxicol Environ Health B Crit Rev. 2014;17:45–61. - PubMed
Publication types
MeSH terms
Substances
LinkOut - more resources
Full Text Sources
Other Literature Sources