. 2015 Apr 10;10(4):e0122198.
doi: 10.1371/journal.pone.0122198. eCollection 2015.

Functional characterization of human T cell hyporesponsiveness induced by CTLA4-Ig

Affiliations

Functional characterization of human T cell hyporesponsiveness induced by CTLA4-Ig

Yrina Rochman et al. PLoS One. .

Abstract

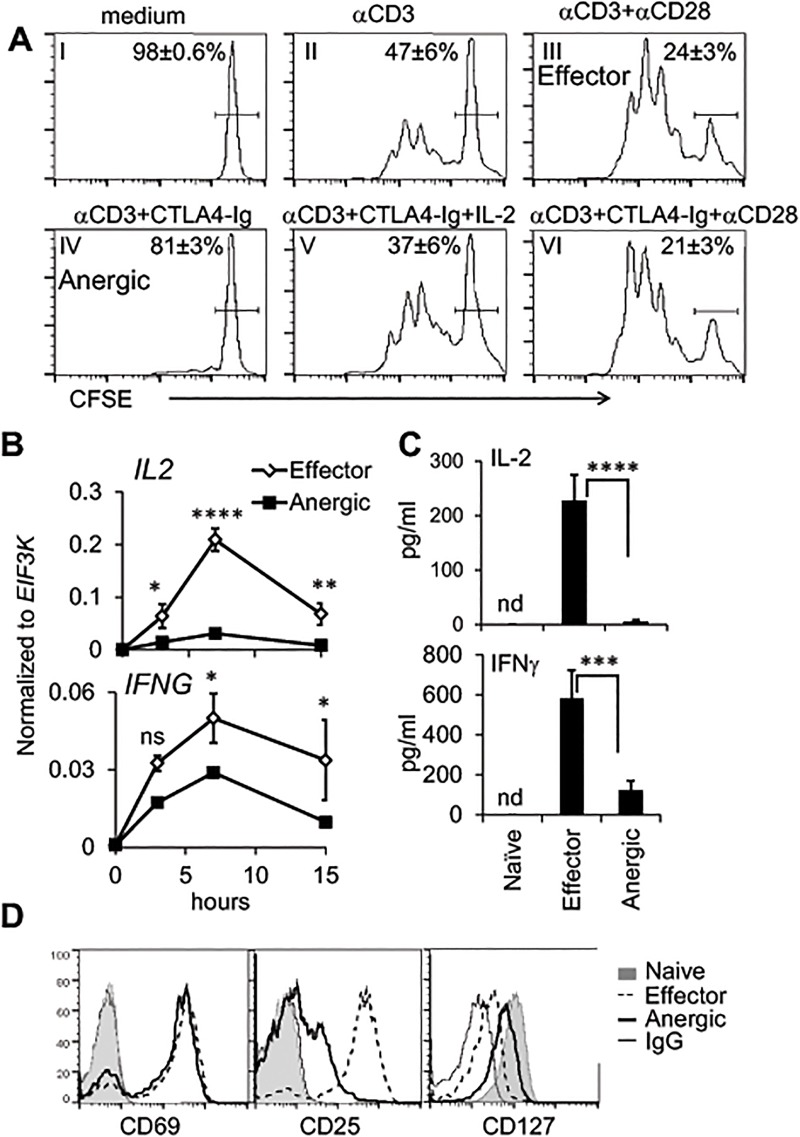
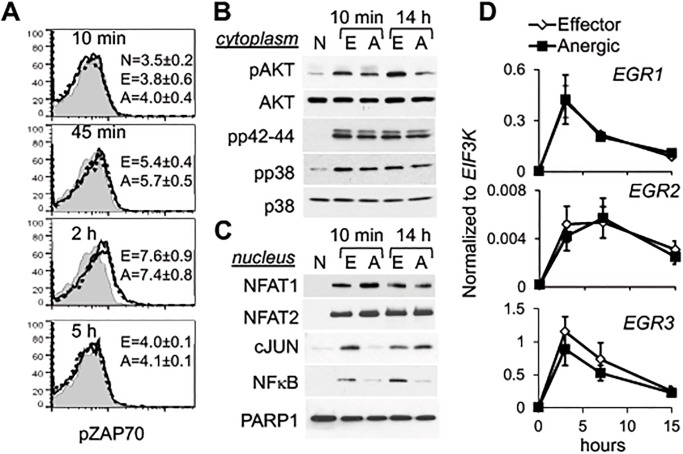
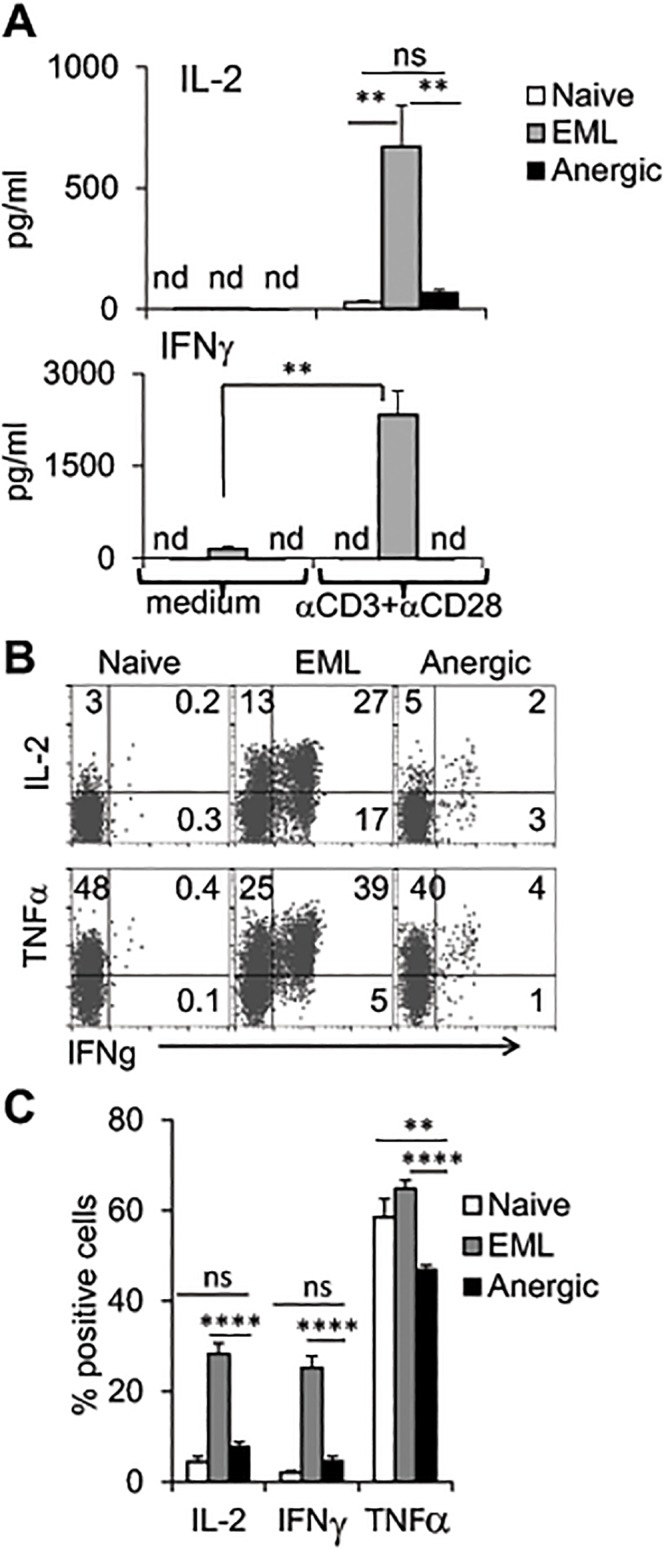
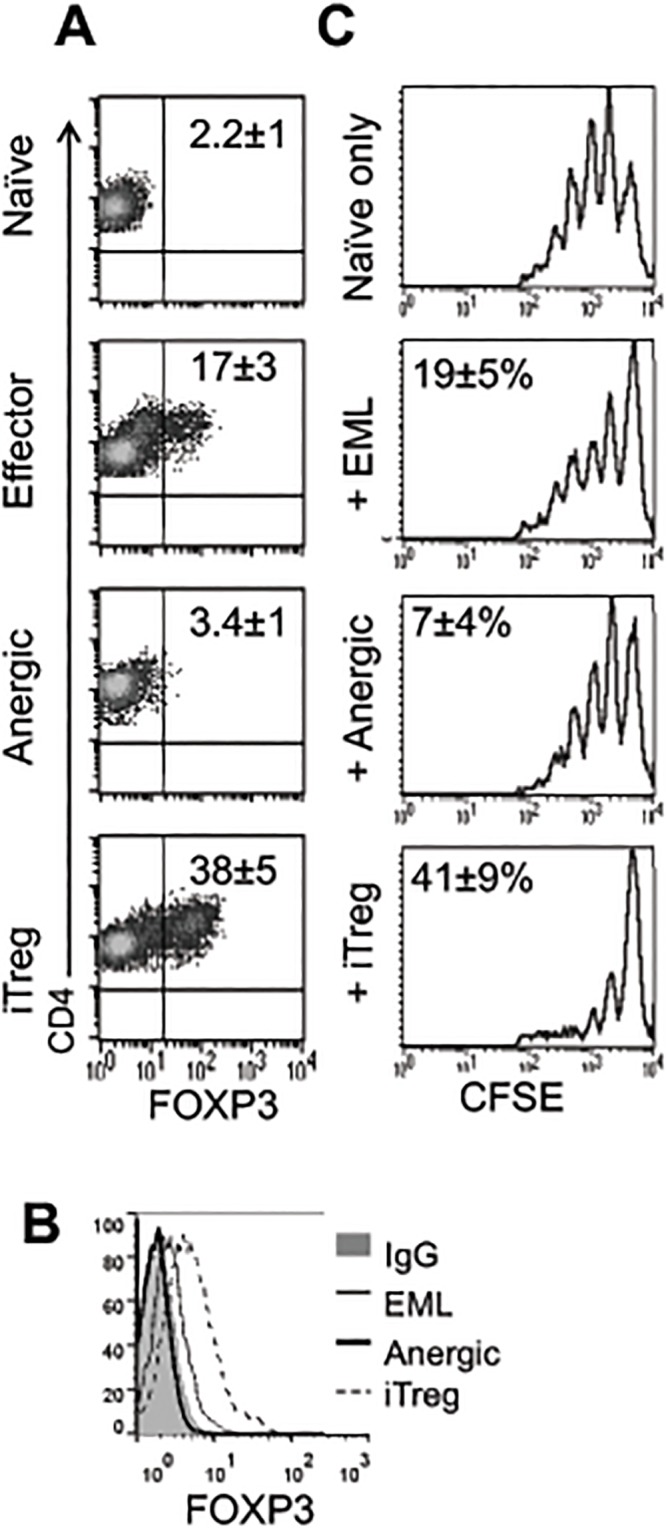
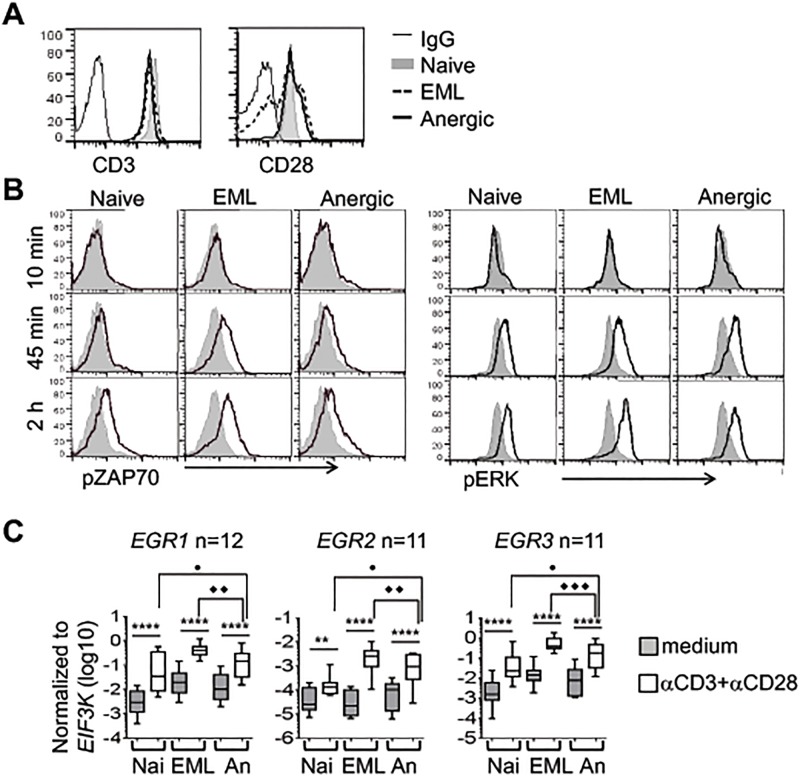
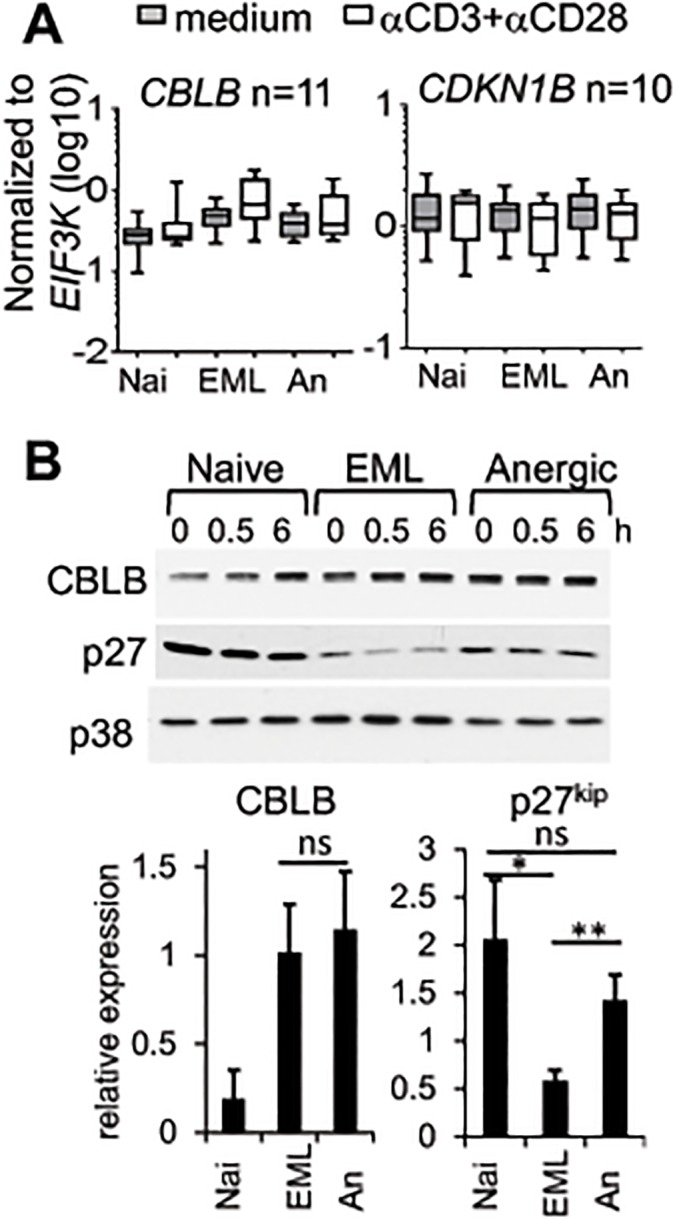
During activation, T cells integrate multiple signals from APCs and cytokine milieu. The blockade of these signals can have clinical benefits as exemplified by CTLA4-Ig, which blocks interaction of B7 co-stimulatory molecules on APCs with CD28 on T cells. Variants of CTLA4-Ig, abatacept and belatacept are FDA approved as immunosuppressive agents in arthritis and transplantation, yet murine studies suggested that CTLA4-Ig could be beneficial in a number of other diseases. However, detailed analysis of human CD4 cell hyporesponsivness induced by CTLA4-Ig has not been performed. Herein, we established a model to study the effect of CTLA4-Ig on the activation of human naïve T cells in a human mixed lymphocytes system. Comparison of human CD4 cells activated in the presence or absence of CTLA4-Ig showed that co-stimulation blockade during TCR activation does not affect NFAT signaling but results in decreased activation of NF-κB and AP-1 transcription factors followed by a profound decrease in proliferation and cytokine production. The resulting T cells become hyporesponsive to secondary activation and, although capable of receiving TCR signals, fail to proliferate or produce cytokines, demonstrating properties of anergic cells. However, unlike some models of T cell anergy, these cells did not possess increased levels of the TCR signaling inhibitor CBLB. Rather, the CTLA4-Ig-induced hyporesponsiveness was associated with an elevated level of p27kip1 cyclin-dependent kinase inhibitor.


Conflict of interest statement

Competing Interests: The authors have declared that no competing interests exist.

Figures

Fig 1
Fig 1. Phenotypic characteristics of activated CD4+ T cells during co-stimulatory inhibition.
A. Human naïve CD4+ cells were labeled with CFSE and cultured in medium (plot I) or activated with soluble αCD3 (2 μg/ml) (plots II-VI) in the presence or absence of αCD28 (1 μg/ml), CTLA4-Ig (7.5 μg/ml), and/or IL-2 (100 U/ml) as indicated for 4 days. CFSE intensity in CD4-gated cells was analyzed by FACS. Shown is the mean of the percentage of non-dividing cells ± SEM (n = 6). B-D. Human naïve CD4+ cells were left resting or were activated for the indicated times by soluble αCD3 antibodies (2 μg/ml) and autologous APCs in the presence of soluble αCD28 (1 μg/ml) (Effector) or CTLA-4-Ig fusion protein (7.5 μg/ml) (Anergic). B. Kinetics of IL2 and IFNG mRNA expression, normalized to EIF3K, (n = 5) and C. levels of cytokine secretion (15 hours, n = 11) were evaluated by qRT-PCR or ELISA, respectively; nd, not detected. B-C. The data are presented as mean ± SEM. *p<0.05, **p<0.01, ***p<0.001, ****p<0.0001; ns, not significant. D. The presence of surface receptors on CD4+ cells were analyzed 1 day (CD69) or 4 days (CD25 and CD127) after cell activation. Shown is one representative from 5 independent experiments.
Fig 2
Fig 2. Molecular characteristics of CD4+ T cells activated in the presence of co-stimulatory inhibition.
Naïve CD4+ T cells were activated as in Fig 1B. A. Phosphorylation of ZAP70 in CD4+ T cells stimulated for the indicated time periods was analyzed by FACS. Shown is one representative experiment with the mean of fluorescence intensity for each population ± SEM from 5 independent experiments. Gray plot is naïve cells (N, unstimulated); dotted line is effector cells (E, αCD3 + αCD28); solid line is anergic cells (A, αCD3 + CTLA4-Ig). B. Activation of AKT and MAPKs in cytoplasm and C. translocation of transcription factors to the nucleus during activation were examined by western blot (cytoplasmic AKT and p38 and nuclear PARP1 were used as loading controls). Each experiment was repeated at least 3 times. D. mRNA expression of indicated genes was measured by real-time PCR (n = 5). Data are presented as mean ± SEM.
Fig 3
Fig 3. Kinetics of gene expression induced in the presence or absence of CTLA4-Ig in TCR-activated CD4+ T cells.
Naïve CD4+ T cells were activated with αCD3+APCs in the presence or absence of CTLA4-Ig for 0, 3, 7, and 14 hours. CD4 cells were purified and subjected to RNA preparation and RNA-Seq analysis. Data shown are K-mean clustering of genes differentially expressed during activation compared to 0 hours with p value <0.05 and RPKM>1 in at least one condition. Selected gene ontology pathways overrepresented in each cluster are shown to the right together with the corresponding p-value.
Fig 4
Fig 4. Survival, surface marker expression, and proliferation rate of anergic, effector/memory-like (EML), and naïve CD4+ T cells.
Naïve, effector, and anergic cells were purified after 4 days of primary activation in the presence of autologous APCs. A. Cells were cultured in medium with 10% FBS and stained with Annexin V and 7-AAD to define apoptotic vs. live cells (n = 10). The data are presented as mean ± SEM. (**p<0.01, ***p<0.001, ****p<0.0001; ns, not significant). B. Fluorescence intensity of the indicated cell surface markers was measured on naïve, 4 days activated (effector), or 4 days activated and 3 days rested (EML and anergic) cells. The histograms show the expression of cell surface markers (solid line) and IgG control (gray plot). C. Purified populations of CD4+ T cells were rested for 4 days in medium, labeled with CFSE, and left untreated or re-stimulated with plate-bound αCD3 (5 μg/ml) + soluble αCD28 (2 μg/ml) ± IL-2 (100 U/ml). Numbers represent the percentage of dividing or non-dividing cells. B-C. Shown is one representative experiment from at least 3 experiments.
Fig 5
Fig 5. Anergic cells have a defect in cytokine production.
A-B. Naïve CD4+ cells were activated as in Fig 1, purified, and rested in the medium for 4–5 days. A. Purified and rested (4 days) naïve, EML, and anergic cells were activated with plate-bound αCD3 and soluble αCD28 for 24 hours in the presence of αCD25 + αCD122 to prevent IL-2 usage. ELISA for the indicated cytokines was performed, and data are presented as mean ± SD of 3 independent experiments (**p<0.01; nd, not detected; ns, not significant). B-C. Cells were treated with PDBU and ionomycin in the presence of monensin for 2 hours. The intracellular staining of cytokines was evaluated by FACS. C. Average percentage of cytokine-positive cells from a group of 16 naïve, 39 EML, and 39 anergic cell samples (**p<0.01, ****p<0.0001). The data are presented as mean ± SEM.
Fig 6
Fig 6. CD4+ T cells activated in the presence of CTLA4-Ig do not have properties of Treg cells.
A-C. Naïve cells were activated to generate effector or anergic cells as in Fig 1. For generation of regulatory T cells (Treg cells), αCD3, αCD28, TGF-β, and IL-2 were added for the first activation. A. The expression of FOXP3 in CD4+ T cells was measured on day 4 of activation or B. after an additional 3 days of rest in the medium. Numbers are percent of CD4+FOXP3+ cells ± SEM (n = 11) C. Each group of CD4+ T cells was purified 4 days after activation, rested for 3 days in medium, and co-activated with freshly purified CFSE-labeled allogeneic naïve CD4+ cells in the presence of αCD3 + αCD28–coated beads (0.1 μl of beads per 100 μl of medium) for 4 days. The proliferation rate of CFSE-labeled naïve cells was analyzed by FACS. Shown is the average ± SEM percent inhibition of naïve cell proliferation (n = 6). EML, effector/memory-like T cells; iTreg, induced regulatory T cells.
Fig 7
Fig 7. Anergic cells can receive TCR signaling.
Naïve cells were activated to generate effector or anergic cells as in Fig 1 and rested for 4–5 days. A. The surface expression of CD3e and CD28 was analyzed by FACS. B. The phosphorylation of ZAP70 (left panel) and ERK1/2 (right panel) was measured in unstimulated (gray plot) and αCD3 + αCD28–stimulated (solid line) naïve, effector/memory-like (EML), and anergic cells at the indicated time points. Shown is one representative experiment out of 4 independent experiments. C. Rested cells were not activated or were activated with soluble αCD3 + αCD28 for 4 hours. mRNA expression of the indicated genes was measured by qRT-PCR (Box and whiskers plot). The data are presented as mean ± SEM (*p<0.05, **p<0.01, ***p<0.001, ****p<0.0001). An, anergic cells; EML, effector/memory-like T cells; Nai, naïve cells.
Fig 8
Fig 8. Human anergic cells have increased level of p27kip1.
A-B. Naïve, EML, and anergic cells were left untreated or stimulated with soluble αCD3 + αCD28, and A. mRNA level after 4 hours (Box and whiskers plot) or B. protein level of CBLB and p27kip1 after 0, 0.5, and 6 hours were measured. The lower panel represents the relative protein expression of CBLB and p27kip1 to p38 as loading control from 6 (CBLB) and 10 (p27kip1) independent experiments at 0 hours (*p<0.05, **p<0.01; ns, not significant). The data are presented as mean ± SEM. An, anergic cells; EML, effector/memory-like T cells; Nai, naïve cells.

Similar articles

Cited by

References

    1. Choi S, Schwartz RH (2007) Molecular mechanisms for adaptive tolerance and other T cell anergy models. Semin Immunol 19: 140–152. - PMC - PubMed
    1. Chen L, Flies DB (2013) Molecular mechanisms of T cell co-stimulation and co-inhibition. Nat Rev Immunol 13: 227–242. 10.1038/nri3405 - DOI - PMC - PubMed
    1. Wekerle T, Kurtz J, Bigenzahn S, Takeuchi Y, Sykes M (2002) Mechanisms of transplant tolerance induction using costimulatory blockade. Curr Opin Immunol 14: 592–600. - PubMed
    1. Wekerle T, Grinyó JM (2012) Belatacept: from rational design to clinical application. Transpl Int 25: 139–150. 10.1111/j.1432-2277.2011.01386.x - DOI - PubMed
    1. Wells AD, Walsh MC, Bluestone JA, Turka LA (2001) Signaling through CD28 and CTLA-4 controls two distinct forms of T cell anergy. J Clin Invest 108: 895–903. - PMC - PubMed

Publication types

MeSH terms