. 2015 Apr 10;10(4):e0119547.
doi: 10.1371/journal.pone.0119547. eCollection 2015.

Full-length human placental sFlt-1-e15a isoform induces distinct maternal phenotypes of preeclampsia in mice

Affiliations

Full-length human placental sFlt-1-e15a isoform induces distinct maternal phenotypes of preeclampsia in mice

Gabor Szalai et al. PLoS One. .

Abstract

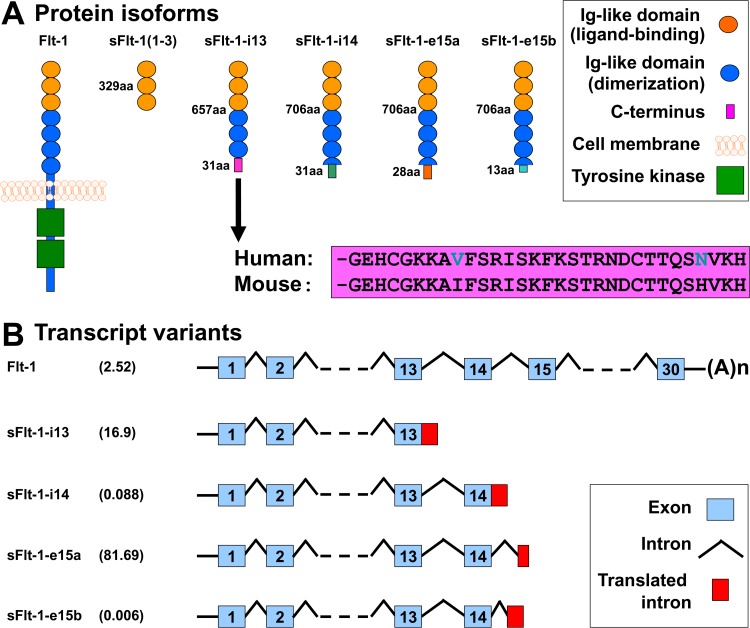
Objective: Most anti-angiogenic preeclampsia models in rodents utilized the overexpression of a truncated soluble fms-like tyrosine kinase-1 (sFlt-1) not expressed in any species. Other limitations of mouse preeclampsia models included stressful blood pressure measurements and the lack of postpartum monitoring. We aimed to 1) develop a mouse model of preeclampsia by administering the most abundant human placental sFlt-1 isoform (hsFlt-1-e15a) in preeclampsia; 2) determine blood pressures in non-stressed conditions; and 3) develop a survival surgery that enables the collection of fetuses and placentas and postpartum (PP) monitoring.

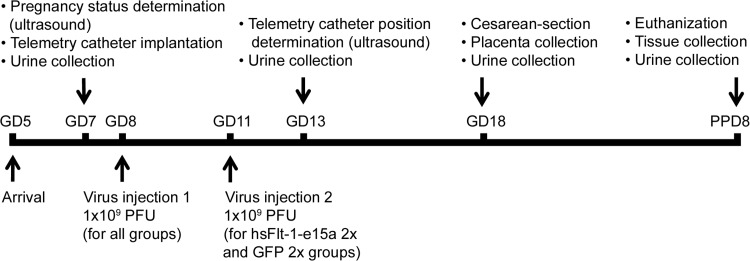
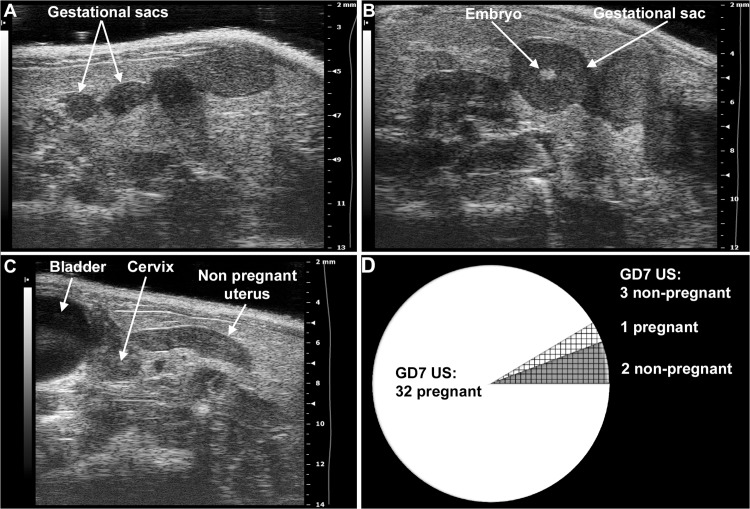
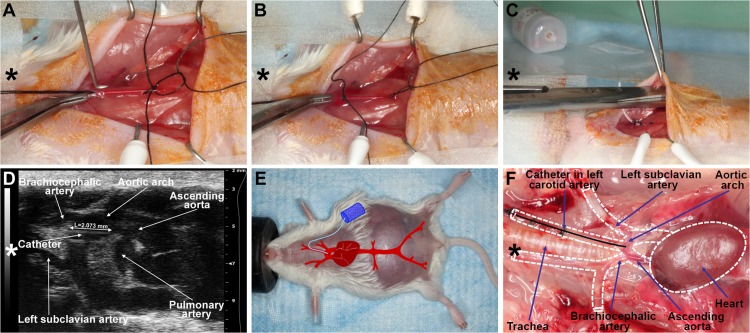
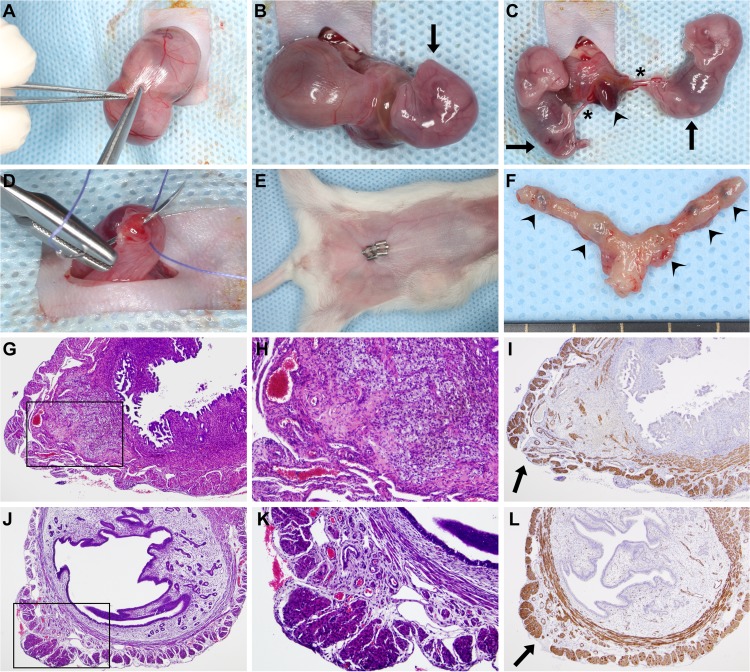
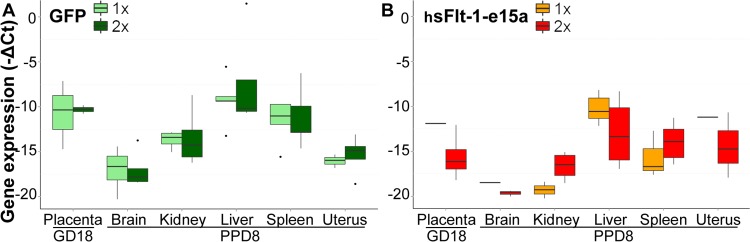
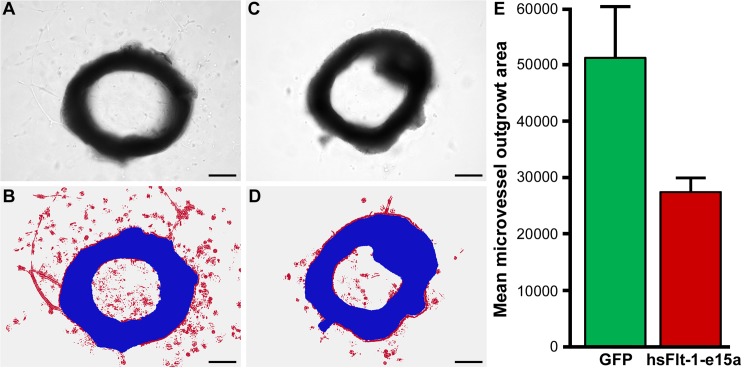
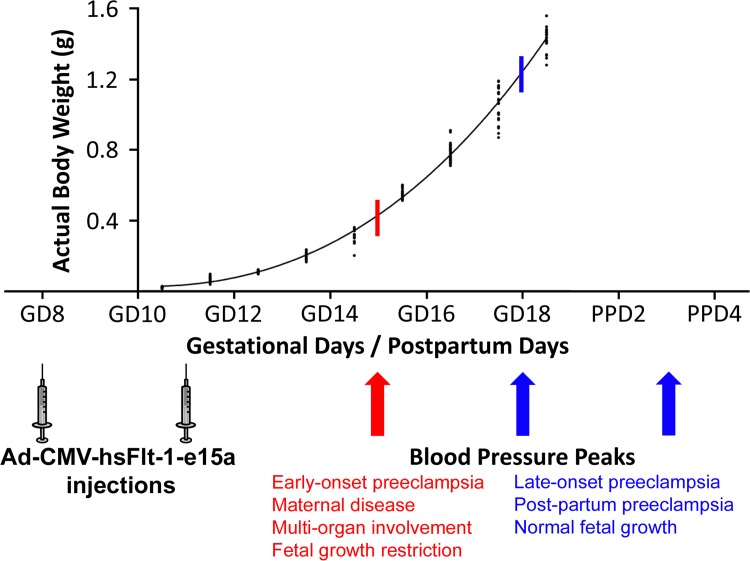
Methods: Pregnancy status of CD-1 mice was evaluated with high-frequency ultrasound on gestational days (GD) 6 and 7. Telemetry catheters were implanted in the carotid artery on GD7, and their positions were verified by ultrasound on GD13. Mice were injected through tail-vein with adenoviruses expressing hsFlt-1-e15a (n = 11) or green fluorescent protein (GFP; n = 9) on GD8/GD11. Placentas and pups were delivered by cesarean section on GD18 allowing PP monitoring. Urine samples were collected with cystocentesis on GD6/GD7, GD13, GD18, and PPD8, and albumin/creatinine ratios were determined. GFP and hsFlt-1-e15a expression profiles were determined by qRT-PCR. Aortic ring assays were performed to assess the effect of hsFlt-1-e15a on endothelia.

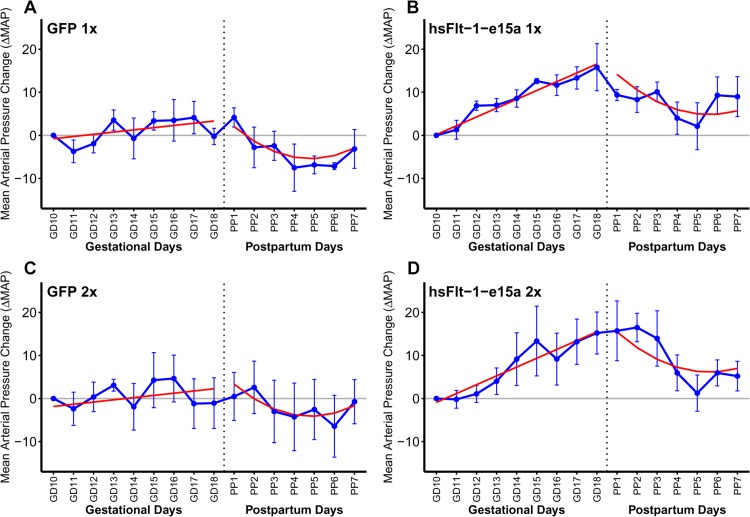
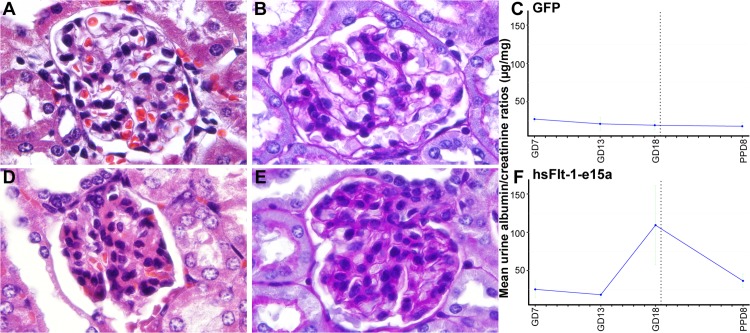
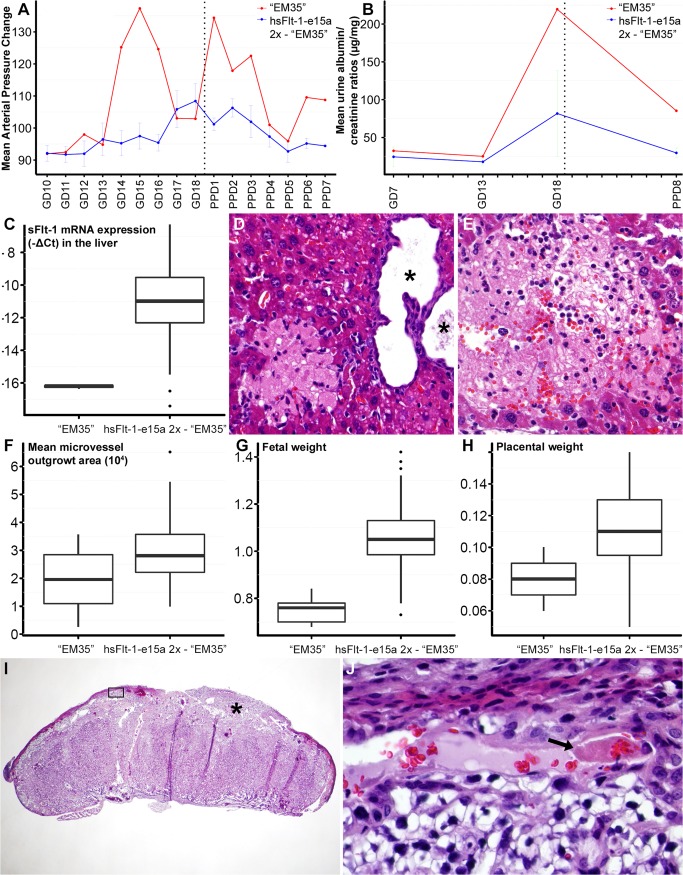
Results: Ultrasound predicted pregnancy on GD7 in 97% of cases. Cesarean section survival rate was 100%. Mean arterial blood pressure was higher in hsFlt-1-e15a-treated than in GFP-treated mice (∆MAP = 13.2 mmHg, p = 0.00107; GD18). Focal glomerular changes were found in hsFlt-1-e15a -treated mice, which had higher urine albumin/creatinine ratios than controls (109.3 ± 51.7 μg/mg vs. 19.3 ± 5.6 μg/mg, p = 4.4 x 10(-2); GD18). Aortic ring assays showed a 46% lesser microvessel outgrowth in hsFlt-1-e15a-treated than in GFP-treated mice (p = 1.2 x 10(-2)). Placental and fetal weights did not differ between the groups. One mouse with liver disease developed early-onset preeclampsia-like symptoms with intrauterine growth restriction (IUGR).

Conclusions: A mouse model of late-onset preeclampsia was developed with the overexpression of hsFlt-1-e15a, verifying the in vivo pathologic effects of this primate-specific, predominant placental sFlt-1 isoform. HsFlt-1-e15a induced early-onset preeclampsia-like symptoms associated with IUGR in a mouse with a liver disease. Our findings support that hsFlt-1-e15a is central to the terminal pathway of preeclampsia, and it can induce the full spectrum of symptoms in this obstetrical syndrome.


Conflict of interest statement

Competing Interests: The authors have declared that no competing interests exist.

Figures

Fig 1
Fig 1. FLT1 protein isoforms and mRNA transcript variants.
(A) Flt-1 contains seven extracellular Ig-like domains and an intracellular tyrosine kinase. The first three extracellular Ig-like domains are essential for ligand-binding, while the 4–7th extracellular Ig-like domains for receptor dimerization. The truncated mouse sFlt-1 mutant [msFlt-1(1–3)] contains only 1–329 amino acids of Flt-1, corresponding to the first three Ig-like domains. Mouse and human sFlt-1-i13 contains the first six Ig-like domains corresponding to 1–657 amino acids of Flt-1, as well as a unique 31-amino-acid tail. This unique C-terminus is evolutionarily highly conserved among mammals; the mouse and human amino acid sequences of this tail are only different in two positions (shown with blue letters). Among the human placental expressed sFlt-1 isoforms, hsFlt-1-i14, hsFlt-1-e15a and hsFlt-1-e15b diverge from Flt-1 after amino acid 706, and contain a 31-, 28- and 13-amino-acid unique tails, respectively. (B) Among the placental expressed FLT1 transcripts, the abundance of the mRNA encoding for the transmembrane receptor is about 2.5% in preeclampsia. FLT1 transcript expression data was retrieved from Jebbink et al. and is shown as transcript level divided by total FLT1 transcript level [154]. HsFlt-1-i13, the second most abundant placental FLT1 transcript in preeclampsia, is generated by skipped splicing and extension of exon 13. Similarly, hsFlt-1-i14 is generated by skipped splicing and extension of exon 14. HsFlt-1-e15a and hsFlt-1-e15b contain alternatively spliced exons derived from intronic sequences (exon 15a and exon 15b, respectively). The most abundant placental transcript, hsFlt-1-e15a contains exon 15a, which is located within a primate-specific AluSeq retrotransposon. The graph was adapted with permission from figures in publications of Heydarian et al. [153] and Shibuya M. [243]. Permissions for reuse of these original figures were obtained from Elsevier Ltd. and from the Proceedings of the Japan Academy, Series B, respectively.
Fig 2
Fig 2. Experimental procedures.
The flow-chart shows the experimental procedures performed at certain time-points during the study. GD, gestational day; PPD, postpartum day; PFU, plaque forming unit.
Fig 3
Fig 3. Determination of mouse pregnancy status with a 55MHz ultrasound probe.
(A) Pregnant uterus on GD6. Gestational sacs of 1.8mm–2.7mm were observed in the proximity of the abdominal surface without visible signs of an embryo. (B) Pregnant uterus on GD7. Advanced endometrial reaction and the presence of an embryo were visible in the gestational sacs. (C) Non-pregnant uterus of a mouse seven days after mating, equivalent to GD7. (D) The pie chart shows that pregnancy could be diagnosed in 32 (white) of the 35 mice with high-frequency ultrasound on GD7. Of three mice diagnosed as non-pregnant on GD7 (shading), two were non-pregnant (grey shading), while one carried a pregnancy to term (white shading).
Fig 4
Fig 4. Implantation with a telemetric blood pressure monitoring system.
(A) On GD8, after isolation and ligation of the left common carotid artery at the level of bifurcation, a small arteriotomy was prepared with a 25G tip needle, (B) and the blood pressure monitoring catheter was positioned into the aortic arch with the assistance of the vessel cannulation forceps. (C) The transmitter was placed into a subcutaneous pocket in the left flank and preformed with blind dissection. (D) On GD13, the position of the telemetry catheter was determined with a 55MHz ultrasound probe. The catheter tip is situated in the aortic arch, and the intra-aortic part of the catheter reaches the optimal 2mm length. (E) On GD18, a pregnant mouse is shown before a cesarean section. The incision line of the telemetry surgery healed completely. The projected graph illustrates the position of the intra-aortic catheter and the subcutaneous telemetric blood pressure transmitter. (F) On PPD8, the catheter position, aortic arch, and main arterial branches were visualized after autopsy in the mouse mediastinum and chest. The dotted lines show the heart and main arteries of the mediastinum. (A-F) Head orientations are shown with asterisks.
Fig 5
Fig 5. Survival cesarean section.
(A) After a 1cm–1.5cm midline abdominal incision, a short segment of one uterine horn was exteriorized, and a 3mm–5mm longitudinal hysterectomy was performed on the opposite side of the mesometrial arterial arcade. (B-C) As the uterine wall could be easily dilated, this minimal incision enabled the delivery of two to three fetuses and their placentas using gentle fingertip pressure. An arrowhead depicts a placenta, stars depict umbilical cords, and arrows point to the fetuses. (D) Hysterectomies were closed with a single 4/0 absorbable multifilament suture. (E) After abdominal lavage with 0.9% sterile saline, the abdominal wall was closed with an absorbable multifilament continuous suture, and the skin was closed with 7mm-wide staples. The image shows a surgical field before euthanization on PPD8. (F) One uterus harvested after euthanization on PPD8. Arrowheads show hysterectomy sutures. (G) H&E staining of a uterine cross-section of a control mouse euthanized on PPD8 shows granulation tissue with enlarged vessels, foam cells, myofibroblasts, macrophages, and hemosiderin deposition. The image inside the black box is magnified in Subfigure H. (I) SMA immunostaining of the same uterus. The arrow depicts the cesarean section incision site with the disruption of the two-layered myometrium. (J) H&E staining of a uterine cross-section of a control mouse euthanized on PPD77 shows granulation tissue and the complete healing of the two-layered myometrium. The image inside the black box is magnified in Subfigure K. (L) SMA immunostaining of the same uterus. The arrow depicts a suture site. (G, I, J and L: 40x magnifications, H and K: 100x magnifications).
Fig 6
Fig 6. Profiling of hsFlt-1-e15a and GFP expression.
Boxplots show the expression profile of GFP (A) or hsFlt-1-e15a (B) mRNAs in placentas harvested on GD18 and in five tissues harvested on PPD8. Adenovirus doses (1x10⁹ or 2x10⁹ plaque-forming units) are depicted with different colors. Expression of hsFlt-1-e15a and GFP mRNAs was highest in the liver. Viral dose-effect was not seen in GFP expression; however, there was a dose-effect in hsFlt-1-e15a expression. The number of hsFlt-1-e15a expressing placenta, brain and uterine tissues was low in the hsFlt-1-e15a 1x group.
Fig 7
Fig 7. Blood pressure monitoring.
X-axes show gestational days (GDs) and postpartum days (PPDs). Mean arterial pressure changes (ΔMAP) are depicted on the Y-axes. Blue dots represent ΔMAP values for given time-points, blue error bars show +/-standard errors. Red lines depict the ΔMAP patterns, fitted from the linear mixed effects models. During pregnancy (left sides of the sub-figures), there was no significant blood pressure elevation in control mice (A,C; ΔMAP slope = 0.513 mmHg/day; p = 0.187), whereas hsFlt-1-e15a treatment significantly increased blood pressure (B,D; ΔMAP slope = 2.05 mmHg/day; p = 8.09x10⁻⁸). The ΔMAP slope in the hsFlt-1-e15a group was higher compared to the controls (1.53 mmHg/day; p = 0.0043). The ΔMAP at parturition (GD18) was 13.2 mmHg higher in hsFlt-1-e15a-treated mice than in the control mice (p = 0.00107). After cesarean delivery (right sides of sub-figures), a similar quadratic pattern of ΔMAP was found in both control and hsFlt-1-e15a-treated mice, but ΔMAP dropped below the baseline in control mice (-1.96 mmHg; p = 0.560), while it remained above this in hsFlt-1-e15a treated mice (6.88 mmHg; p = 0.0346). There was no dose effect of the number of viral construct injections (1x10⁹ PFU vs. 2x10⁹ PFU) in hsFlt-1-e15a-treated or in control mice either before delivery (dose effect: -1.06 mmHg, p = 0.693) or in the postpartum period (dose effect: 1.30 mmHg, p = 0.763).
Fig 8
Fig 8. Aortic ring assays.
(A) A light image of an aortic ring from a mouse injected with Ad-CMV-GFP. (B) An image of the same aortic ring, illustrating segmentation and classification, with the aortic ring shown in blue and the red color depicting the microvessel outgrowth area. (C) A light image of an aortic ring from a mouse injected with Ad-CMV-hsFlt-1-e15a. (D) An image of the same aortic ring, illustrating segmentation and classification, with the aortic ring shown in blue and the red color depicting the microvessel outgrowth area. (A-D) Scale bars depict 500μm. (E) The bar chart depicts the differences in mean microvessel outgrowth areas (pixels) between the GFP and hsFlt-1-e15a groups.
Fig 9
Fig 9. Histopathological and functional evaluation of the kidneys.
Representative H&E (A) and PAS (B) stained sections show a morphologically normal glomerulus in a control animal. Representative H&E (D) and PAS (E) stained sections show a glomerulus with signs of swollen capillary endothelial cells and occlusion of glomerular capillaries in a mouse overexpressing hsFlt-1-e15a. (C,F) Charts depict albumin/creatinine ratios in urine specimens collected on gestational day (GD)7, GD13, GD18, and PPD8 from mice in the GFP (C) and hsFlt-1-e15a (F) groups. Mean urine albumin/creatinine ratios did not change in control mice; however, these increased by gestational days and then dropped postpartum in hsFlt-1-e15a overexpressing mice. Mean urine albumin/creatinine ratio on GD18 was higher in hsFlt-1-e15a-treated than in control mice (p = 4.4x10⁻²). The mean urine albumin/creatinine ratio on PPD8 was marginally significantly higher in hsFlt-1-e15a-treated (36.6±9.0μg/mg) than in control mice (18.0±4.9μg/mg; p = 0.06).
Fig 10
Fig 10. “EM35” mouse had early-onset preeclampsia-like symptoms associated with fetal growth restriction.
(A) “EM35” mouse had a higher and earlier blood pressure peak than other hsFlt-1-e15a-treated mice, followed by the normalization of blood pressures and a second blood pressure peak on PPD1. (B) The urinary albumin/creatinine ratio on GD18 was higher in “EM35” mouse than in other hsFlt-1-e15a-treated mice. (C) HsFlt-1-e15a expression in the liver was lower in “EM35” mouse than in other hsFlt-1-e15a-treated mice. (D-E) Histopathological examination of the liver found a multiple cystic biliary hyperplasia in the liver (* in D), and multiple recent (D) and remote (E) infarcts in the parenchyma of liver. H&E staining, 200x magnifications. (F) The endothelial outgrowth area was the lowest in “EM35” mouse among hsFlt-1-e15a-treated mice. (G-H) Mean fetal (G) weights (0.749±0.029) and placental (H) weights (0.080±0.006) in “EM35” mouse were significantly lower than in other hsFlt-1-e15a-treated mice (fetal weight: 1.06±0.023, p = 2.017x10⁻¹⁵, placental weight: 0.111±0.004, p = 2.05x10⁻⁶). (I) Histopathological examination of a placenta from “EM35” mouse showed multiple thrombi in maternal decidual vessels (star and black box). H&E staining, 20x magnification. The image inside the black box is magnified to 800x in Subfigure I. (J) The arrow shows one of the thrombi.
Fig 11
Fig 11. The possible mechanisms of distinct preeclampsia phenotypes induced by hsFlt-1-e15a.
Blood pressure peaks (blue arrows) occurred after a ten-day-period following the first and second Ad-CMV-hsFlt-1-e15a injections in all but one mice that developed late-onset or postpartum preeclampsia without growth restriction. In these cases the growth potential of the fetuses was not compromised because they have already reached the top of their growth curve when hsFlt-1-e15a effect reached its plateau (blue stick crossing the curve). In case of “EM35” mouse, blood pressure elevations already peaked at six days after the first Ad-CMV-hsFlt-1-e15a injection (red arrow). In this case the fetal growth potential was severely compromised because the hsFlt-1-e15a effect was the highest when fetuses had reached only about one third or fourth of their growth curve (red stick crossing the curve). Preeclampsia phenotypes are described below the growth curve of CD-1 mouse embryos, which was adapted from a figure in a previous publication of Mu et al. [240]. Permission for reuse of this original figure was obtained from BioMed Central.

Similar articles

Cited by

References

    1. Romero R. Prenatal medicine: the child is the father of the man. 1996. J Matern Fetal Neonatal Med. 2009; 22: 636–639. 10.1080/14767050902784171 - DOI - PubMed
    1. Di Renzo GC. The great obstetrical syndromes. J Matern Fetal Neonatal Med. 2009; 22: 633–635. 10.1080/14767050902866804 - DOI - PubMed
    1. Saftlas AF, Olson DR, Franks AL, Atrash HK, Pokras R. Epidemiology of preeclampsia and eclampsia in the United States, 1979–1986. Am J Obstet Gynecol. 1990; 163: 460–465. - PubMed
    1. Report of the National High Blood Pressure Education Program Working Group on High Blood Pressure in Pregnancy. Am J Obstet Gynecol. 2000; 183: S1–S22. - PubMed
    1. MacKay AP, Berg CJ, Atrash HK. Pregnancy-related mortality from preeclampsia and eclampsia. Obstet Gynecol. 2001; 97: 533–538. - PubMed

Publication types

MeSH terms

LinkOut - more resources