

Maximizing Iodine Contrast-to-Noise Ratios in Abdominal CT Imaging through Use of Energy Domain Noise Reduction and Virtual Monoenergetic Dual-Energy CT
- PMID: 25860839
- PMCID: PMC4514538
- DOI: 10.1148/radiol.2015140857
Maximizing Iodine Contrast-to-Noise Ratios in Abdominal CT Imaging through Use of Energy Domain Noise Reduction and Virtual Monoenergetic Dual-Energy CT
Abstract
Purpose: To determine the iodine contrast-to-noise ratio (CNR) for abdominal computed tomography (CT) when using energy domain noise reduction and virtual monoenergetic dual-energy (DE) CT images and to compare the CNR to that attained with single-energy CT at 80, 100, 120, and 140 kV.
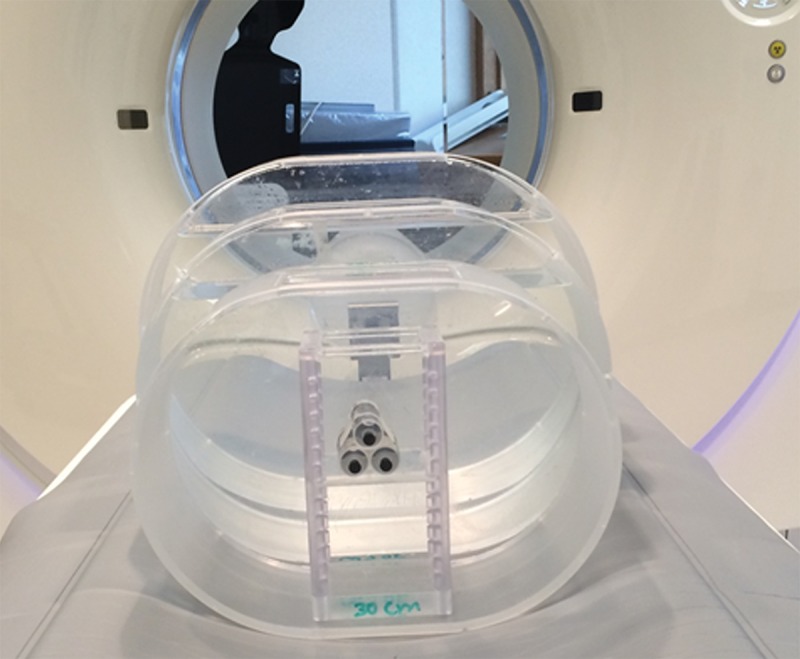
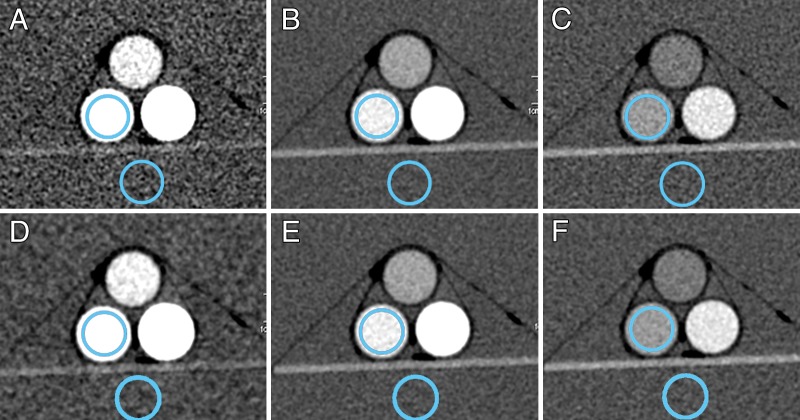
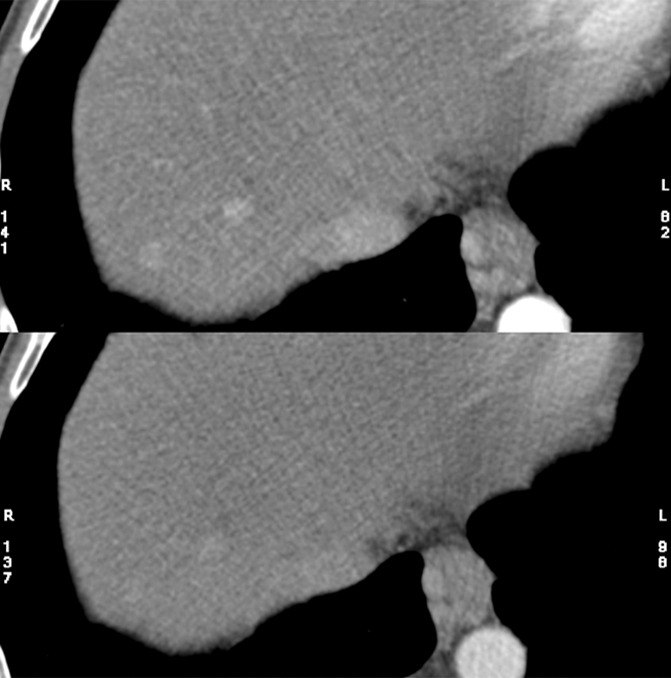
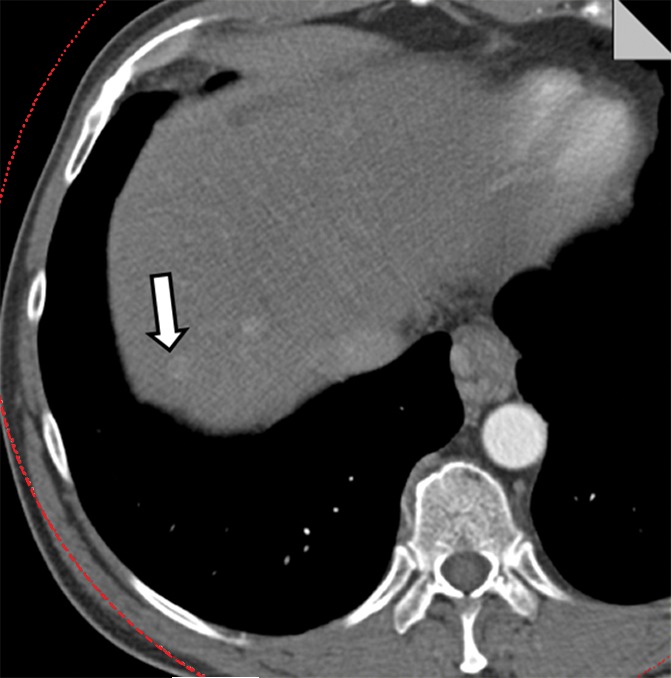
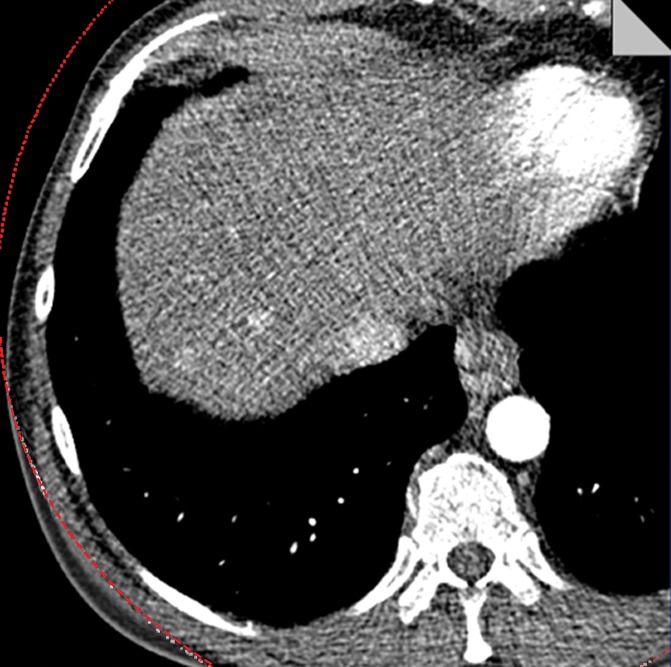
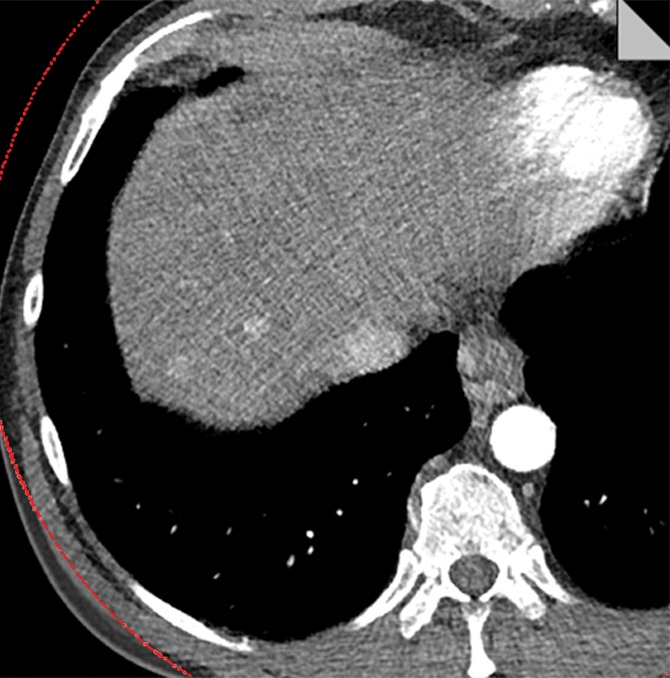
Materials and methods: This HIPAA-compliant study was approved by the institutional review board with waiver of informed consent. A syringe filled with diluted iodine contrast material was placed into 30-, 35-, and 45-cm-wide water phantoms and scanned with a dual-source CT scanner in both DE and single-energy modes with matched scanner output. Virtual monoenergetic images were generated, with energies ranging from 40 to 110 keV in 10-keV steps. A previously developed energy domain noise reduction algorithm was applied to reduce image noise by exploiting information redundancies in the energy domain. Image noise and iodine CNR were calculated. To show the potential clinical benefit of this technique, it was retrospectively applied to a clinical DE CT study of the liver in a 59-year-old male patient by using conventional and iterative reconstruction techniques. Image noise and CNR were compared for virtual monoenergetic images with and without energy domain noise reduction at each virtual monoenergetic energy (in kiloelectron volts) and phantom size by using a paired t test. CNR of virtual monoenergetic images was also compared with that of single-energy images acquired with 80, 100, 120, and 140 kV.
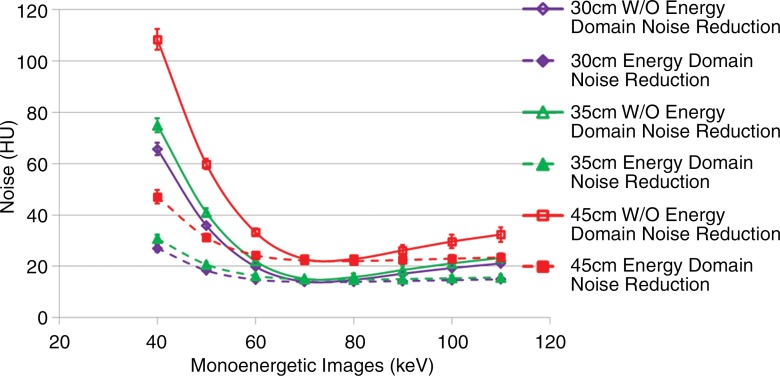
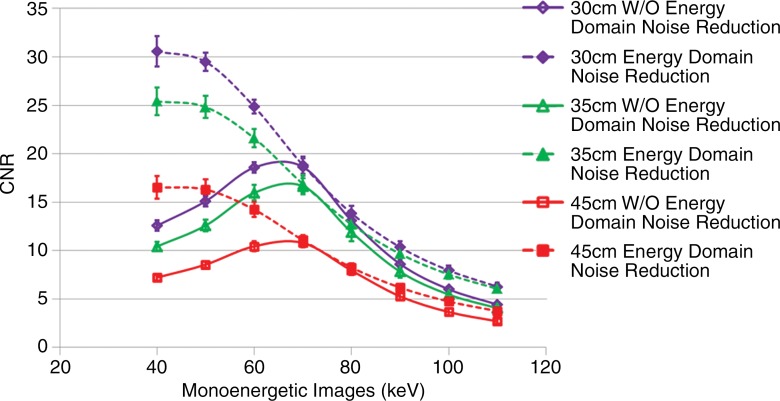
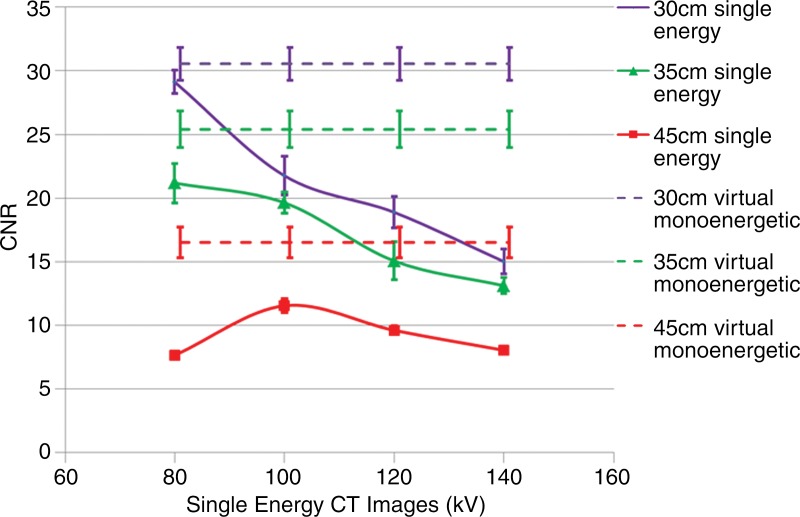
Results: Noise reduction of up to 59% (28.7 of 65.7) was achieved for DE virtual monoenergetic images by using an energy domain noise reduction technique. For the commercial virtual monoenergetic images, the maximum iodine CNR was achieved at 70 keV and was 18.6, 16.6, and 10.8 for the 30-, 35-, and 45-cm phantoms. After energy domain noise reduction, maximum iodine CNR was achieved at 40 keV and increased to 30.6, 25.4, and 16.5. These CNRs represented improvement of up to 64% (12.0 of 18.6) with the energy domain noise reduction technique. For single-energy CT at the optimal tube potential, iodine CNR was 29.1 (80 kV), 21.2 (80 kV), and 11.5 (100 kV). For patient images, 39% (24 of 61) noise reduction and 67% (0.74 of 1.10) CNR improvement were observed with the energy domain noise reduction technique when compared with standard filtered back-projection images.
Conclusion: Iodine CNR for adult abdominal CT may be maximized with energy domain noise reduction and virtual monoenergetic DE CT.
(©) RSNA, 2015.
Figures


Similar articles
-
Assessment of an advanced image-based technique to calculate virtual monoenergetic computed tomographic images from a dual-energy examination to improve contrast-to-noise ratio in examinations using iodinated contrast media.Invest Radiol. 2014 Sep;49(9):586-92. doi: 10.1097/RLI.0000000000000060. Invest Radiol. 2014. PMID: 24710203
-
Advanced virtual monoenergetic computed tomography of hyperattenuating and hypoattenuating liver lesions: ex-vivo and patient experience in various body sizes.Invest Radiol. 2015 Oct;50(10):695-702. doi: 10.1097/RLI.0000000000000171. Invest Radiol. 2015. PMID: 26002623
-
Assessment of the hepatic veins in poor contrast conditions using dual energy CT: evaluation of a novel monoenergetic extrapolation software algorithm.Rofo. 2014 Jun;186(6):591-7. doi: 10.1055/s-0034-1366423. Epub 2014 Apr 22. Rofo. 2014. PMID: 24756426
-
Oncologic applications of dual-energy CT in the abdomen.Radiographics. 2014 May-Jun;34(3):589-612. doi: 10.1148/rg.343135041. Radiographics. 2014. PMID: 24819783 Review.
-
Use of Dual-Energy CT and Iodine Maps in Evaluation of Bowel Disease.Radiographics. 2016 Mar-Apr;36(2):393-406. doi: 10.1148/rg.2016150151. Radiographics. 2016. PMID: 26963452 Review.
Cited by
-
Performance improvements of virtual monoenergetic images in photon-counting detector CT compared with dual source dual-energy CT: Fourier-based assessment.Phys Eng Sci Med. 2025 Mar;48(1):143-153. doi: 10.1007/s13246-024-01499-6. Epub 2024 Dec 10. Phys Eng Sci Med. 2025. PMID: 39658761 Free PMC article.
-
Postablation assessment of hepatocellular carcinoma using dual-energy CT: Comparison of half versus standard iodine contrast medium.PLoS One. 2019 Jul 9;14(7):e0219577. doi: 10.1371/journal.pone.0219577. eCollection 2019. PLoS One. 2019. PMID: 31287838 Free PMC article.
-
PKAID-Net: Prior Knowledge Aware Iterative Denoising Neural Network for Photon Counting Detector CT.Proc SPIE Int Soc Opt Eng. 2023 Feb;12463:124632Q. doi: 10.1117/12.2653904. Epub 2023 Apr 7. Proc SPIE Int Soc Opt Eng. 2023. PMID: 37063492 Free PMC article.
-
Optimizing dual-energy CT technique for iodine-based contrast-to-noise ratio, a theoretical study.Med Phys. 2024 Apr;51(4):2871-2881. doi: 10.1002/mp.17010. Epub 2024 Mar 4. Med Phys. 2024. PMID: 38436473 Free PMC article.
-
Standardization and Quantitative Imaging With Photon-Counting Detector CT.Invest Radiol. 2023 Jul 1;58(7):451-458. doi: 10.1097/RLI.0000000000000948. Epub 2023 Jan 5. Invest Radiol. 2023. PMID: 36728452 Free PMC article. Review.
References
-
- Johnson TR, Krauss B, Sedlmair M, et al. . Material differentiation by dual energy CT: initial experience. Eur Radiol 2007;17(6):1510–1517. - PubMed
-
- Graser A, Johnson TR, Bader M, et al. . Dual energy CT characterization of urinary calculi: initial in vitro and clinical experience. Invest Radiol 2008;43(2):112–119. - PubMed
-
- Boll DT, Patil NA, Paulson EK, et al. . Renal stone assessment with dual-energy multidetector CT and advanced postprocessing techniques: improved characterization of renal stone composition—pilot study. Radiology 2009;250(3):813–820. - PubMed
Publication types
MeSH terms
Substances
Grants and funding
LinkOut - more resources
Full Text Sources
Other Literature Sources
Medical
