

LRIG1 inhibits hypoxia-induced vasculogenic mimicry formation via suppression of the EGFR/PI3K/AKT pathway and epithelial-to-mesenchymal transition in human glioma SHG-44 cells
- PMID: 25860915
- PMCID: PMC4463919
- DOI: 10.1007/s12192-015-0587-y
LRIG1 inhibits hypoxia-induced vasculogenic mimicry formation via suppression of the EGFR/PI3K/AKT pathway and epithelial-to-mesenchymal transition in human glioma SHG-44 cells
Abstract
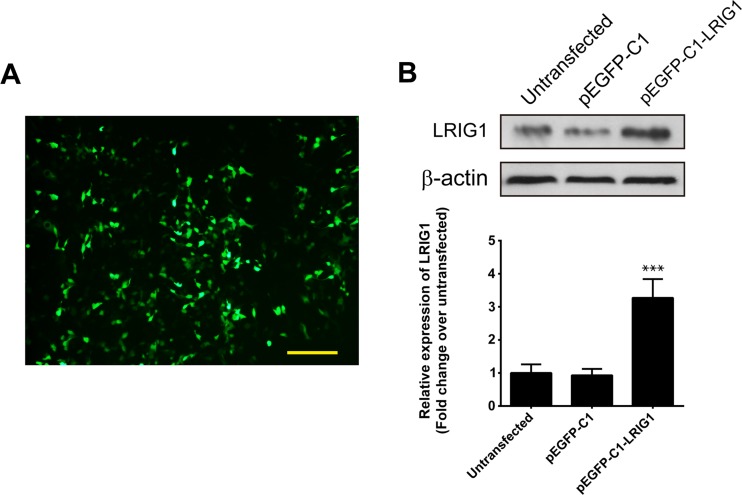
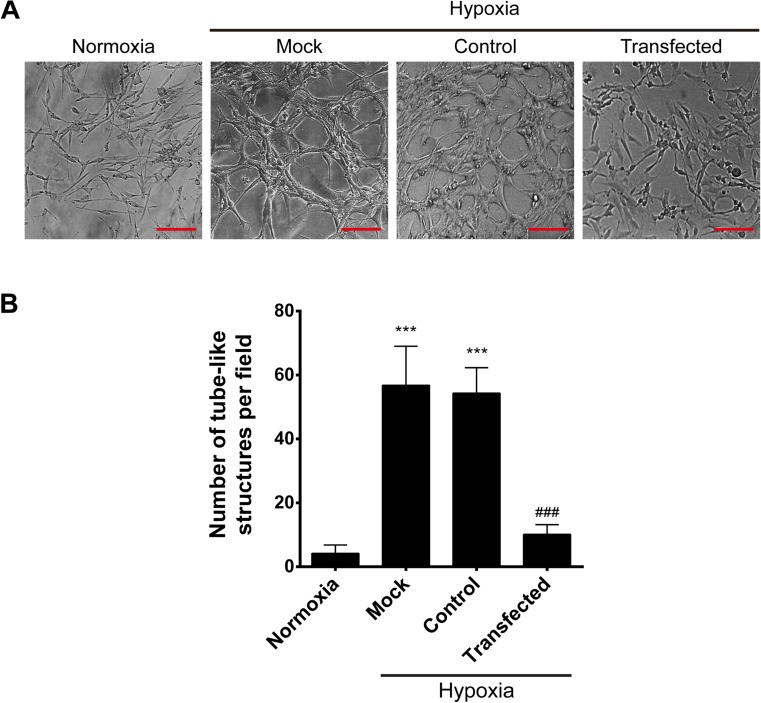
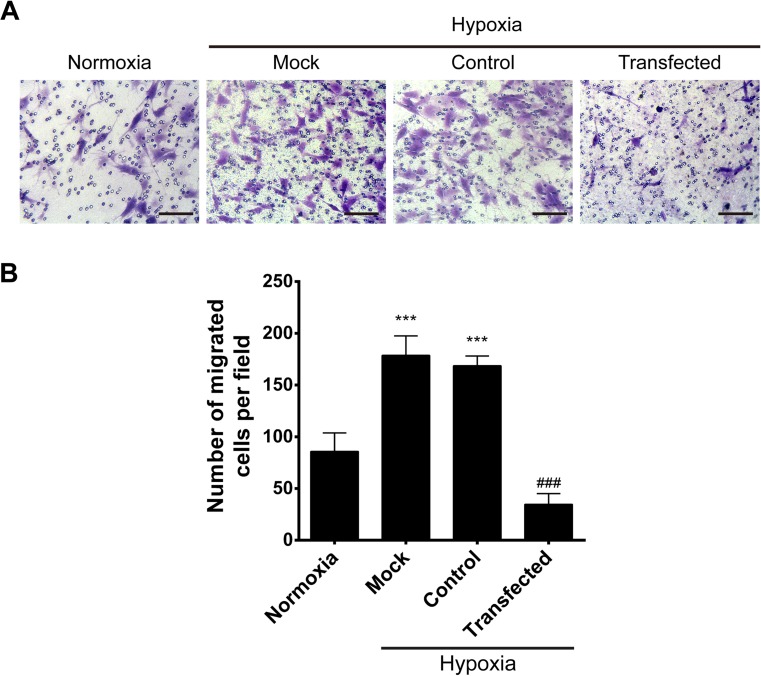
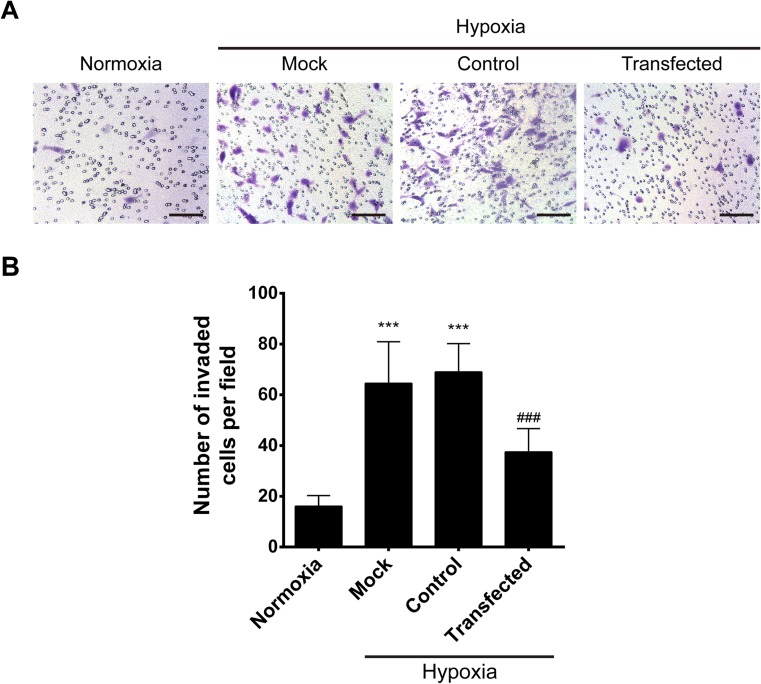
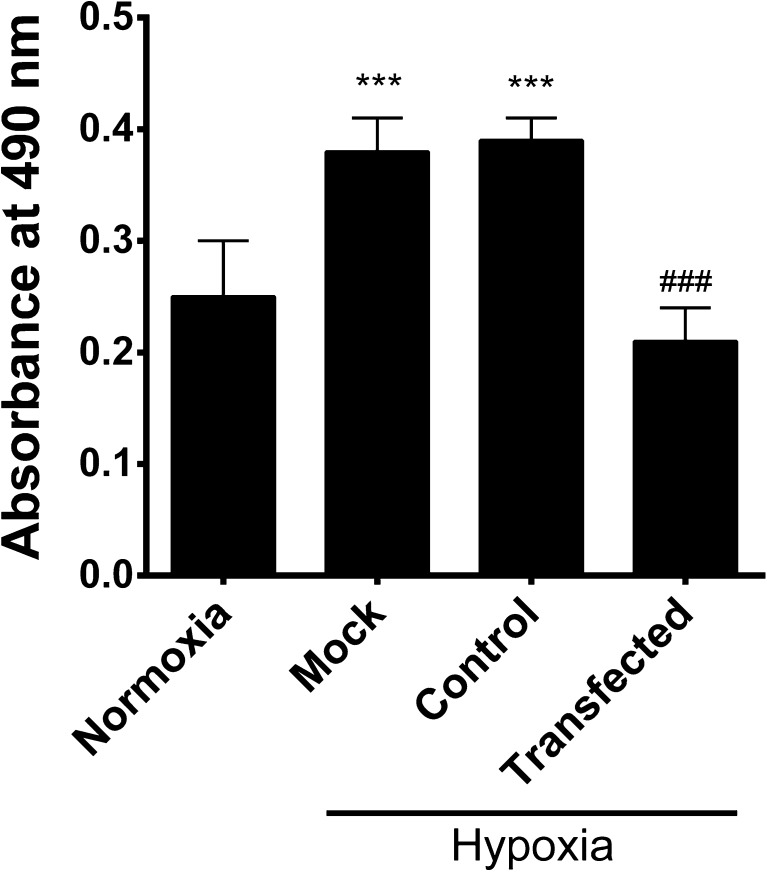
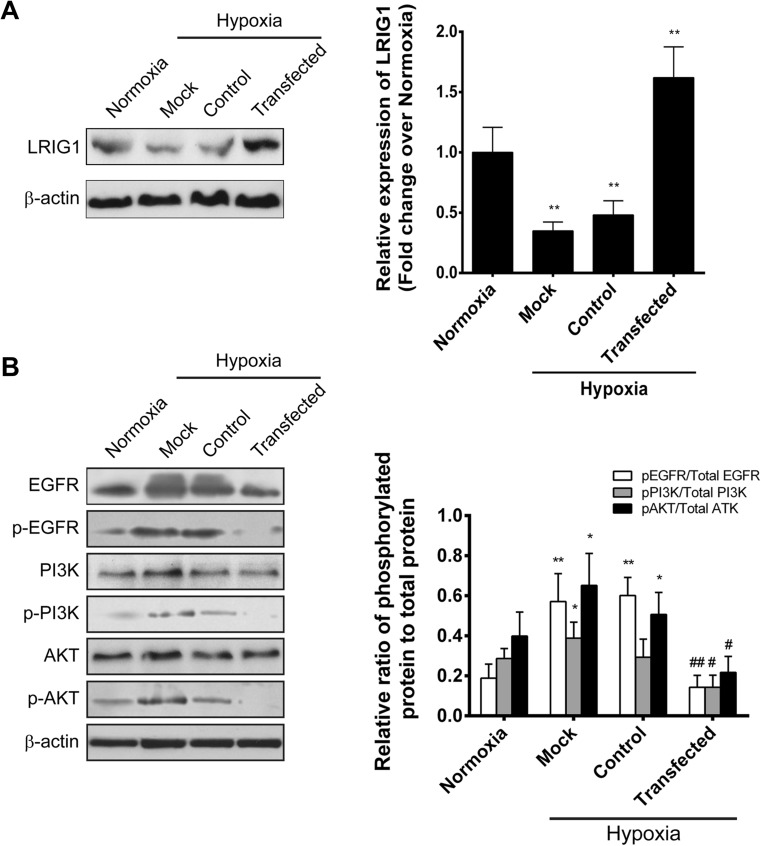
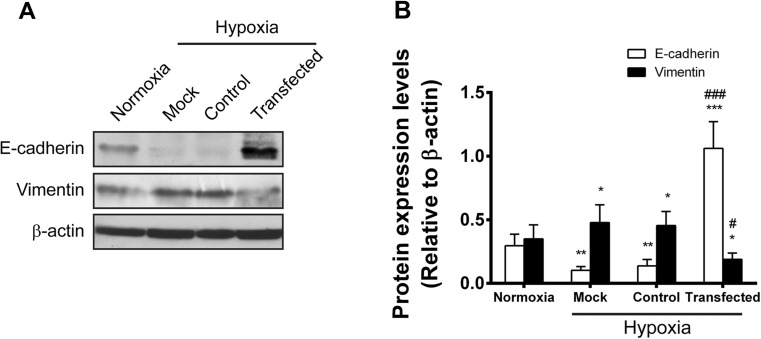
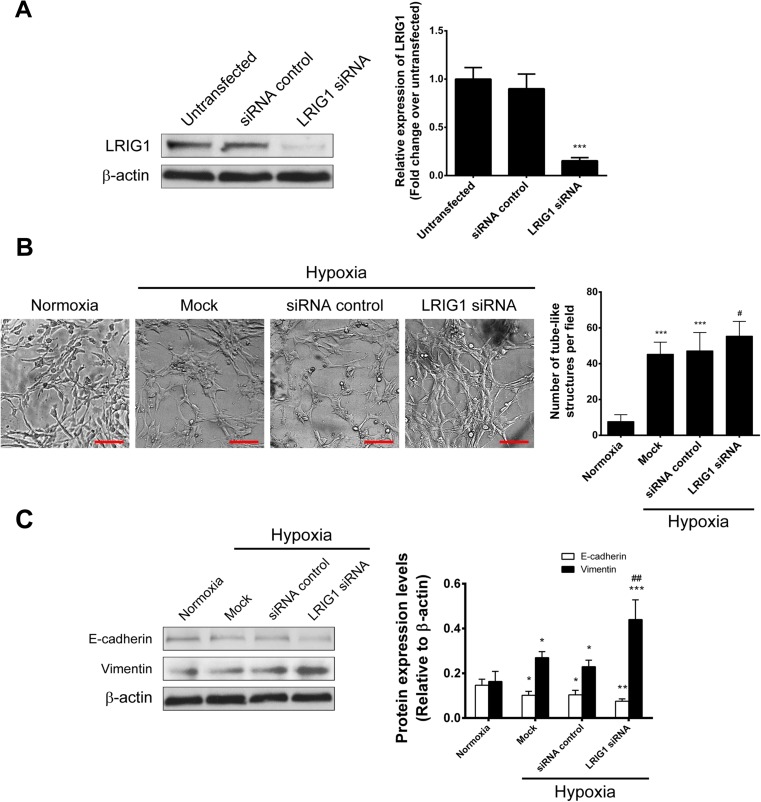
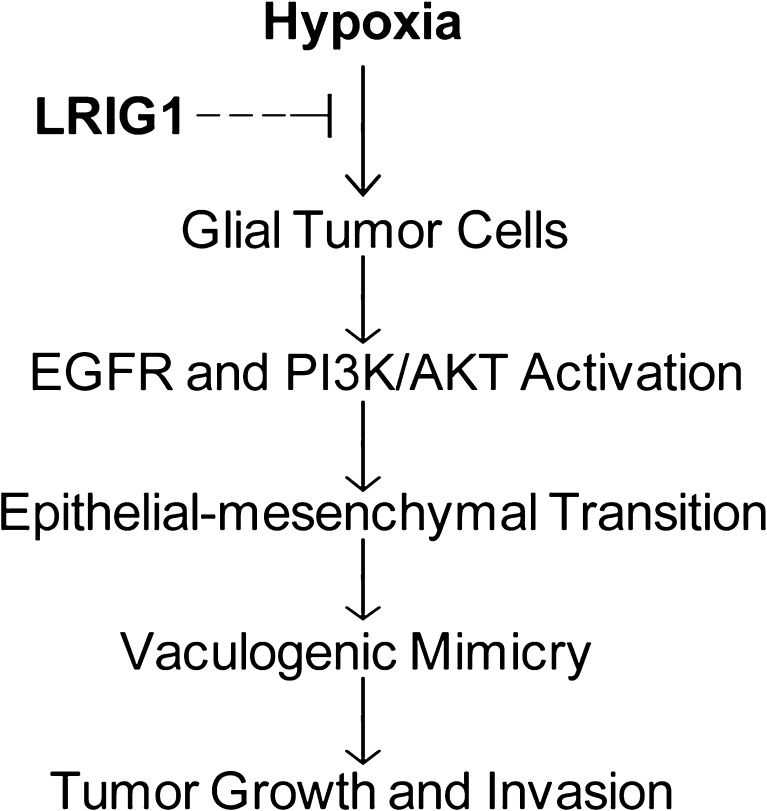
Leucine-rich repeats and immunoglobulin-like domains 1 (LRIG1) is a pan-negative regulator of the epidermal growth factor receptor (EGFR) signaling pathway. The aim of this study was to investigate the underlying mechanism of LRIG1 in the regulation of vasculogenic mimicry (VM) formation in glioma cells. We constructed an enhanced green fluorescent protein plasmid (pEGFP) system, pEGFP-C1-LRIG1, for overexpression of LRIG1, and transfected it into human glioma cell line SHG-44. Under hypoxic conditions induced by CoCl2, we investigated the effects of LRIG1 overexpression on VM formation and VM-dependent malignant behaviors including migration, invasion, and proliferation. Additionally, we explored the effects of LRIG1 on the expression levels of major components of the EGFR/PI3K/AKT pathway as well as E-cadherin and vimentin. We found that LRIG1 overexpression is able to inhibit hypoxia-induced VM formation, migration, invasion, and proliferation. Furthermore, LRIG1 overexpression counteracts hypoxia-induced increase in the expression of phosphorylated EGFR (pEGFR), PI3K (pPI3K), and AKT (pAKT) and reverts hypoxia-induced alteration in E-cadherin and vimentin expression levels. In LRIG1 knockdown SHG-44 cells, however, hypoxia-induced VM formation and alteration in E-cadherin and vimentin expression levels were exacerbated. These results suggest that the inhibitory effects of LRIG1 are most likely mediated by suppression of the EGFR/PI3K/AKT pathway and epithelial-mesenchymal transition (EMT) process. Our findings provide compelling evidence implicating LRIG1 in glioma pathophysiology, suggesting that gene therapy using LRIG1 may serve as a treatment for this disease.
Figures
Similar articles
-
Downregulation of microRNA-4295 enhances cisplatin-induced gastric cancer cell apoptosis through the EGFR/PI3K/Akt signaling pathway by targeting LRIG1.Int J Oncol. 2018 Dec;53(6):2566-2578. doi: 10.3892/ijo.2018.4595. Epub 2018 Oct 12. Int J Oncol. 2018. PMID: 30320337 Free PMC article.
-
LRIG1 acts as a critical regulator of melanoma cell invasion, migration, and vasculogenic mimicry upon hypoxia by regulating EGFR/ERK-triggered epithelial-mesenchymal transition.Biosci Rep. 2019 Jan 8;39(1):BSR20181165. doi: 10.1042/BSR20181165. Print 2019 Jan 31. Biosci Rep. 2019. PMID: 30487162 Free PMC article.
-
Upregulation of LRIG1 suppresses malignant glioma cell growth by attenuating EGFR activity.J Neurooncol. 2009 Sep;94(2):183-94. doi: 10.1007/s11060-009-9836-1. Epub 2009 Mar 20. J Neurooncol. 2009. PMID: 19300910
-
Long Non-Coding RNA HOXA-AS2 Regulates Malignant Glioma Behaviors and Vasculogenic Mimicry Formation via the MiR-373/EGFR Axis.Cell Physiol Biochem. 2018;45(1):131-147. doi: 10.1159/000486253. Epub 2017 Dec 25. Cell Physiol Biochem. 2018. Retraction in: Cell Physiol Biochem. 2023 Oct 31;57(5):410. doi: 10.33594/000000667. PMID: 29310118 Retracted.
-
Low expression of PDK1 inhibits renal cell carcinoma cell proliferation, migration, invasion and epithelial mesenchymal transition through inhibition of the PI3K-PDK1-Akt pathway.Cell Signal. 2019 Apr;56:1-14. doi: 10.1016/j.cellsig.2018.11.016. Epub 2018 Nov 20. Cell Signal. 2019. PMID: 30465826
Cited by
-
Regulation Networks Driving Vasculogenic Mimicry in Solid Tumors.Front Oncol. 2020 Jan 14;9:1419. doi: 10.3389/fonc.2019.01419. eCollection 2019. Front Oncol. 2020. PMID: 31993365 Free PMC article. Review.
-
L1CAM promotes vasculogenic mimicry formation by miR-143-3p-induced expression of hexokinase 2 in glioma.Mol Oncol. 2023 Apr;17(4):664-685. doi: 10.1002/1878-0261.13384. Epub 2023 Feb 8. Mol Oncol. 2023. PMID: 36708044 Free PMC article.
-
Over-expression of LRIG1 suppresses biological function of pituitary adenoma via attenuation of PI3K/AKT and Ras/Raf/ERK pathways in vivo and in vitro.J Huazhong Univ Sci Technolog Med Sci. 2016 Aug;36(4):558-563. doi: 10.1007/s11596-016-1625-4. Epub 2016 Jul 28. J Huazhong Univ Sci Technolog Med Sci. 2016. PMID: 27465333
-
Downregulation of microRNA-4295 enhances cisplatin-induced gastric cancer cell apoptosis through the EGFR/PI3K/Akt signaling pathway by targeting LRIG1.Int J Oncol. 2018 Dec;53(6):2566-2578. doi: 10.3892/ijo.2018.4595. Epub 2018 Oct 12. Int J Oncol. 2018. PMID: 30320337 Free PMC article.
-
m6A methylated EphA2 and VEGFA through IGF2BP2/3 regulation promotes vasculogenic mimicry in colorectal cancer via PI3K/AKT and ERK1/2 signaling.Cell Death Dis. 2022 May 21;13(5):483. doi: 10.1038/s41419-022-04950-2. Cell Death Dis. 2022. PMID: 35595748 Free PMC article.
References
MeSH terms
Substances
LinkOut - more resources
Full Text Sources
Other Literature Sources
Research Materials
Miscellaneous
