. 2015 Apr 10;10(4):e0124047.
doi: 10.1371/journal.pone.0124047. eCollection 2015.

Induction of microglia activation after infection with the non-neurotropic A/CA/04/2009 H1N1 influenza virus

Affiliations

Induction of microglia activation after infection with the non-neurotropic A/CA/04/2009 H1N1 influenza virus

Shankar Sadasivan et al. PLoS One. .

Abstract

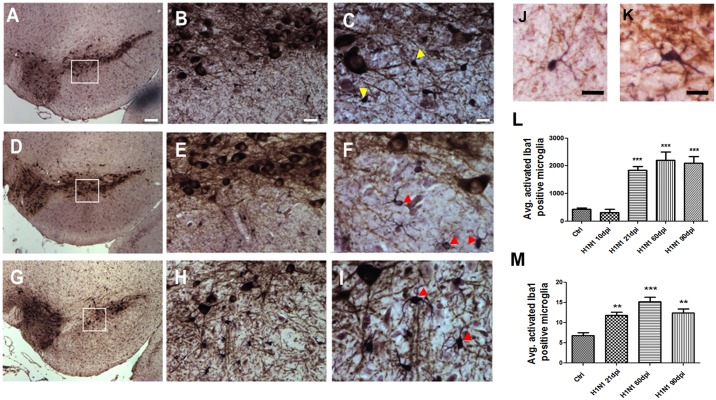
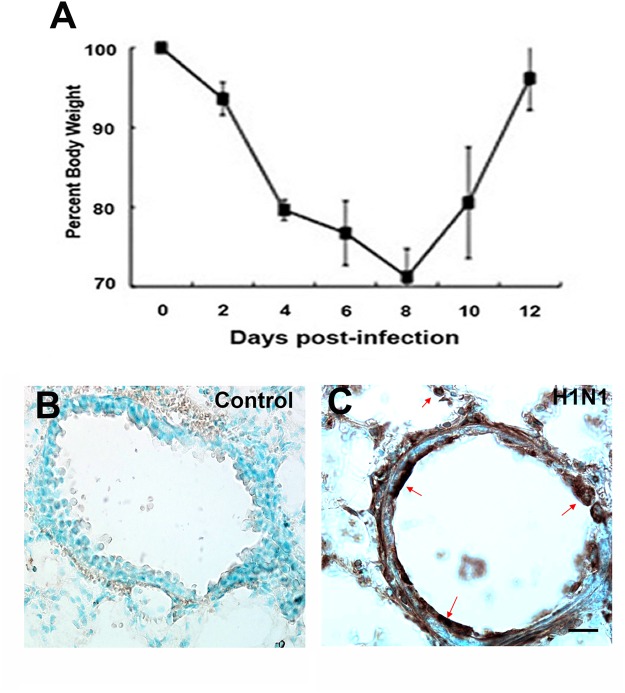
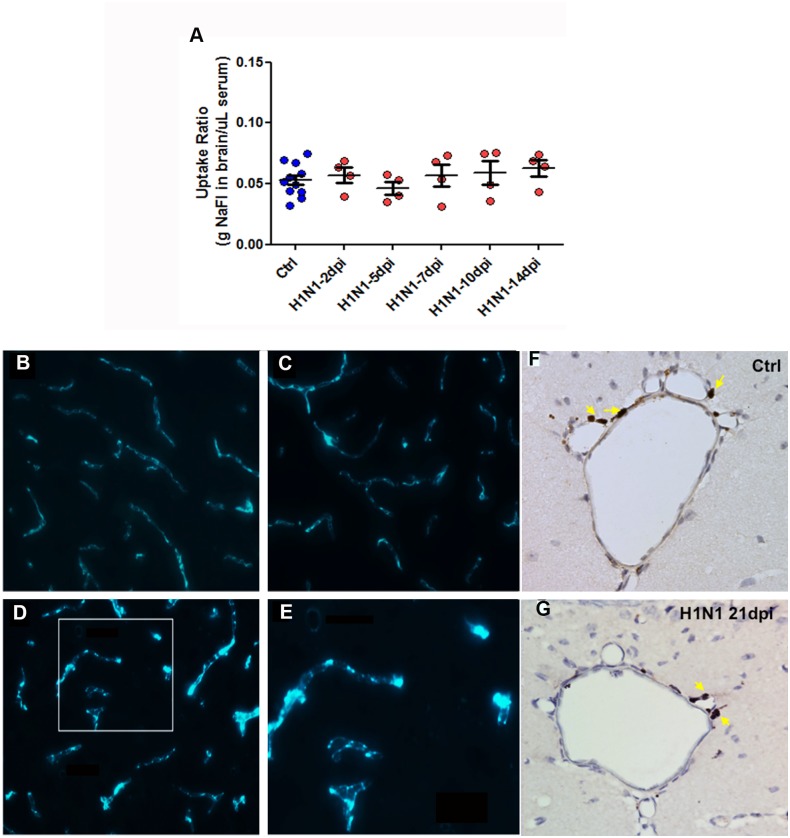
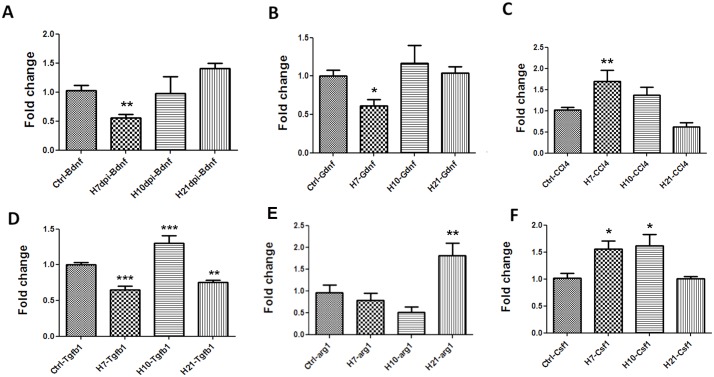
Although influenza is primarily a respiratory disease, it has been shown, in some cases, to induce encephalitis, including people acutely infected with the pandemic A/California/04/2009 (CA/09) H1N1 virus. Based on previous studies showing that the highly pathogenic avian influenza (HPAI) A/Vietnam/1203/2004 H5N1 virus was neurotropic, induced CNS inflammation and a transient parkinsonism, we examined the neurotropic and inflammatory potential of the CA/09 H1N1 virus in mice. Following intranasal inoculation, we found no evidence for CA/09 H1N1 virus neurotropism in the enteric, peripheral or central nervous systems. We did, however, observe a robust increase in microglial activity in the brain characterized by an increase in the number of activated Iba-1-positive microglia in the substantia nigra (SN) and the hippocampus, despite the absence of virus in the brain. qPCR analysis in SN tissue showed that the induction of microgliosis was preceded by reduced gene expression of the neurotrophic factors bdnf, and gdnf and increases in the immune modulatory chemokine chemokine (C-C motif) ligand 4 (ccl4). We also noted changes in the expression of transforming growth factor-1 (tgfβ1) in the SN starting at 7 days post-infection (dpi) that was sustained through 21 dpi, coupled with increases in arginase-1 (arg1) and csf1, M2 markers for microglia. Given that neuroinflammation contributes to generation and progression of a number of neurodegenerative disorders, these findings have significant implications as they highlight the possibility that influenza and perhaps other non-neurotropic viruses can initiate inflammatory signals via microglia activation in the brain and contribute to, but not necessarily be the primary cause of, neurodegenerative disorders.


Conflict of interest statement

Competing Interests: Richard Jay Smeyne, Ph.D. is a member of the PLOS ONE Editorial Board; but understand that this does not alter the authors' adherence to PLOS ONE Editorial policies and criteria.

Figures

Fig 1
Fig 1. H1N1 infection results in increased numbers of activated Iba-1 positive microglia in the substantia nigra pars compacta (SNpc) region of the brain.
Representative images presented here of the SNpc from saline-treated (A-C) or H1N1 [21dpi (D-F) & 60 dpi (G-I)-infected] demonstrate Iba-1 positive microglia with different morphology (yellow arrowheads-resting; red arrowheads-activated). The inset box demonstrates the magnified regions of the SNpc (20X and 40X, respectively) to better demonstrate the morphology of Iba-1 positive microglia. Magnified images of Iba-1 positive microglia show resting (J) and activated morphology (K). Stereological estimates of Iba-1 positive activated microglia in the SNpc (L) and dentate gyrus of the hippocampus (M) are graphically represented. Graph demonstrates stereologically acquired numbers of activated morphology Iba-1 positive microglia in the SNpc following 21 dpi, 60 dpi and 90 dpi compared to saline administered controls (n = 5). All statistics were one-way ANOVA followed by Dunnett’s post-hoc comparisons. ***p≤0.001 compared to control, **** p≤0.0001 compared to control. Scale Bars: A,D,G 100 μm, B,E,F 20 μm, C,F,I, 10 μm, J,K 10 μm.
Fig 2
Fig 2. Positive CA/09 H1N1 infection results in weight loss in infected mice and is detected using anti-NP.
A) 8-weeks old female C57BL/6J mice infected intranasally with CA/09 H1N1 exhibited a 30% loss of body weight; considered to be a positive sign of infection (n = 20). (B,C) Representative images of lung sections immunostained with influenza nucleoprotein antibody (NP) from saline administered controls and CA/09 infected (3 dpi) mice, respectively. Positive presence of viral infection was detected using anti-NP in lungs at 3 dpi (arrows). Scale Bars B,C = 25 μm.
Fig 3
Fig 3. Blood brain barrier (BBB) is uncompromised accompanied with lack of T-cell infiltration in the brain parenchyma following CA/09 H1N1 infection.
(A) Blood brain barrier integrity was investigated by plotting the sodium fluorescein dye uptake ratio in the brain/μl serum in mice either infected with CA/09 (H1N1) or administered saline (Ctrl) at 2, 5, 7, 10 and 14 dpi (n = 4/infection group). One-way ANOVA statistical test did not yield any significant differences between infected and saline groups. Representative images (n = 3) demonstrating FITC-conjugated albumin contained in the blood vessels of brain parenchyma among animals administered saline (B) and H1N1-infected (C). Lipopolysaccharide (LPS; 2x3mg/kg) was used as a positive control to cause BBB permeability (D). Arrow indicates permeation of the FITC-conjugated album into the parenchyma. The inset box has been magnified to better represent the presence of fluorescein signal in the parenchyma (E). Also, immunostaining with anti-CD3 revealed the concentration of T-cells along the blood vessels or around the choroid plexus regions of the brain rather than the brain parenchyma in both saline-controls (F) and H1N1-infected (G). Arrows indicate anti-CD3 positive T-cell population around blood vessels. Representative images were acquired at 40X magnification (n = 3). Scale bars: A,B,C = 50 μm, B,D = 25μm, E,F = 100μm.
Fig 4
Fig 4. CA/09 H1N1 infection causes gene expression changes in the substantia nigra.
Fold change values in mRNA expression presented are normalized against saline controls (Ctrl) in the substantia nigra at 7 (H7), 10 (H10) and 21 (H21) days post-infection (dpi). The genes probed and represented here include A) bdnf, B) gdnf, C) ccl4, D) tgfβ1, E) arg1 and F) csf1. One-way ANOVA statistical analyses yielded significant differences between controls and infected groups (n = 5). *** indicates p≤0.0001 compared to controls; ** indicates p≤0.001 compared to controls; * indicates p≤0.01 compared to controls.
Fig 5
Fig 5. Gene expression changes in the hippocampus at 7 days post CA/09 H1N1 infection.
Fold change in mRNA expression of A) ccl4, B) tgfβ1, C) arg1, D) csf1, E) bdnf and F) gdnf in the hippocampus 7, 10 and 21 days post-H1N1 infection normalized against saline controls (Ctrl). Data is presented as means ± S.E.M. * indicates p≤0.01 compared to control (n = 5). β-actin was used as a housekeeping control gene.

References

    1. Yoon SW, Webby RJ, Webster RG. Evolution and Ecology of Influenza A Viruses. Curr Top Microbiol Immunol. 2014; 385: 359–375. 10.1007/82_2014_396 - DOI - PubMed
    1. Fuchigami T, Imai Y, Hasegawa M, Ishii W, Endo A, Arakawa C, et al. Acute encephalopathy with pandemic (H1N1) 2009 virus infection. Pediatr Emerg Care. 2012; 28: 998–1002. 10.1097/PEC.0b013e31826ca999 - DOI - PubMed
    1. Studahl M. Influenza virus and CNS manifestations. J Clin Virol. 2003; 28: 225–232. - PubMed
    1. Ekstrand JJ. Neurologic complications of influenza. Semin Pediatr Neurol. 2012; 19: 96–100. 10.1016/j.spen.2012.02.004 - DOI - PubMed
    1. Maeda K, Idehara R. Acute disseminated encephalomyelitis following 2009 H1N1 influenza vaccination. Intern Med. 2012; 51: 1931–1933. - PubMed

Publication types

MeSH terms