. 2015 May 15;194(10):4846-59.
doi: 10.4049/jimmunol.1402295. Epub 2015 Apr 10.

Obesity Increases Mortality and Modulates the Lung Metabolome during Pandemic H1N1 Influenza Virus Infection in Mice

Affiliations

Obesity Increases Mortality and Modulates the Lung Metabolome during Pandemic H1N1 Influenza Virus Infection in Mice

J Justin Milner et al. J Immunol. .

Abstract

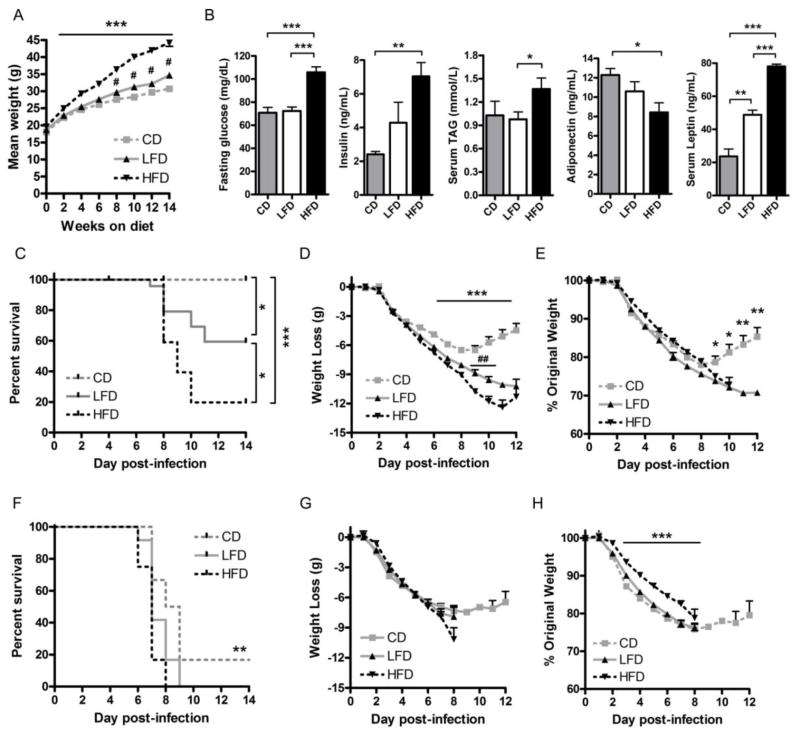
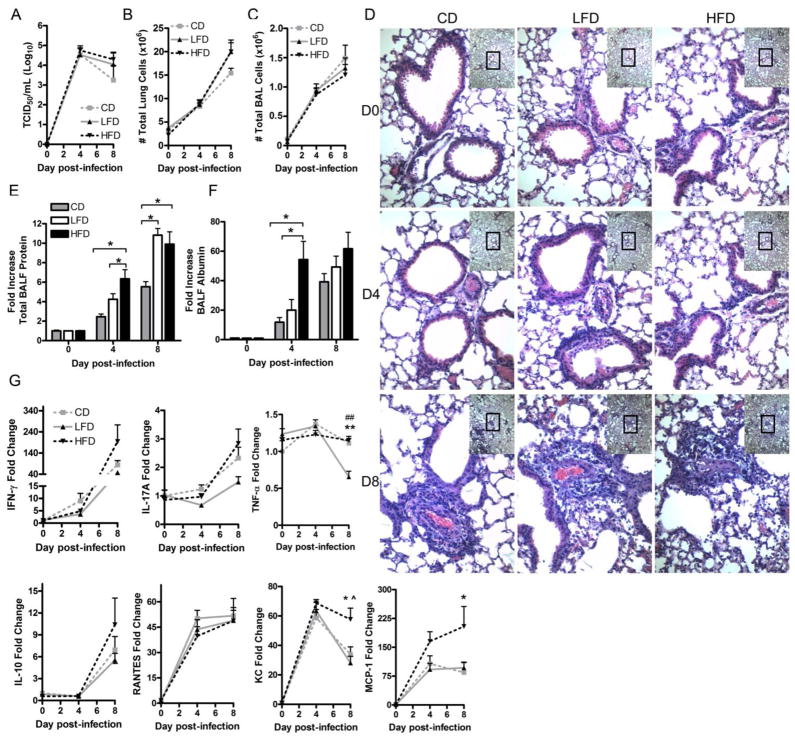
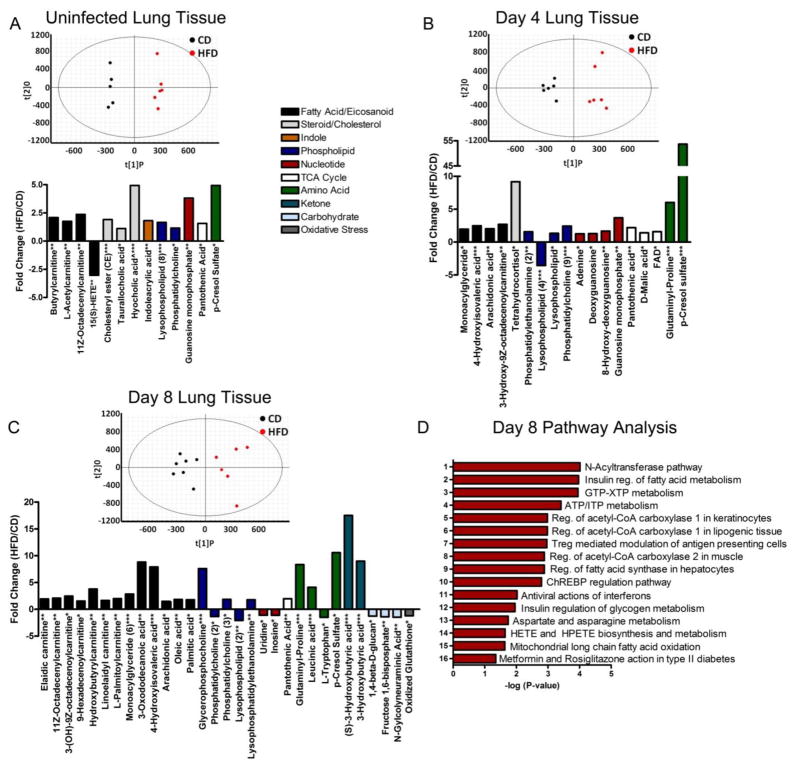
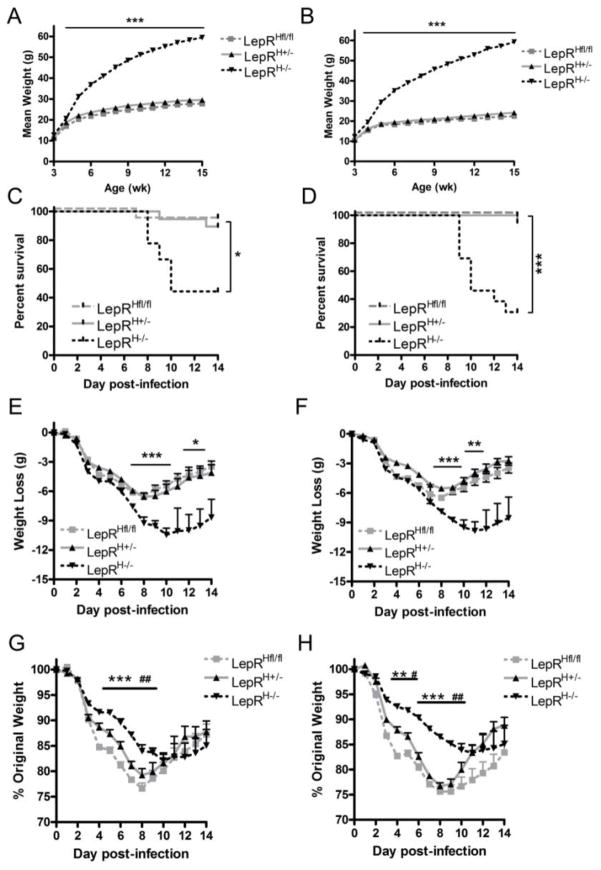
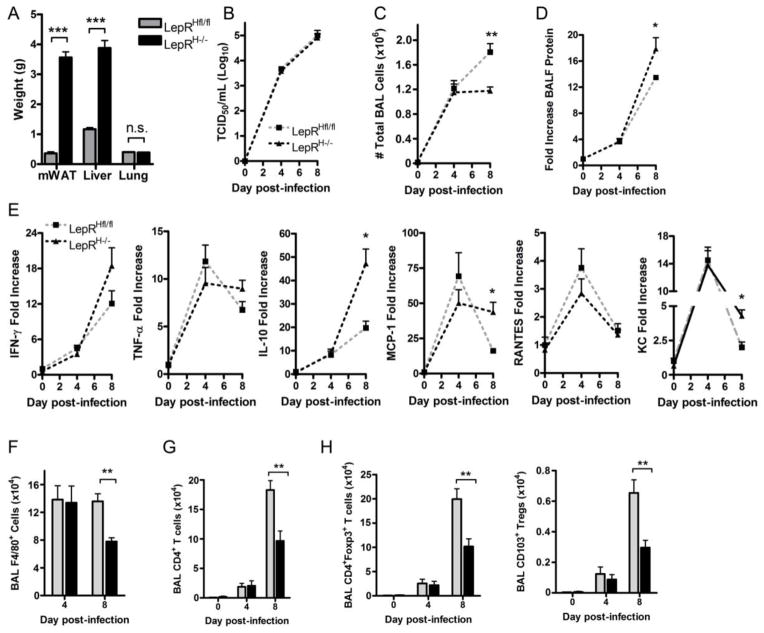
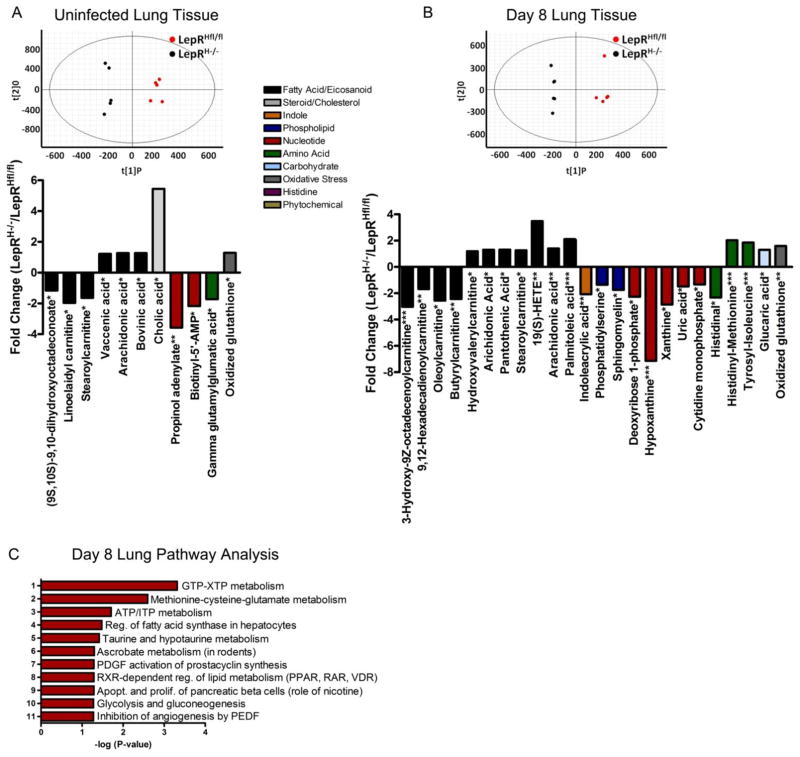
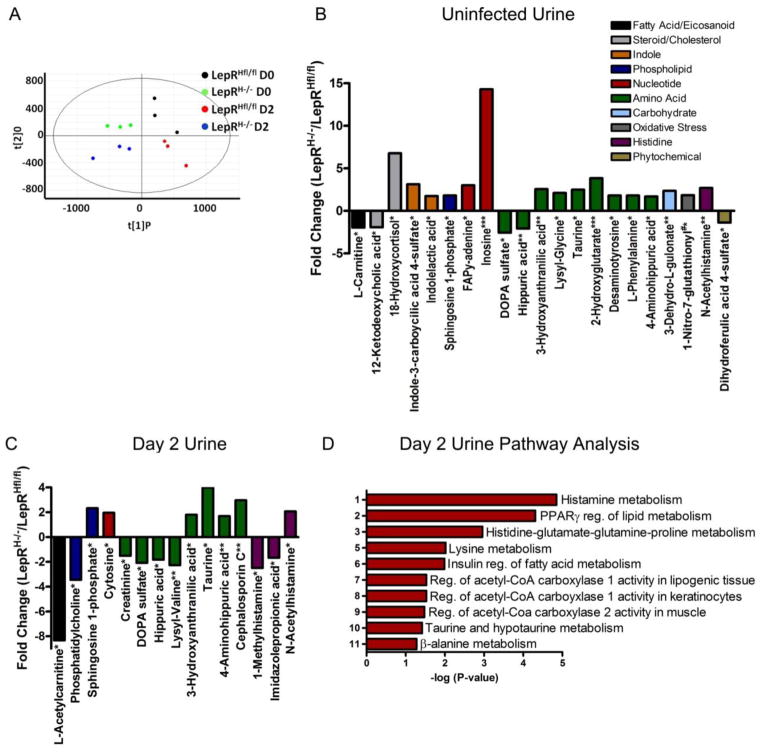
Obese individuals are at greater risk for hospitalization and death from infection with the 2009 pandemic H1N1 influenza virus (pH1N1). In this study, diet-induced and genetic-induced obese mouse models were used to uncover potential mechanisms by which obesity increases pH1N1 severity. High-fat diet-induced and genetic-induced obese mice exhibited greater pH1N1 mortality, lung inflammatory responses, and excess lung damage despite similar levels of viral burden compared with lean control mice. Furthermore, obese mice had fewer bronchoalveolar macrophages and regulatory T cells during infection. Obesity is inherently a metabolic disease, and metabolic profiling has found widespread usage in metabolic and infectious disease models for identifying biomarkers and enhancing understanding of complex mechanisms of disease. To further characterize the consequences of obesity on pH1N1 infection responses, we performed global liquid chromatography-mass spectrometry metabolic profiling of lung tissue and urine. A number of metabolites were perturbed by obesity both prior to and during infection. Uncovered metabolic signatures were used to identify changes in metabolic pathways that were differentially altered in the lungs of obese mice such as fatty acid, phospholipid, and nucleotide metabolism. Taken together, obesity induces distinct alterations in the lung metabolome, perhaps contributing to aberrant pH1N1 immune responses.


Figures

Figure 1
Figure 1
HFD-induced obesity increases pH1N1 morbidity and mortality. A, Weanling, male, C57BL6/J mice were randomly placed on a high fat (HFD, 60% kcal fat), low fat (LFD, 10% kcal fat) or chow diet (CD 14% kcal fat) for 14 wks (n>30). B, Mice were fasted overnight and blood glucose was measured (n=8) as well as non-fasted serum insulin, TAG, adiponectin, and leptin (n=6–7). C, After 14–16 wks of dietary exposure, mice were infected intranasally with 5.8 ×10² TCID50 pH1N1 and monitored for death (n≥21). D/E, Absolute weight loss (D) and percent weight loss (E) normalized to day 0, pre-infection weight over the course of the pH1N1 infection (n≥21). F, After 14–15 wks of dietary exposure, mice were infected with 1.3×10³ TCID50 and mortality was monitored (n=12). G/H, Absolute weight loss (G) and percent weight loss normalized to day 0, pre-infection weight (H) over the course of the 1.3×10³ TCID50 pH1N1 infection (n=12). Each bar or data point represents mean ± SEM. *p<0.05, **p<0.005, ***p<0.0005 comparing HFD with LFD and CD mice, and #p<0.05 ##p<0.005 comparing LFD and HFD mice.
Figure 2
Figure 2
HFD mice exhibit greater pH1N1 lung damage and inflammation. A, BALF viral titers after 5.8×10² TCID50 pH1N1 infection (n=4 for uninfected mice and n=7–8 at 4 and 8 dpi). B/C, Total number of BAL cells (B) and lung cells (C, n≥8). D, H&E stained lung pathology slides (n=6–8). Each pathology image represents a 40x magnification of the designated area shown in the 4x magnified image in the top right of each field. E/F, Fold increase of BALF protein (E, n=6–10) and BALF albumin (F, n=5–7) during the pH1N1 infection. Fold increase normalized to uninfected mice within each dietary group. G, Fold change of BALF cytokine concentrations between CD, LFD and HFD mice determined from a multiplex assay (n=5–8). Each bar or data point represents mean ± SEM. *p<0.05, **p<0.005 comparing HFD with CD mice, ^p<0.05 comparing HFD with LFD mice, and #p<0.05 comparing CD with LFD mice.
Figure 3
Figure 3
HFD-induced obese mice have fewer BAL macrophages and Tregs during pH1N1 infection. A, Representative flow cytometry histograms of BAL macrophages, NK cells and neutrophils of CD, LFD and HFD mice at 4 dpi following a 5.8×10² TCID50 pH1N1 infection. Fluorescence minus one (FMO) staining controls are shaded solid grey. B, Percentage (top) and total number (bottom) of BAL F4/80+ cells, NK1.1+ cells and Ly6G+ cells (n=5–8). Percentage represents of total CD3neg cells. C–D, Number of BAL CD4+ (C) and CD8+ T cells (D). E, Representative Treg flow cytometry gating scheme. F–G, Number of BAL Tregs (F) and activated Tregs (G). H–I, Number of Lung Tregs (H) and mLN Tregs (I). For BAL cells n=3 of two pooled mice at day 0 and n=5–8 at 4 and 8 dpi. For mLN and lung cells, n=5–10. Each bar represents mean ± SEM. *p<0.05, **p<0.005, ***p<0.0005.
Figure 4
Figure 4
HFD-induced obesity alters lung metabolic pathways during pH1N1 infection. A–C, OPLS-DA plot and differentially altered metabolites of lung samples from uninfected (A), 4 dpi (B) and 8 dpi (C) CD and HFD mice (n=5–6). Next to each metabolite, *p<0.05, **p<0.005, ***p<0.0005, and numbers in parentheses represent the number of species for that metabolite that are significantly different between HFD and LFD (i.e. methodology was not able to differentiate the multiple species). D, Pathway enrichment analysis generated in GeneGo of metabolic pathways significantly different between CD and HFD mice at 8 dpi. ChREBP, carbohydrate-responsive element-binding protein; HETE, hydroxyeicosatetraenoic acid; HPETE, hydroperoxyeicosatetraenoic acid.
Figure 5
Figure 5
Genetically obese, LepRH−/− mice, are more susceptible to pH1N1 mortality compared with lean LepRHfl/fl mice. A–B, Weight gain of male (A) and female (B) mice lacking leptin receptor signaling in hypothalamic neurons LepRH−/−, heterozygous mice LepRH+/− and fully floxed LepRHfl/fl mice (n≥9). C–D, Mortality curves for male (C) and female (D) mice after infection with 5.8×10² TCID50 pH1N1 at 14–16 wk of age (n≥9). E–F, Total weight loss for male (E) and female (F) mice after pH1N1 infection (n≥9). G–H, Percent weight loss for male (G) and female (H) mice after pH1N1 infection (n≥9. Each data point represents mean ± SEM. *p<0.05, **p<0.005, ***p<0.0005. In Figures A–F, *p<0.05, **p<0.005 or ***p<0.0005 comparing LepRH−/− with both LepRH−/− and LepRH+/− mice. For Figures G–H, **p<0.05 or ***p<0.0005 comparing LepRH−/− with LepRHfl/fl mice and #p<0.05 or ##p<0.005 comparing LepRH−/− with LepRH+/− mice.
Figure 6
Figure 6
Obese LepRH−/− mice exhibit greater pH1N1 lung damage and inflammation. A, Mean weight of mesenteric white adipose tissue, liver and lungs of LepRHfl/fl and LepRH−/− mice prior to infection (n=7–10). B, BALF viral titers following a 5.8×10² TCID50 pH1N1 infection (n=5–8). C, Total number of BAL cells during infection (at 0 dpi, n=4–5 from two pooled samples and at 4 and 8 dpi, n= 6–7). D, Fold increase in total BALF protein levels. Fold increase normalized to uninfected mice within each dietary group (n=6–8). E, Fold change in gene expression of lung cytokines and chemokines (n=4–6). F–H, Number of BAL CD3F4/80+ macrophages (F), CD4+ T cells (G), Tregs and activated Tregs (H, at 0 dpi, n=4–5 from two pooled samples and at 4/8 dpi, n= 6–7). Each bar represents mean ± SEM. *p<0.05, **p<0.005, ***p<0.0005.
Figure 7
Figure 7
Metabolic profiling reveals alterations in distinct metabolic networks in lungs of pH1N1 infected LepRH−/− obese mice. A–B, OPLS-DA plot and differentially altered metabolites of lung samples from uninfected (A) and 8 dpi (B) LepRHfl/fl and LepRH−/− mice (n=5–6). C, Pathway analysis generated in GeneGo of all pathways significantly different from lung tissue of LepRHfl/fl and LepRH−/− mice at 8 dpi. Next to each metabolite, *p<0.05, **p<0.005, ***p<0.0005. PDGF, platelet-derived growth factor; RXR, retinoid X receptor; PPAR, peroxisome proliferator-activated receptor; RAR, retinoic acid receptor; VDR, vitamin D receptor; PEDF, pigment epithelium-derived factor.
Figure 8
Figure 8
Metabolic profiling reveals alterations in distinct metabolic networks in urine of pH1N1 infected obese LepRH−/− mice. A, OPLS-DA plot from urine samples from the same cohort of uninfected and 2 dpi infected mice. B–C, Differentially altered metabolites in the urine of uninfected (B) and at 2 dpi (C) LepRH−/− mice compared with lean LepRHfl/fl mice (n=3). D, Pathway analysis generated in GeneGo of all pathways significantly different at 2 dpi between LepRHfl/fl and LepRH−/− mice. Next to each metabolite, *p<0.05, **p<0.005, ***p<0.0005. # represents 1-Nitro-7-glutathionyl-8-hydroxy-7,8-dihydronapthalene. PPARγ, peroxisome proliferator-activated receptor γ.

References

    1. Centers for Disease Control and Prevention. 2009 H1N1: Overview of a Pandemic. 2010 Dec; [cited 19 August 2014] http://www.cdc.gov/h1n1flu/yearinreview/yir1.html.
    1. World Health Organization. A (H1N1) seasonal influenza virus: guidance on prevention and treatment. 2014 Feb; [cited 19 August 2014] http://www.emro.who.int/egy/egypt-news/a-h1n1-is-a-seasonal-influenza-vi....
    1. Hanslik T, Boelle PY, Flahault A. Preliminary estimation of risk factors for admission to intensive care units and for death in patients infected with A (H1N1) 2009 influenza virus, France, 2009–2010. PLoS Currents. 2010;2(RRN1150) - PMC - PubMed
    1. Louie JK, Acosta M, Samuel MC, Schechter R, Vugia DJ, Harriman K, Matyas BT the California Pandemic (H1N1) Working Group . A Novel Risk Factor for a Novel Virus: Obesity and 2009 Pandemic Influenza A (H1N1) Clin Infect Dis. 2011;52:301–312. - PubMed
    1. Santa-Olalla Peralta P, Cortes-Garcia M, Vicente-Herrero M, Castrillo-Villamandos C, Arias-Bohigas P, Pachon-del Amo I, Sierra-Moros MJ Surveillance Group for New Influenza A(H1N1) Virus Investigation and Control Team in Spain . Risk factors for disease severity among hospitalised patients with 2009 pandemic influenza A (H1N1) in Spain, April - December 2009. Euro Surveill. 2010;15:19667. - PubMed

Publication types