

Use of mechanistic models to integrate and analyze multiple proteomic datasets
- PMID: 25863072
- PMCID: PMC4390817
- DOI: 10.1016/j.bpj.2015.02.030
Use of mechanistic models to integrate and analyze multiple proteomic datasets
Abstract
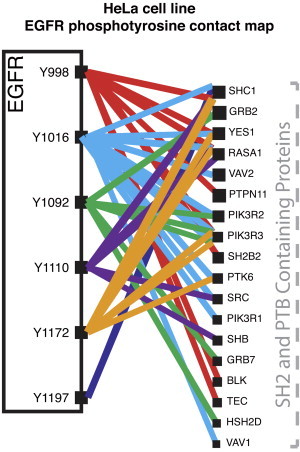
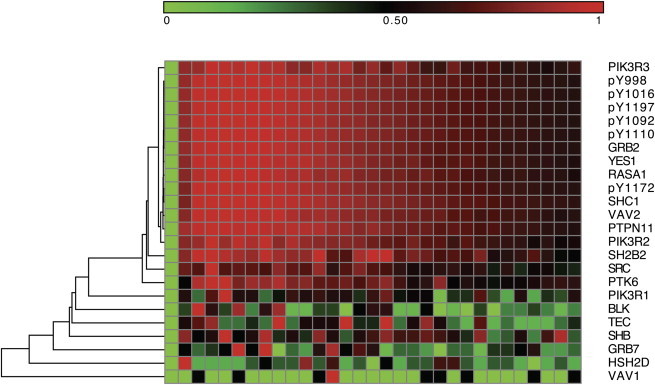
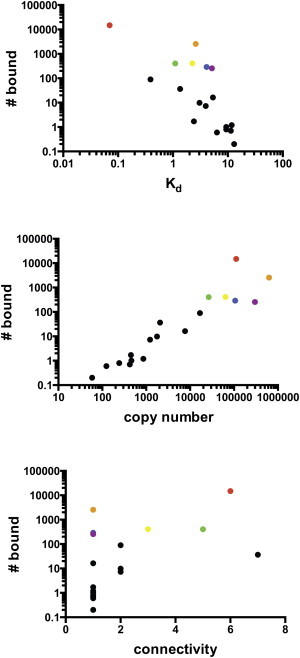
Proteins in cell signaling networks tend to interact promiscuously through low-affinity interactions. Consequently, evaluating the physiological importance of mapped interactions can be difficult. Attempts to do so have tended to focus on single, measurable physicochemical factors, such as affinity or abundance. For example, interaction importance has been assessed on the basis of the relative affinities of binding partners for a protein of interest, such as a receptor. However, multiple factors can be expected to simultaneously influence the recruitment of proteins to a receptor (and the potential of these proteins to contribute to receptor signaling), including affinity, abundance, and competition, which is a network property. Here, we demonstrate that measurements of protein copy numbers and binding affinities can be integrated within the framework of a mechanistic, computational model that accounts for mass action and competition. We use cell line-specific models to rank the relative importance of protein-protein interactions in the epidermal growth factor receptor (EGFR) signaling network for 11 different cell lines. Each model accounts for experimentally characterized interactions of six autophosphorylation sites in EGFR with proteins containing a Src homology 2 and/or phosphotyrosine-binding domain. We measure importance as the predicted maximal extent of recruitment of a protein to EGFR following ligand-stimulated activation of EGFR signaling. We find that interactions ranked highly by this metric include experimentally detected interactions. Proteins with high importance rank in multiple cell lines include proteins with recognized, well-characterized roles in EGFR signaling, such as GRB2 and SHC1, as well as a protein with a less well-defined role, YES1. Our results reveal potential cell line-specific differences in recruitment.
Copyright © 2015 Biophysical Society. Published by Elsevier Inc. All rights reserved.
Figures
References
-
- Nobeli I., Favia A.D., Thornton J.M. Protein promiscuity and its implications for biotechnology. Nat. Biotechnol. 2009;27:157–167. - PubMed
Publication types
MeSH terms
Substances
Grants and funding
LinkOut - more resources
Full Text Sources
Other Literature Sources
Research Materials
Miscellaneous
