

Isoform-selective Genetic Inhibition of Constitutive Cytosolic Hsp70 Activity Promotes Client Tau Degradation Using an Altered Co-chaperone Complement
- PMID: 25864199
- PMCID: PMC4505567
- DOI: 10.1074/jbc.M115.637595
Isoform-selective Genetic Inhibition of Constitutive Cytosolic Hsp70 Activity Promotes Client Tau Degradation Using an Altered Co-chaperone Complement
Abstract
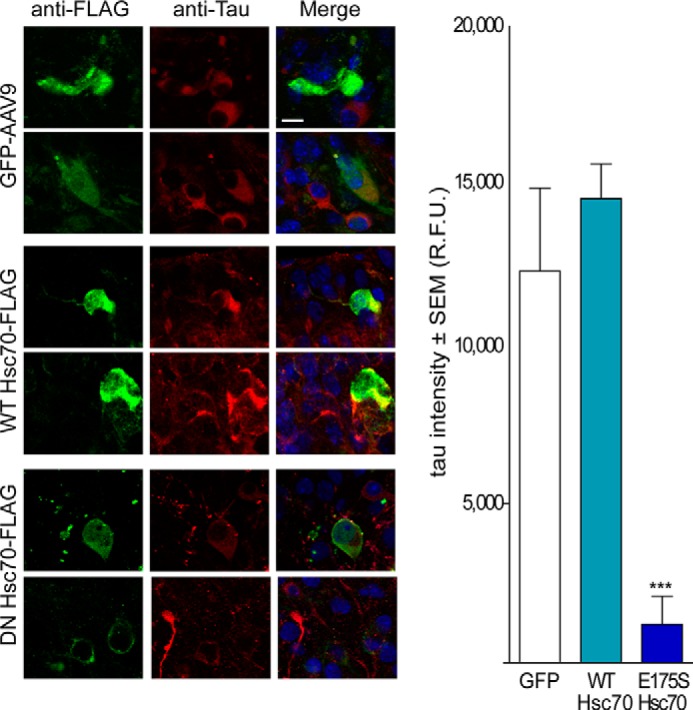
The constitutively expressed heat shock protein 70 kDa (Hsc70) is a major chaperone protein responsible for maintaining proteostasis, yet how its structure translates into functional decisions regarding client fate is still unclear. We previously showed that Hsc70 preserved aberrant Tau, but it remained unknown if selective inhibition of the activity of this Hsp70 isoform could facilitate Tau clearance. Using single point mutations in the nucleotide binding domain, we assessed the effect of several mutations on the functions of human Hsc70. Biochemical characterization revealed that one mutation abolished both Hsc70 ATPase and refolding activities. This variant resembled the ADP-bound conformer at all times yet remained able to interact with cofactors, nucleotides, and substrates appropriately, resembling a dominant negative Hsc70 (DN-Hsc70). We then assessed the effects of this DN-Hsc70 on its client Tau. DN-Hsc70 potently facilitated Tau clearance via the proteasome in cells and brain tissue, in contrast to wild type Hsc70 that stabilized Tau. Thus, DN-Hsc70 mimics the action of small molecule pan Hsp70 inhibitors with regard to Tau metabolism. This shift in Hsc70 function by a single point mutation was the result of a change in the chaperome associated with Hsc70 such that DN-Hsc70 associated more with Hsp90 and DnaJ proteins, whereas wild type Hsc70 was more associated with other Hsp70 isoforms. Thus, isoform-selective targeting of Hsc70 could be a viable therapeutic strategy for tauopathies and possibly lead to new insights in chaperone complex biology.
Keywords: 70-kilodalton heat shock protein (Hsp70); Alzheimer disease; Tau protein (Tau); chaperone; heat shock protein (HSP); inhibitor.
© 2015 by The American Society for Biochemistry and Molecular Biology, Inc.
Figures


Similar articles
-
BAG-1 associates with Hsc70.Tau complex and regulates the proteasomal degradation of Tau protein.J Biol Chem. 2007 Dec 21;282(51):37276-84. doi: 10.1074/jbc.M706379200. Epub 2007 Oct 22. J Biol Chem. 2007. PMID: 17954934
-
Imbalance of Hsp70 family variants fosters tau accumulation.FASEB J. 2013 Apr;27(4):1450-9. doi: 10.1096/fj.12-220889. Epub 2012 Dec 27. FASEB J. 2013. PMID: 23271055 Free PMC article.
-
The disorderly conduct of Hsc70 and its interaction with the Alzheimer's-related Tau protein.J Biol Chem. 2018 Jul 6;293(27):10796-10809. doi: 10.1074/jbc.RA118.002234. Epub 2018 May 15. J Biol Chem. 2018. PMID: 29764935 Free PMC article.
-
Regulation of the heat shock conjugate Hsc70 in the mammalian cell: the characterization of the anti-apoptotic protein BAG-1 provides novel insights.Biol Chem. 1998 Mar;379(3):269-74. Biol Chem. 1998. PMID: 9563821 Review.
-
Screening strategies to identify HSP70 modulators to treat Alzheimer's disease.Drug Des Devel Ther. 2015 Jan 7;9:321-31. doi: 10.2147/DDDT.S72165. eCollection 2015. Drug Des Devel Ther. 2015. PMID: 25609918 Free PMC article. Review.
Cited by
-
BIN1 favors the spreading of Tau via extracellular vesicles.Sci Rep. 2019 Jul 1;9(1):9477. doi: 10.1038/s41598-019-45676-0. Sci Rep. 2019. PMID: 31263146 Free PMC article.
-
Exploration of Benzothiazole Rhodacyanines as Allosteric Inhibitors of Protein-Protein Interactions with Heat Shock Protein 70 (Hsp70).J Med Chem. 2018 Jul 26;61(14):6163-6177. doi: 10.1021/acs.jmedchem.8b00583. Epub 2018 Jul 13. J Med Chem. 2018. PMID: 29953808 Free PMC article.
-
Heat Shock Protein 70 (Hsp70) Suppresses RIP1-Dependent Apoptotic and Necroptotic Cascades.Mol Cancer Res. 2018 Jan;16(1):58-68. doi: 10.1158/1541-7786.MCR-17-0408. Epub 2017 Sep 28. Mol Cancer Res. 2018. PMID: 28970360 Free PMC article.
-
DnaJ/Hsc70 chaperone complexes control the extracellular release of neurodegenerative-associated proteins.EMBO J. 2016 Jul 15;35(14):1537-49. doi: 10.15252/embj.201593489. Epub 2016 Jun 3. EMBO J. 2016. PMID: 27261198 Free PMC article.
-
Structure-activity relationships of cryptopleurine analogs with E-ring modifications as anti-hepatitis C virus agents.Bioorg Med Chem. 2018 Feb 1;26(3):630-636. doi: 10.1016/j.bmc.2017.12.027. Epub 2017 Dec 20. Bioorg Med Chem. 2018. PMID: 29317151 Free PMC article.
References
-
- Palleros D. R., Reid K. L., Shi L., Welch W. J., Fink A. L. (1993) ATP-induced protein-Hsp70 complex dissociation requires K+ but not ATP hydrolysis. Nature 365, 664–666 - PubMed
-
- Cheetham M. E., Jackson A. P., Anderton B. H. (1994) Regulation of 70-kDa heat-shock-protein ATPase activity and substrate binding by human DnaJ-like proteins, HSJ1a and HSJ1b. Eur. J. Biochem. 226, 99–107 - PubMed
-
- Wittung-Stafshede P., Guidry J., Horne B. E., Landry S. J. (2003) The J-domain of Hsp40 couples ATP hydrolysis to substrate capture in Hsp70. Biochemistry 42, 4937–4944 - PubMed
-
- McKay D. B. (1993) Structure and mechanism of 70-kDa heat-shock-related proteins. Adv. Protein Chem. 44, 67–98 - PubMed
-
- Mayer M. P. (2010) Gymnastics of molecular chaperones. Mol. Cell 39, 321–331 - PubMed
Publication types
MeSH terms
Substances
Grants and funding
LinkOut - more resources
Full Text Sources
Miscellaneous
