Controlled Clinical Trial
. 2015 Apr 22;86(2):591-602.
doi: 10.1016/j.neuron.2015.03.019. Epub 2015 Apr 9.

Neural mechanisms underlying human consensus decision-making

Affiliations
Controlled Clinical Trial

Neural mechanisms underlying human consensus decision-making

Shinsuke Suzuki et al. Neuron. .

Abstract

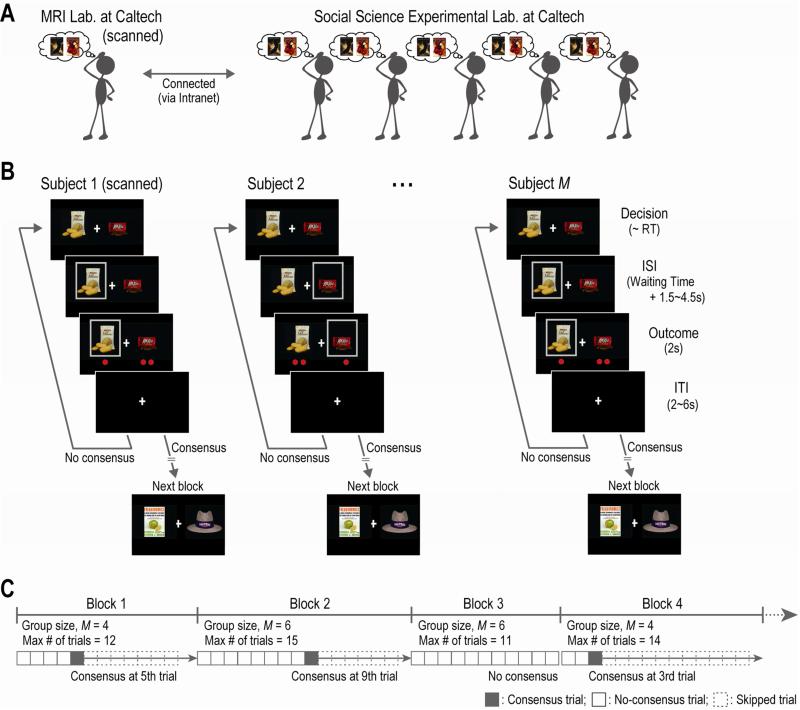
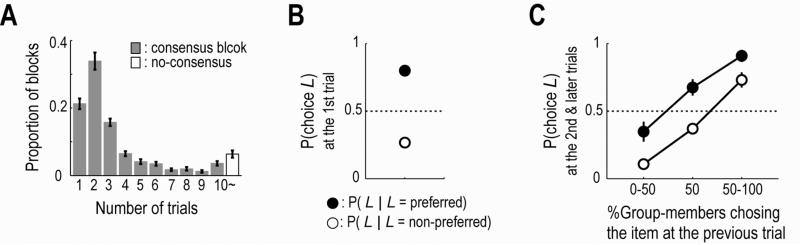
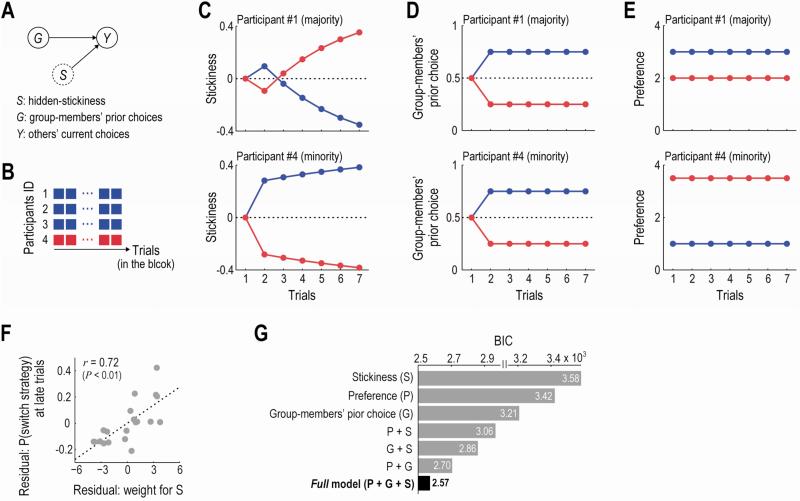
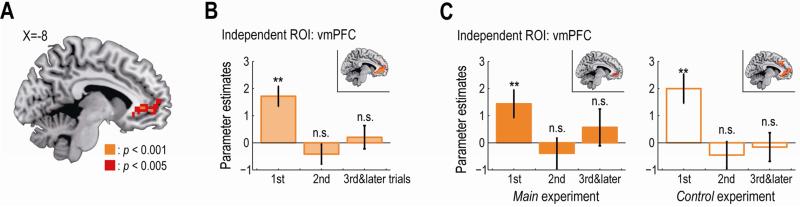
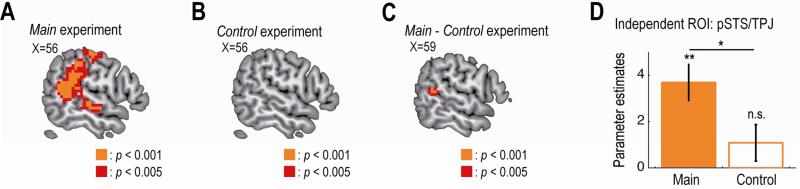
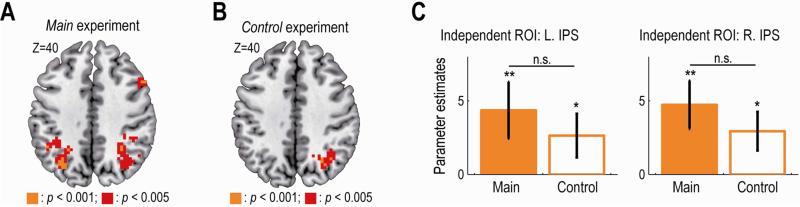
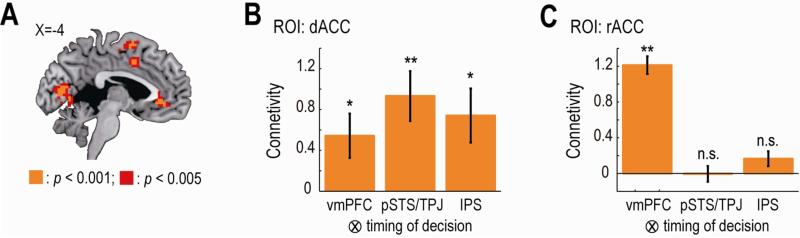
Consensus building in a group is a hallmark of animal societies, yet little is known about its underlying computational and neural mechanisms. Here, we applied a computational framework to behavioral and fMRI data from human participants performing a consensus decision-making task with up to five other participants. We found that participants reached consensus decisions through integrating their own preferences with information about the majority group members' prior choices, as well as inferences about how much each option was stuck to by the other people. These distinct decision variables were separately encoded in distinct brain areas-the ventromedial prefrontal cortex, posterior superior temporal sulcus/temporoparietal junction, and intraparietal sulcus-and were integrated in the dorsal anterior cingulate cortex. Our findings provide support for a theoretical account in which collective decisions are made through integrating multiple types of inference about oneself, others, and environments, processed in distinct brain modules.


Figures

Figure 1
Figure 1. Experimental task
(A) Illustration of the experimental setting. One participant inside the MRI scanner interacts with other participants. They try to build consensus on a choice between two items. (B) Timeline of one trial. On each trial, participants choose between two items (Decision), and the item chosen is then highlighted by a gray frame. After a waiting time for the others’ choices and a jittered delay (ISI), the other participants’ choices are indicated by red dots (Outcome). Notably, participants are not able to identify each of the others; they were informed only about the distribution of the red dots (i.e., the number of others choosing each of the two items). If they reach a consensus, they move to the next block; otherwise, they again made a choice between the same items on the next trial in the same block. RT, reaction time; ISI, inter-stimulus-interval; ITI, inter-trial-interval. (C) Overall timeline of the experiment. The experiment consists of 40 blocks: 20 six-person blocks involving six participants (M = 6) and 20 four-person blocks involving four participants (M = 4). In each block, the maximum number of trials is determined randomly. Once participants reach a consensus, the remaining trials in the blocks are skipped and they move to the next block (e.g. Block 1). If they do not build a consensus before the end of the block (e.g. Block 3), they move to the next block and have no possibility to obtain any items for that block.
Figure 2
Figure 2. Behavioral results
(A) Histogram of the number of trials in each block (mean ± SEM across participants; n = 20). Consensus block, participants reached a consensus; no-consensus block, participants failed to reach a consensus. (B) Participants’ choices on the first trial in each block. Probabilities of choosing the item presented at the left side of the screen are shown (mean ± SEM across participants). A filled circle denotes the probability when the left item was preferred by the participant, P(choice = L | L = preferred); and an open circle represents the probability when the item was not preferred, P(choice = L | L = non-preferred). The circles overlap the error bars. (C) Participants’ choices on the second and later trials in each block. Probabilities of choosing the left item are plotted as a function of percentages of the group-members who chose the item on the previous trial. As in panel B, filled and open circles denote the probabilities when the left item was preferred and when the item was not preferred, respectively.
Figure 3
Figure 3. Computational model
(A) Graphical description of the inference about the hidden stickiness of the items. The Bayesian learner infers the hidden stickiness, S, based on the belief that the others’ current choices, Y, are generated by the stickiness, S, and the group members’ prior choice, G. Dashed circle, a hidden variable; Solid circles, observable variables. (B) Example block. Three participants continue to choose the blue item, while the other one chooses the red. (C) Estimated stickiness of each item in the example block (panel B). Top, from a viewpoint of the participant #1; Bottom, from a viewpoint of the participant #4; same for panel D and E. (D) Group members’ prior choice in the example block. Percentages of group-members who chose each item on the previous trial are plotted. (E) Participants’ own preference for each item in the example block. The participant #1 prefers the blue item to the red, while the participant #4 has the opposite preference. (F) Across-participants correlation between the decision weight for the stickiness and the tendency to change their default behavior in later trials (t ≥ 4). The decision weight was estimated using the best-fitting model in panel G. The partial correlation coefficient controlling for the decision weights of the other variables was significantly positive (r = 0.72, p < 0.01). (G) Computational models’ fit to participants’ choices. Each bar denotes BIC of each model. BIC, Bayesian information criterion (smaller values indicate better fit).
Figure 4
Figure 4. Neural correlates of participants’ own preference
(A) Activity in the vmPFC significantly correlated with preference for the chosen item at the time of decision. The vmPFC activation map is thresholded at p < 0.005 uncorrected for display purpose. (B) Effect sizes of the preference in the independently identified vmPFC ROI. The effect sizes are plotted separately for the first, the second, and the later trials in each block (mean ± SEM across participants; n = 20). **p < 0.01, and n.s., non-significant as p > 0.05. Inset, activated voxels in response to the preference on the first trial (p < 0.005 uncorrected). vmPFC, ventromedial prefrontal cortex. (C) Effect sizes of the preference in the vmPFC ROI for the main and the control experiment. Left, the main experiment; Right, the control experiment. The format is the same as panel B.
Figure 5
Figure 5. Neural correlates of the group members’ prior choice
(A) Main experiment: activity in the right pSTS/TPJ at the time of decision significantly correlated with the percentage of group-members who had previously selected the item that was chosen by the participant on the current trial. The map is thresholded at p < 0.005 uncorrected for display purpose. (B) Control experiment: no activity in the right pSTS/TPJ significantly correlated. (C) Main vs. control experiments: activity in the right pSTS/TPJ significantly better correlated in the main experiment. (D) Effect sizes of the group members’ prior choice in the independently identified right pSTS/TPJ ROI for the main and the control experiment (mean ± SEM across participants; n = 20). *p < 0.05, **p < 0.01, and n.s., non-significant as p > 0.05. pSTS, posterior superior temporal sulcus; TPJ, temporoparietal junction.
Figure 6
Figure 6. Neural correlates of the estimated-stickiness
(A) Main experiment: activity in the bilateral IPS significantly correlated with the estimated stickiness of the chosen item at the time of decision. The map is thresholded at p < 0.005 uncorrected for display purpose. (B) Control experiment: activity in the right IPS significantly correlated with the estimated-stickiness of the chosen item. (C) Effect sizes of the stickiness in the independently identified IPS ROIs for the main and the control experiment. R. IPS, right intraparietal sulcus; L. IPS, left intraparietal sulcus. The format is the same for Figure 5D.
Figure 7
Figure 7. Neural correlates of the integrated signal in the main experiment
(A) Activity in the dACC and the rACC at the time of decision significantly correlated with the choice probability assigned by the computational model to the participant's choice. The map is thresholded at p < 0.005 uncorrected for display purpose. dACC, dorsal anterior cingulated cortex; and rACC, rostral ACC. (B) Functional connectivity between the dACC and the other regions at the time of decision. Effect sizes of the PPI regressors in the dACC ROI are plotted (mean ± SEM across participants; n = 20). **p < 0.01, and *p < 0.05. vmPFC, ventromedial prefrontal cortex; pSTS/TPJ, right posterior superior temporal sulcus and temporoparietal junction; IPS, bilateral intraparietal sulcus. PPI, psychophysiological interaction. (C) Functional connectivity between the rACC and the other regions at the time of decision. The format is the same for panel B. n.s., non-significant as p > 0.05.

References

    1. Arrow KJ. Social Choice and Individual Values. John Wiley & Sons, Inc.; New York: 1963.
    1. Bahrami B, Olsen K, Latham PE, Roepstorff A, Rees G, Frith CD. Optimally Interacting Minds. Science. 2010;329:1081–1085. - PMC - PubMed
    1. Barron HC, Dolan RJ, Behrens TEJ. Online evaluation of novel choices by simultaneous representation of multiple memories. Nat Neurosci. 2013;16:1492–1498. - PMC - PubMed
    1. Becker GM, Degroot MH, Marschak J. Measuring utility by a single-response sequential method. Syst. Res. 1964;9:226–232. - PubMed
    1. Beckmann M, Johansen-Berg H, Rushworth MFS. Connectivity-based parcellation of human cingulate cortex and its relation to functional specialization. Journal of Neuroscience. 2009;29:1175–1190. - PMC - PubMed

Publication types