. 2015 Apr 9:6:6683.
doi: 10.1038/ncomms7683.

Decoding the regulatory landscape of melanoma reveals TEADS as regulators of the invasive cell state

Affiliations

Decoding the regulatory landscape of melanoma reveals TEADS as regulators of the invasive cell state

Annelien Verfaillie et al. Nat Commun. .

Abstract

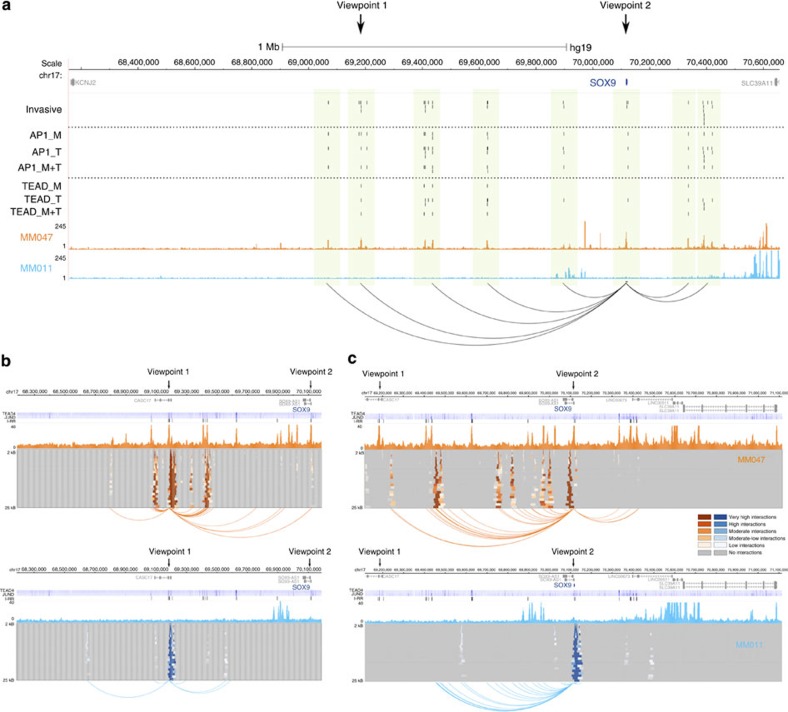
Transcriptional reprogramming of proliferative melanoma cells into a phenotypically distinct invasive cell subpopulation is a critical event at the origin of metastatic spreading. Here we generate transcriptome, open chromatin and histone modification maps of melanoma cultures; and integrate this data with existing transcriptome and DNA methylation profiles from tumour biopsies to gain insight into the mechanisms underlying this key reprogramming event. This shows thousands of genomic regulatory regions underlying the proliferative and invasive states, identifying SOX10/MITF and AP-1/TEAD as regulators, respectively. Knockdown of TEADs shows a previously unrecognized role in the invasive gene network and establishes a causative link between these transcription factors, cell invasion and sensitivity to MAPK inhibitors. Using regulatory landscapes and in silico analysis, we show that transcriptional reprogramming underlies the distinct cellular states present in melanoma. Furthermore, it reveals an essential role for the TEADs, linking it to clinically relevant mechanisms such as invasion and resistance.


Figures

Figure 1
Figure 1. Proliferative and invasive cellular states in melanoma biopsies and cultures.
(a) Non-negative matrix factorization on TCGA-SKCM RNA-seq data results in three sample clusters. (b) Functional characteristics of two states revealed by GSEA on the invasive and the proliferative meta-rankings integrated across SKCM RNA-seq and two microarray compendia, using various sources of functional data (L) Literature; (R) Reactome; (KEGG) KEGG pathways; (GO) Gene Ontology; (T) TargetScan. (c) Expression heatmap for TCGA samples showing a core subset of invasive and proliferative gene signatures (the GSEA overlap between the Hoek signatures and our ranking). The samples are ranked according to MITF expression, and the expression levels of both MITF and ZEB1 are indicated on top of the heatmap. Below the heatmap are mosaic plots of several samples. Each mosaic shows the expression of all variable genes in a 25 × 26 grid, whereby each field contains one or more genes. Genes and clusters with similar expression profiles across the cohort are placed close to each other in the grid. The mosaics show a high similarity among the invasive samples, and a strong difference between invasive and proliferative samples. SKCM is RNA-seq data from TCGA; Hoek et al., is microarray data from melanoma cultures; Compendium A and B are melanoma microarray data from GEO (see Supplementary Table 1 for accession numbers used).
Figure 2
Figure 2. Transcriptome and epigenome profiling in 11 melanoma cell cultures.
RNA-seq, FAIRE-seq and ChIP-seq against H3K27Ac and H3K27me3 across 10 short-passage melanoma cultures and one melanoma cell line SK-MEL-5. The SOX10 gene shows high expression and its upstream regions contain high H3K27ac and FAIRE but low H3K27me3 signal in the nine proliferative (blue) samples. In the two invasive (orange) samples, there is no SOX10 expression, no H3K27Ac and FAIRE peaks but high H3K27me3 peaks. Upper panel shows one invasive sample (MM047) and one proliferative sample (MM011). Lower panels showing zoom in around the promoter region of SOX10 with tracks for all 11 samples for each of the four data types. Vertical axes represent normalized coverage for each data track. Arrows indicate regions of interest that are different between proliferative and invasive states. Other genes are illustrated in Supplementary Figs 4 and 5 and in the UCSC Genome Browser using our Melanoma Track Hub (see Methods).
Figure 3
Figure 3. Global changes in the chromatin landscape between proliferative and invasive states.
(a) Multidimensional scaling using RNA-seq, H3K27ac and FAIRE-seq data reveals a clear separation of the invasive samples, MM047 and MM099, from the samples in the proliferative state. (b) Mosaic plots obtained by clustering 55,919 regulatory regions show very similar chromatin profiles for MM047 and MM099, while the proliferative samples are characterized by higher heterogeneity. (c) Gene expression changes between invasive and proliferative samples correlate with changes in H3K27ac (for each gene from our signatures, the H3K27Ac differential peak called by MACS2 with the largest fold change in 20 kb around the TSS is selected). Spearman's rank correlation of coefficient is shown. (d) Inverse correlation between H3K27me3 peaks and gene expression changes. (e) Aggregation plots of the read coverage (y axis) indicate that the TSS (x axis) of genes that are expressed higher in invasive samples (643 genes, left column) show higher FAIRE and H3K27ac signal but lower H3K27me3 signal in the same invasive (orange) samples than in the proliferative samples. Vice versa, the TSS of genes that are more expressed in the proliferative samples (772 genes, right column) show higher activating signals in the proliferative samples, and higher repressive signal in the two invasive samples. (f) Concordance between chromatin landscape in vitro and in vivo, where in vivo hypermethylated regions in the invasive samples from TCGA data show high activity (H3K27ac) in proliferative in vitro cultures (nine blue curves), but no activity in the invasive cultures (two orange curves).
Figure 4
Figure 4. Enhancer signatures are enriched for transcription factor motifs and ChIP-seq tracks.
(a) The proliferative enhancer signature (6,669 regions) is most strongly enriched for SOX10 motifs (a SOX dimer motif is most significant), and E-box motifs (the second best scoring motif cluster, where the most significant E-box motif is ranked ninth after eight SOX10-like motifs). (b) The E-box-predicted enhancers are correlated with publicly available MITF ChIP-seq data (against HA-tagged MITF) in a proliferative melanoma culture. (c) The same public ChIP-seq data (MITF_HA) and in-house ChIP-seq data against endogenous MITF in two proliferative cultures (MM011 and MM031) confirm that SOX10 is a MITF target gene through the predicted upstream enhancer (arrowhead). MITF predicted binding sites (MITF_M) inside H3K27Ac peaks (blue peaks in proliferative samples) ∼30 kb upstream of SOX10 MITF overlap with MITF_HA and MITF ChIP-seq peaks. (d) The invasive enhancer signature (13,453 regions) is most strongly enriched for AP-1 motifs (best scoring motif cluster) and TEAD motifs (the second best scoring motif cluster; Supplementary Fig. 15). (e) The predicted AP-1 enhancers are tested against all ENCODE ChIP-seq data and are correlated most strongly with ChIP-seq peaks of the AP-1 complex members such as FOSL2 and JUND, derived from a neuroblastoma cell line (SK-N-SH; ranked first out of 1,121 tested ChIP-seq data sets). (f) Likewise, TEAD-predicted target enhancers are most strongly correlated with TEAD4 ChIP-seq in a neuroblastoma (SK-N-SH) and lung cancer (A549) cell line.
Figure 5
Figure 5. Mapping gene regulatory networks from the enhancer signatures.
(a) Cartoon showing the assignment of regions to genes. Each enhancer from either the invasive or proliferative enhancer signature is associated (red arches) with zero, one or more candidate target genes using various parameter settings, allowing very distal interactions up to 10 kb, 100 kb, 1 Mb, or 2 Mb from the TSS, with or without filtering for target genes having corresponding gene expression data. (b) Predicted invasive (right) and proliferative (left) networks showing high overlap between AP-1 and TEAD targets in the invasive network, and high overlap between MITF and SOX10 targets in the proliferative network. Region-to-gene association parameters used for this network are (d=1 Mb; ge=0.1; corr=0.3; see Methods). (c) Network validation using GSEA showing that predicted target genes for SOX10, AP-1, TEAD and MITF are functional targets based on co-expression (GENIE3-based co-expression network on TCGA RNA-seq) and publicly available perturbation data for each factor (see Methods). All shown enrichments are significant with FDR<0.0001 (except results for MITF KD where the shown enrichments are significant with FDR=0.0004 and FDR=0.0038). Target genes predicted by distal assignments (red curves) have more accurate predictions than assignments based on the closest genes (grey curves). Optimal region-to-gene association parameters used for the gene sets represented by red curves are: SOX10 (d=100 kb and closest, ge=0.05, corr=0.1), MITF (d=2 Mb, ge=0.05, corr=0.3), AP-1 (d=20 kb, ge=1, corr=0.1), TEAD (d=100 kb and closest, ge=1, corr=0.1 and absolute value).
Figure 6
Figure 6. Long-range enhancer–promoter interactions at the SOX9 locus.
(a) View of a 2-Mb region around SOX9 showing eight clusters of predicted AP-1 and TEAD enhancers that are specifically active in the invasive state, as reflected by the H3K27ac peaks present for MM047 (orange) and absent in MM011 (blue). Different tracks show the motifs (AP1_M, TEAD_M) or ChIP-seq tracks (AP1_T, TEAD_T) detected for AP-1 and TEAD within these clusters. Arcs indicate correlations between the H3K27ac profile (vector of 11 peak values) of distal enhancers and the expression profile (vector of 11 expression values) of SOX9. Viewpoints 1 and 2 indicate the selected anchor points for 4C interaction analysis. (b) 4C-seq performed in an invasive (MM047) and a proliferative culture (MM011) showing chromatin interactions with viewpoint 1, a region 1 Mb upstream of SOX9 TSS. This enhancer interacts with other distal enhancers and with the SOX9 promoter, only in the invasive sample. I-RR represents invasive regulatory regions, while TEAD4 and JUND represent tracks from publicly available ENCODE ChIP-seq data on the SKSH cell line. The domainograms show the identified interactions after a window-based analysis (from 2 to 25 kb). Colour gradients represent the interaction signal strength, x axis represents the analysis window sizes and the arcs below represent significant interactions at P-value<0.05 threshold. (c) 4C-seq performed in an invasive (MM047) and a proliferative culture (MM011) showing chromatin interactions with viewpoint 2, the promoter of SOX9. The SOX9 promoter interacts mostly with upstream enhancers.
Figure 7
Figure 7. TEAD as a master regulator for the invasive phenotype.
(a) Simultaneous knockdown of all four TEADs causes downregulation of SOX9, SERPINE1 and EPHA2 expression in the invasive cultures as measured using qPCR. Measurements were normalized against the non-target control within each culture and are averaged across at least three biological replicates. Error bars represent s.e.m., (asterisk=P-value<0.05). P-values were determined using Student's t-test. Dark orange bars=72 h after transfection; lighter orange bars=96 h after Transfection. (b) Selection of genes highly expressed in the invasive state and downregulated on TEAD knockdown categorized into several functional groups relevant to the invasive phenotype (see Supplementary Data 3 for the entire list of annotated TEAD targets). In addition, expression information of TCGA and CCLE data for each gene is provided. (c) Significant overlap of genes predicted as TEAD targets (grey) with genes assigned to the invasive signature (yellow; hypergeometric P-value=5.83E−11) or with genes downregulated on TEAD knockdown (pink; hypergeometric P-value=1.37E−23). (d) GSEA with genes ranked according to their differential expression on TEAD knockdown show a strong enrichment of predicted TEAD targets among the downregulated genes. (e) Images showing the reduced invasive capacity of MM029, MM047 and MM099 on knockdown of the TEADs (all images were made at magnification × 20, scale bar, 0.2 mm). (f) Knockdown of all four TEADs using a siRNA pool leads to a significant (P-value<0.05) reduction of the invasive capacity compared with a non-target control siRNA for all three invasive cultures. Results are averaged across at least three biological replicates. (g) Cell viability on knockdown of all four TEADs decreases significantly. P-values were determined using Student's t-test and the error bars represent s.e.m.
Figure 8
Figure 8. The role of the TEADs in drug resistance of the invasive melanoma state.
(a) Analysis of CCLE data (n=39) shows a significant difference of IC50 values for both the BRAF and MEK inhibitors (PXL4032 and AZD6244), where cell lines with a high TEAD signature (top 25%) are more resistant compared with the other cell lines. (b) IC50 curves showing a strong resistance of invasive cultures (MM029, MM047 and MM099, orange shades) for both BRAF and MEK inhibitors (PLX4032 and Pimasertib) compared with two proliferative cultures (MM074 and MM034, blue shades) both at 48 and 72 h of exposure. MM047 data were not incorporated in BRAF-related plots since this culture does not harbour the V600E BRAF mutation. (c) IC50 shifts indicating a sensitization of the invasive lines for the MEK inhibitor measured at 48 and 72 h of treatment when treated with siRNAs against all four TEADs. All error bars represent s.e.m. and are the result of at least three biological replicates. P-values were determined using Student's t-test.

References

    1. Sun C. et al. Reversible and adaptive resistance to BRAF(V600E) inhibition in melanoma. Nature 508, 118–122 (2014) . - PubMed
    1. Roesch A. Tumor heterogeneity and plasticity as elusive drivers for resistance to MAPK pathway inhibition in melanoma. Oncogene (2014) doi:10.1038/onc.2014.249. - DOI - PubMed
    1. Widmer D. S. et al. Systematic classification of melanoma cells by phenotype-specific gene expression mapping. Pigment Cell Melanoma Res. 25, 343–353 (2012) . - PubMed
    1. Hoek K. S. et al. In vivo switching of human melanoma cells between proliferative and invasive states. Cancer Res. 68, 650–656 (2008) . - PubMed
    1. Caramel J. et al. A switch in the expression of embryonic EMT-inducers drives the development of malignant melanoma. Cancer Cell 24, 466–480 (2013) . - PubMed

Publication types

MeSH terms