Review
. 2015 Jun;41(6):1487-504.
doi: 10.1002/jmri.24767. Epub 2015 Apr 10.

Techniques and applications of in vivo diffusion imaging of articular cartilage

Affiliations
Review

Techniques and applications of in vivo diffusion imaging of articular cartilage

José G Raya. J Magn Reson Imaging. 2015 Jun.

Abstract

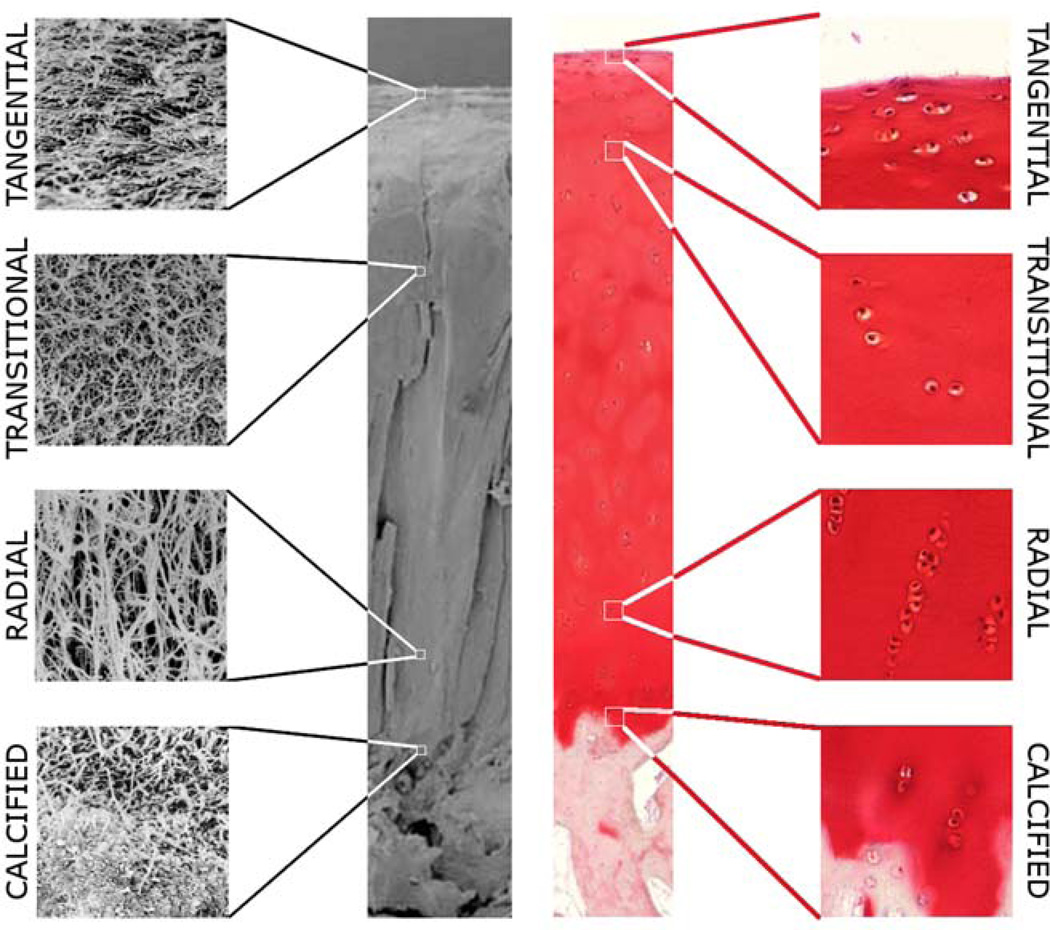
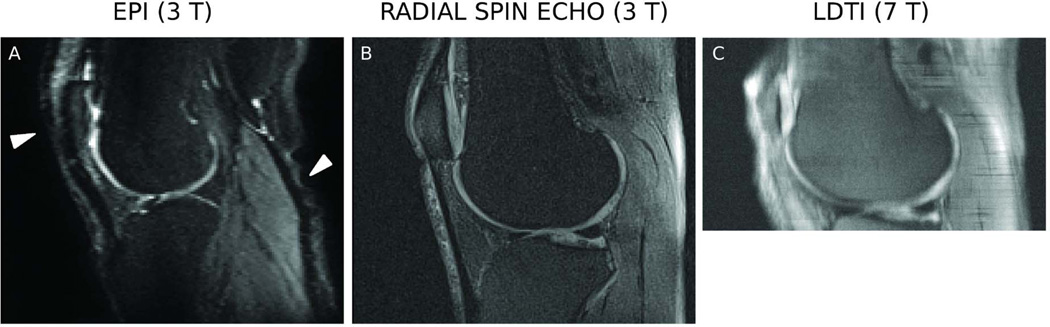
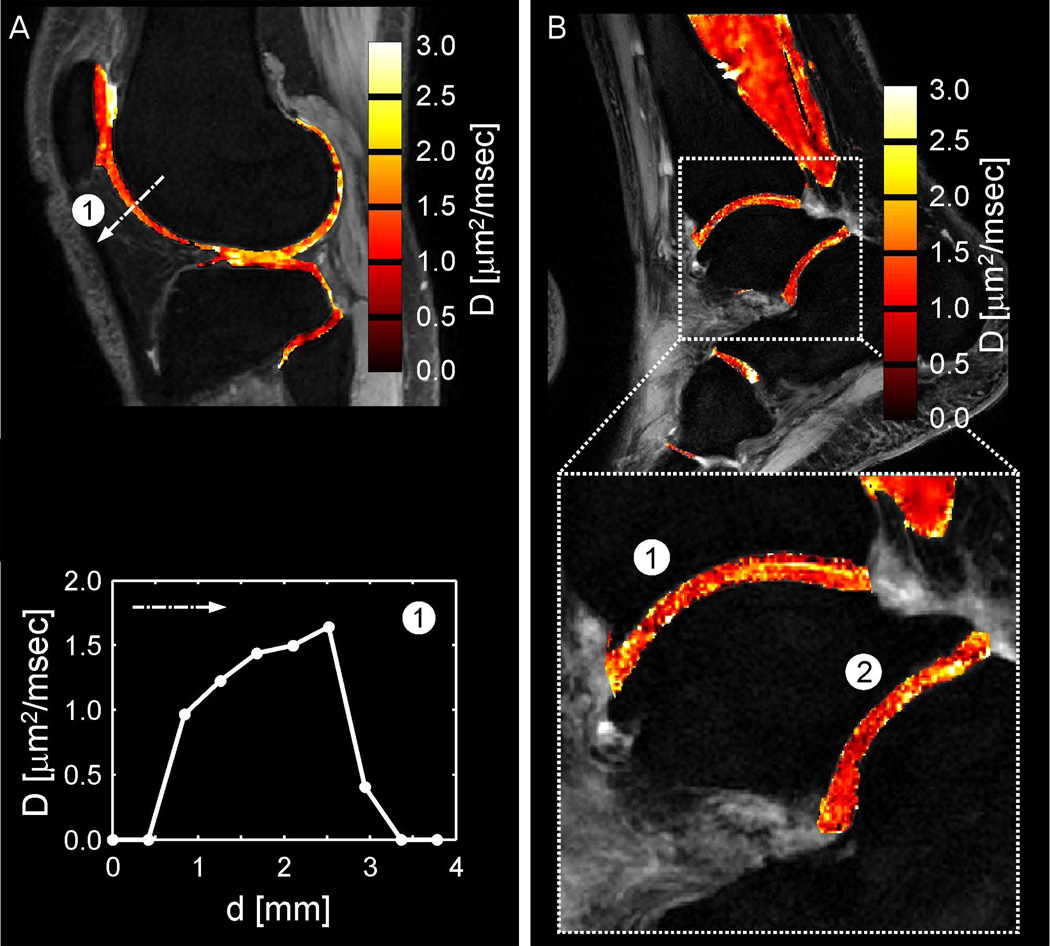
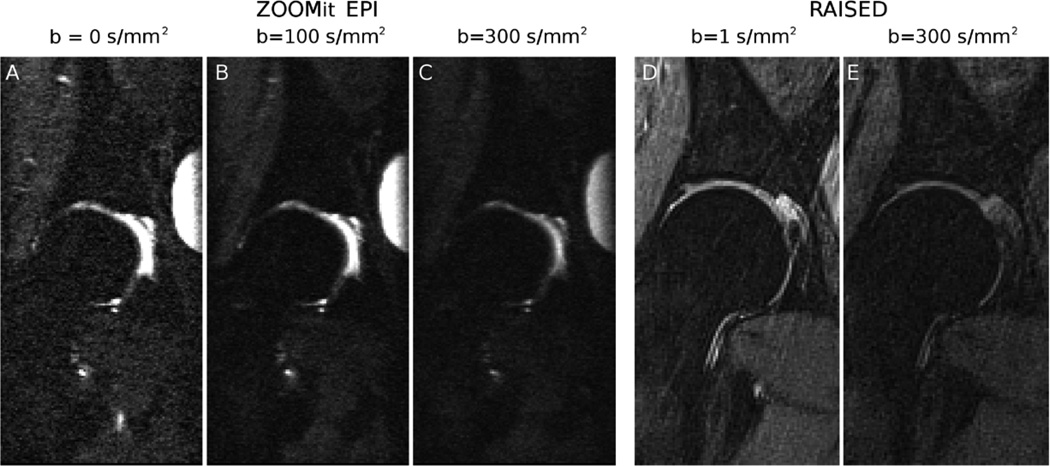
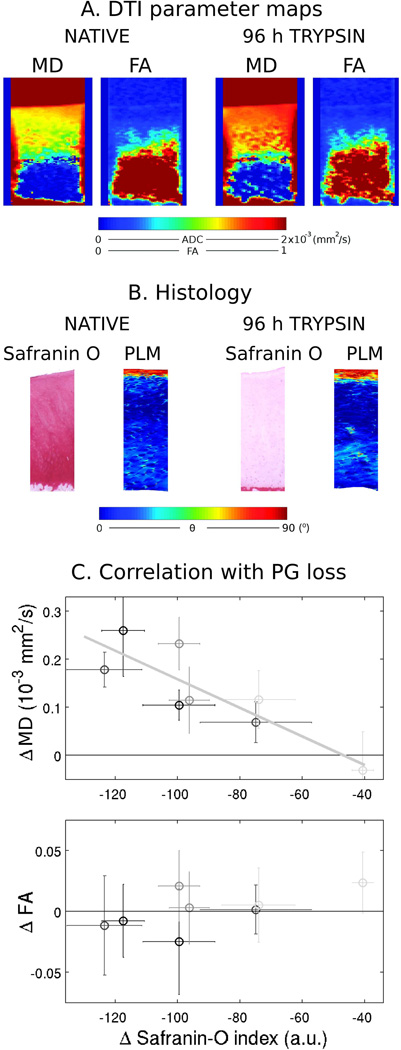
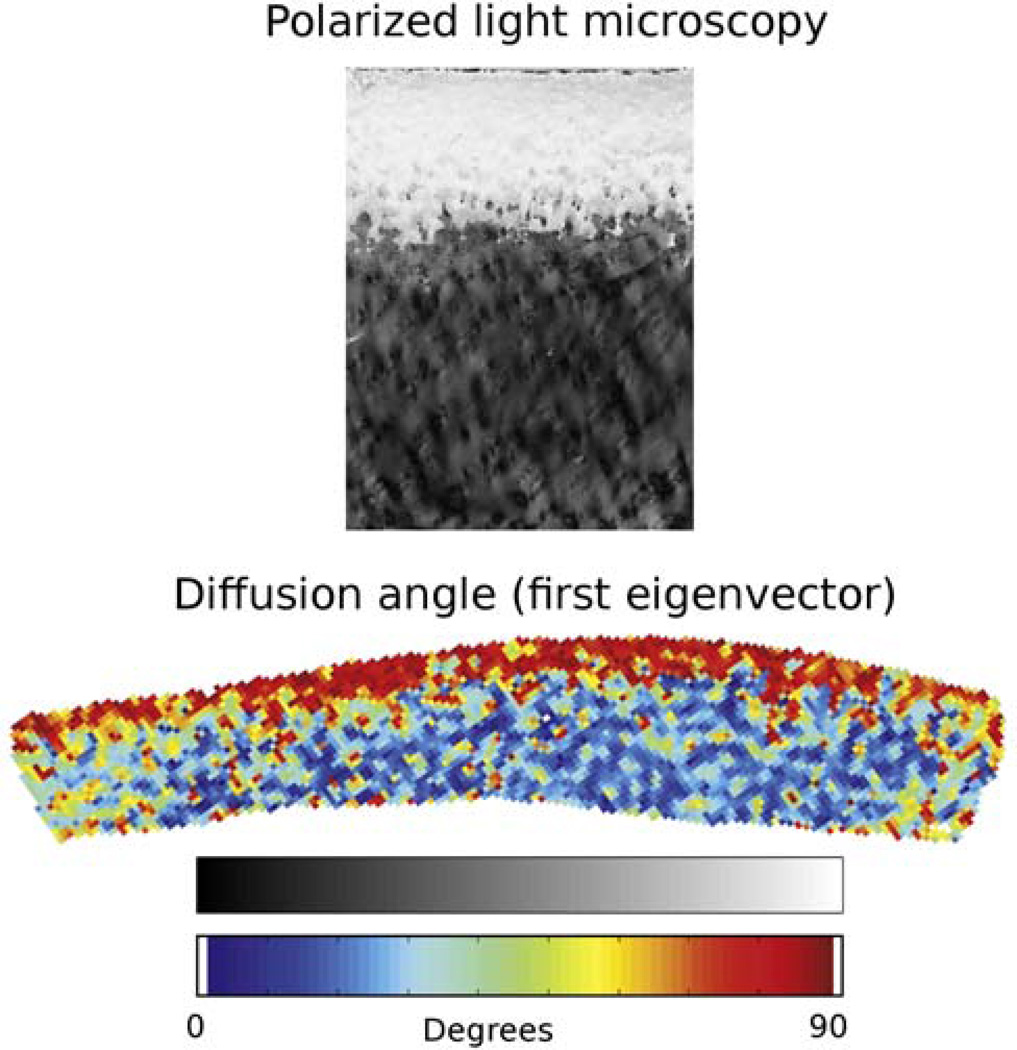
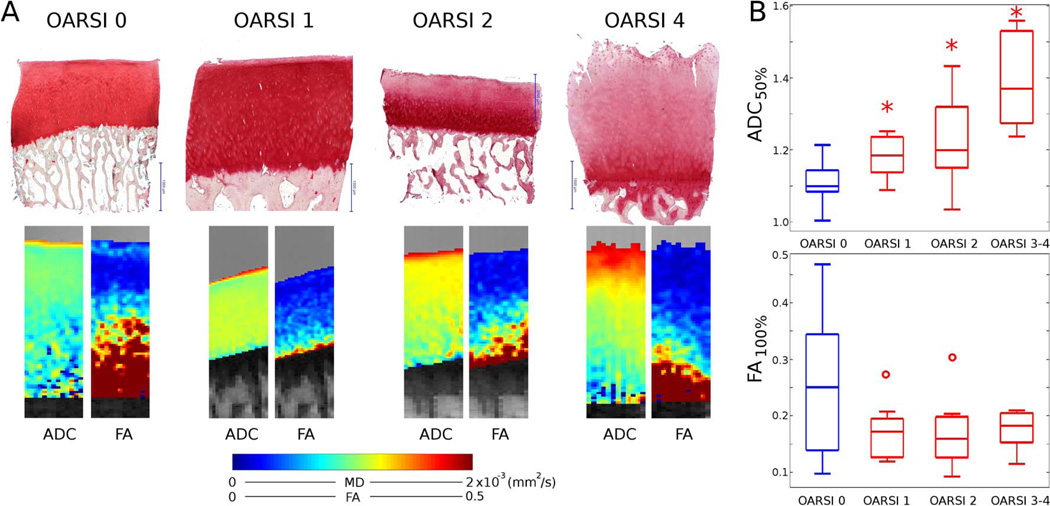
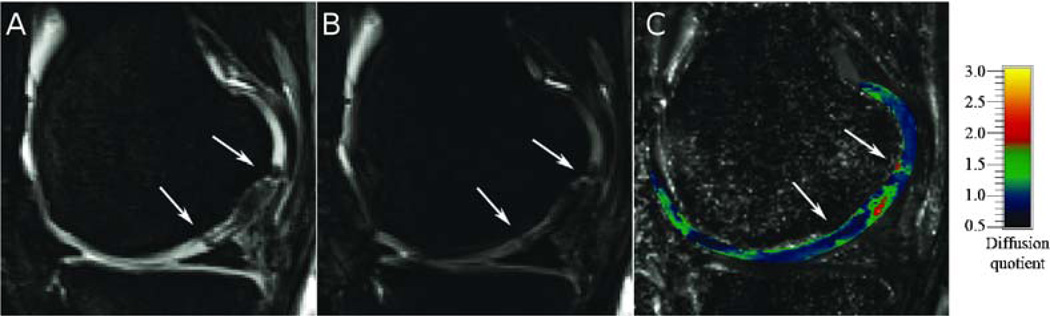
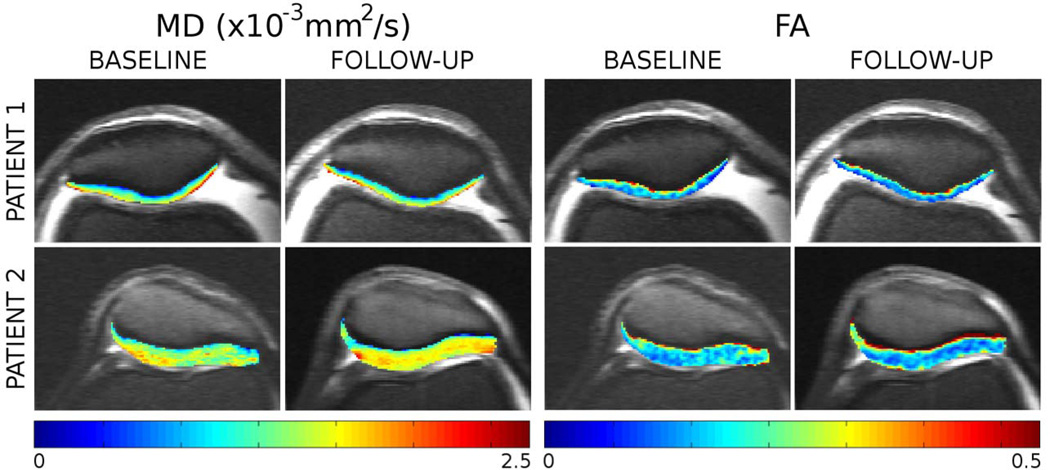
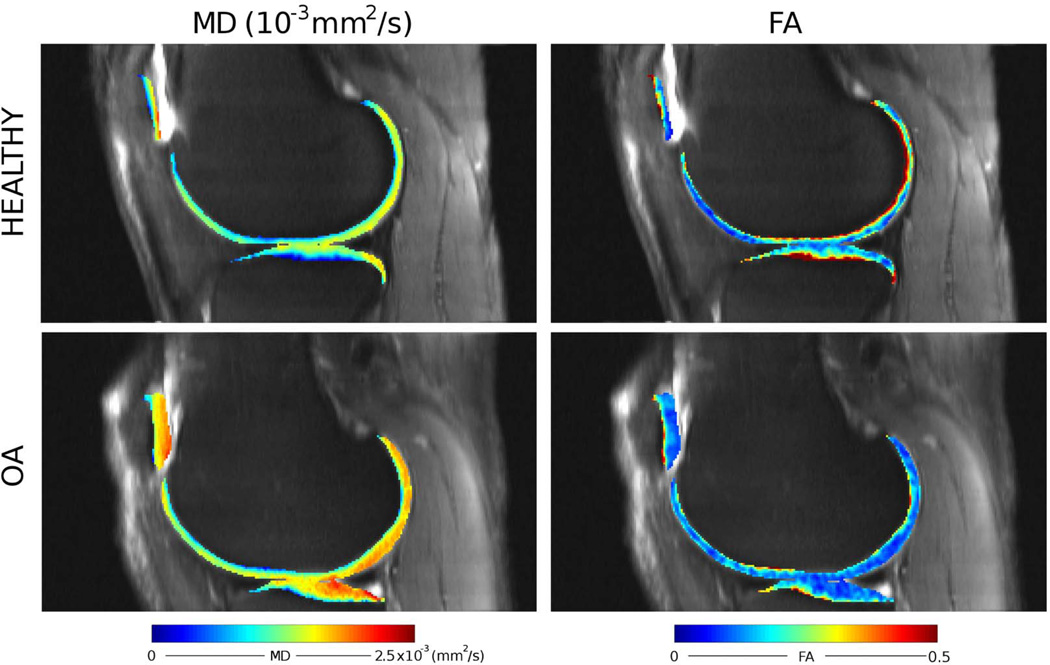
Early in the process of osteoarthritis (OA) the composition (water, proteoglycan [PG], and collagen) and structure of articular cartilage is altered leading to changes in its mechanical properties. A technique that can assess the composition and structure of the cartilage in vivo can provide insight in the mechanical integrity of articular cartilage and become a powerful tool for the early diagnosis of OA. Diffusion tensor imaging (DTI) has been proposed as a biomarker for cartilage composition and structure. DTI is sensitive to the PG content through the mean diffusivity and to the collagen architecture through the fractional anisotropy. However, the acquisition of DTI of articular cartilage in vivo is challenging due to the short T2 of articular cartilage (∼40 ms at 3 Tesla) and the high resolution needed (0.5-0.7 mm in plane) to depict the cartilage anatomy. We describe the pulse sequences used for in vivo DTI of articular cartilage and discus general strategies for protocol optimization. We provide a comprehensive review of measurements of DTI of articular cartilage from ex vivo validation experiments to its recent clinical applications.

Keywords: articular cartilage; diffusion tensor imaging; diffusion-weighted imaging; knee injury; osteoarthritis.


Figures

Figure 1
Figure 1
Example of cartilage composition and structure in intact cartilage. Left side: Scanning electron microscopy (full view) and 6000× magnification fields of the collagen network showing the arrangement of collagen fibrils. The tangential zone shows thin collagen fibrils arranged parallel to the articular surface. The transitional zone presents random arrangement of slightly thicker collagen fibrils, while the radial zone contains thick collagen fibrils running perpendicular to the bone cartilage interface. The calcified zone shows the transition between the radial zone and the subchondral bone. Right side: Safranin-O stained of histology slide and 100× magnification showing chondrocytes. The intensity of the stain is estequiometric with the concentration of glycosaminoglycans in the cartilage matrix. Observe the increase in staining intensity from the articular surface to the calcified zone. The distribution of glycosaminoglycans provides an optimal gradient of osmotic pressure in the cartilage. The tangential zone is characterized by isolated ellipsoidal chondrocytes. In the transitional zone chondrocytes are still isolated but present a spherical shape. Chondrocytes in the radial zone piled up in columns.
Figure 2
Figure 2
Diffusion-weighted images acquired on a 39-years old asymptomatic male subject with different diffusion sequences. Clincal MRI of this subject (Sagittal and coronal PD and T1-weighted, not shown here) showed no signs of cartilage abnormality. A. Diffusion-weighted (b=400 s/mm2) images acquired with a DW-EPI sequence on a 3 T scanner (TE/TR = 56/5500 ms, slice thickness = 3 mm, 21 slices, field of view [FOV] = 176×176 mm2, in-plane resolution = 1.19×1.19 mm2, 6 averages, bandwidth = 1024 Hz/pixel, b-value = 0,400 s/mm2, phase samples = 123, parallel imagine acceleration factor (iPat) = 3, 36 reference lines, acquisition time = 2:34 min). Arrows in the EPI images indicate areas of geometric distortion. B. Diffusion-weighted images (b=350 s/mm2) acquired with a RAISED sequence on a 3 T scanner (TE/TR = 38/1500 ms, slice thickness = 3 mm, 21 slices, FOV = 154×154 mm2, in-plane resolution = 0.75×0.75 mm2, b-value = 0,350 s/mm2, bandwidth = 290 Hz/pixel, spokes = 114 [2.89 acceleration with respect to the Niquist condition], acquisition time = 2:50 min per b-value). C. Diffusion-weighted images acquired on a 7 T whole body scanner using a LSDTI sequence (TE/TR = 46/180 ms, slice thickness = 3 mm, 15 slices, FOV = 154×154 mm2, in-plane resolution = 0.6×0.6 mm2, b-value = 450 s/mm2, bandwidth = 500 Hz/pixel, rotation angle = 20°, acquisition time = 2:48 min per slice and 7 diffusion weightings).
Figure 3
Figure 3
A (left panel). Fusion of the derived diffusion map onto a conventional DESS image of normal appearing cartilage in the knee joint at 3.0T (derived from the nondiffusion-weighted DESS scan) and analysis of regional variations in the apparent molecular diffusion coefficient between deep and superficial femoral cartilage (along the dash-dotted line labeled with 1). B (right panel). Fusion of the derived diffusion map onto a conventional DESS image of normal appearing cartilage in the ankle joint at 3.0 T (derived from the nondiffusion-weighted DESS scan). For cartilage, D = 1.27±0.53 µm2/ms (tibiotalar joint, region 1) and D = 1.15±0.41 µm2/ms (talocalcaneal joint, region 2) is found. [Adapted from Figs. 7 and 8 of Bieri et al.(89)]
Figure 4
Figure 4
Example of diffusion-weighted images of the femoral head on a 34-years old female asymptomatic subject. A–C. Imaging sequences include a DW-EPI acquired with the parallel transmit technology to selective excite a small region around the femur head (syngo ZOOMit; Siemens Healthcare, Erlangen, Germany). Parameter acquisition for the EPI were TE/TR = 71/6600 ms, slice thickness = 3.3 mm, echo-train length = 63, 13 slices, matrix size = 192×96 mm2, in-plane resolution = 0.80×0.80 mm2, bandwidth = 1024 Hz/pixel, b-value = 0,100,300 s/mm2 with averages of 1, 3, 5, partial Fourier = 5/8, acquisition time = 5:35 min. D–E. Diffusion-weighted images acquired on the same volunteer with a RAISED sequence (TE/TR = 38/1500 ms, slice thickness = 3 mm, 13 slices, FOV = 154×154 mm2, in-plane resolution = 0.80×0.80 mm2, b-value = 0,350 s/mm2, bandwidth = 290 Hz/pixel, spokes = 114 [2.64 acceleration with respect to the Niquist condition], acquisition time = 2:50 min per b-value).
Figure 5
Figure 5
Change of diffusion parameters with progressive PG depletion. A. Diffusion parameter maps (MD and FA) of a sample before and after a 96 h treatment with a low dose (0.1 mg/ml) of trypsin for 96 hours. PG depletion resulted in increased MD but no change of FA. B. Histology analysis of the same sample before and after treatment with trypsin. Histology included safranin-O sensitive to the PG content and polarized light microscopy (PLM) for analysis of the collagen structure. Treatment with trypsin led to decrease in the intensity of the safranin-O staining, but no change in the collagen architecture. C. Correlation between the change in MD (r2 = −0.86, P<0.007) and FA (no significant) with the loss in PG content measured on safranin-O histology slides. Error bars represent the 2σ intervals of the difference to baseline. Light to dark gray encodes increasing trypsin incubation times (6, 48, 72 and 96 h). [Adapted from data of Raya et al. (24)].
Figure 6
Figure 6
Correlation of DTI measurement with the polarized light microscopy (PLM) in a sample of bovine articular cartilage (sample B of reference (112)). Top. Map of PLM polarization angle α (the angle between the “fast” optical axis and the normal to AS). White corresponds to α = 90°; black, to α = 0°. Bottom. Map of the diffusion angle θ (the angle between the principal diffusion eigenvector and the normal to AS) for the same sample. The signal intensity scale is shown down, with white corresponding to θ = 0° and black to θ = 90°. The signal from the surrounding water and bone has been removed by thresholding. [Adapted from Figs. 2 and 3 of de Visser et al. (23)]
Figure 7
Figure 7
Example of diffusion parameters of samples with different degrees of cartilage damage. A. Histology with safranin-O and diffusion maps (MD and FA) of samples with different grades of cartilage damage as shown by the OARSI scores. Maps show a clear trend of increased MD with increasing OARSI score and a less pronounced decrease in the FA. B. Box plot of the averaged MD over the 50% most superficial cartilage and averaged FA over the whole cartilage depth. Blue indicates average over intact cartilage (n=14 OARSI 0) and red average over cartilage with sign of degradation (OARSI 1 n = 11; OARSI 2 n = 12; OARSI ≥ 3 n = 6). Stars represent statistical significance with respect to the OARSI 0 group. Circles indicate outliers.
Figure 8
Figure 8
This three images show direct comparison of not diffusion-weighted image (A) with diffusion-weighted (B) image and corresponding diffusion-quotient map (C). Intensity of grayscaled part of left and central images was modified for better representation. Intensity of pseudo-colored cartilage part of images was not modified and can be evaluated using colorbar. [Adapted from Mamish et al.(116)]
Figure 9
Figure 9
Example of changes in DTI measurements on two OA patients. Patient 1 (KL 1, 61 y, 14 mo follow up) showed little change in DTI (MD +3.5%, FA-10.8%). Patient 2 (KL 2, 64 y, 20 mo follow up), who showed larger MD in the baseline also showed the largest changes in MD (+17.3%, twice the reproducibility error, +8.1%), and moderate change in FA (−17.1%, slightly under twice the reproducibility in FA, 9.7%).
Figure 10
Figure 10
Example of the MD and FA maps acquired on a healthy volunteer (29 year old male) and an OA subject (62 year old male subject with Kellgren Lawrence grade 2). The background image is the SNR map of the LSDTI image without diffusion weighting. MD showed higher values in the posterior condyle and in the posterior areas of the tibial cartilage as compared to the healthy volunteer. The OA subject also presented lower FA in these areas [Adapted from Raya et al. (27)].

Similar articles

Cited by

References

    1. Charnley J. The lubrication of animal joints in relation to surgical reconstruction by arthroplasty. Ann Rheum Dis. 1960;19:10–19. - PMC - PubMed
    1. Mox VC, Gu WY, Chen FH. Structure and function of articular cartilage. In: Mow VC, Huiskes R, editors. Basic Orthopedics biomechanics and mechano-biology. 3rd ed. Philadelphia, PA, US: Lippincott Willians & Wilkins; 2005. pp. 123–180.
    1. Venn M, Maroudas A. Chemical composition and swelling of normal and osteoarthrotic femoral head cartilage. I. Chemical composition. Ann Rheum Dis. 1977;36(2):121–129. - PMC - PubMed
    1. Maroudas AI. Balance between swelling pressure and collagen tension in normal and degenerate cartilage. Nature. 1976;260(5554):808–809. - PubMed
    1. Maroudas A, Baylissb MT, Uchitel-Kaushanskya N, Schneidermana R, Gilav E. Aggrecan turnover in human articular cartilage: Use of aspartic acid racemization as a marker of molecular age. Arch Biochem Biophys. 1998;350:61–71. - PubMed

Publication types

MeSH terms