. 2015 Apr 13:6:6727.
doi: 10.1038/ncomms7727.

Plasticity of Hopx(+) type I alveolar cells to regenerate type II cells in the lung

Affiliations

Plasticity of Hopx(+) type I alveolar cells to regenerate type II cells in the lung

Rajan Jain et al. Nat Commun. .

Abstract

The plasticity of differentiated cells in adult tissues undergoing repair is an area of intense research. Pulmonary alveolar type II cells produce surfactant and function as progenitors in the adult, demonstrating both self-renewal and differentiation into gas exchanging type I cells. In vivo, type I cells are thought to be terminally differentiated and their ability to give rise to alternate lineages has not been reported. Here we show that Hopx becomes restricted to type I cells during development. However, unexpectedly, lineage-labelled Hopx(+) cells both proliferate and generate type II cells during adult alveolar regrowth following partial pneumonectomy. In clonal 3D culture, single Hopx(+) type I cells generate organoids composed of type I and type II cells, a process modulated by TGFβ signalling. These findings demonstrate unanticipated plasticity of type I cells and a bidirectional lineage relationship between distinct differentiated alveolar epithelial cell types in vivo and in single-cell culture.


Figures
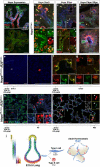
Figure 1
Figure 1. Hopx marks bipotent embryonic alveolar progenitors
a-d, Sections of E15.5 lungs showing Hopx expression (Hopx3XFlag/+ unless otherwise noted). a, Hopx is expressed in distal epithelial cells and the stalk of developing alveolar buds. The top panel is stained with a Hopx antibody. b, A subset of Hopx+ cells coexpress Sox9. (Insets show boxed area and arrowheads point to Hopx+ Sox9+ cells.) c, A subset of Hopx+ cells coexpress Sftpc (Insets show high magnification of boxed areas). d, Rare Hopx+ cells coexpress Pdpn and Sftpc (bottom panel is high magnification of boxed area in top panel with a triple positive cell outlined). e-i, HopxERCre/+; R26Tom/+ embryos were exposed to one dose of tamoxifen at E15.5 and sacrificed at indicated times. White arrowhead in (e) points to single RFP+ cell (magnified image to right). Red arrowhead in (g) points to lineage-labeled Type I cell body and nuclei. Green and blue arrowheads in (h) point to Sftpc+ RFP+ and Pdpn+ RFP+ cells, respectively. j, Schema of Hopx expression at E15.5 in the developing lung. Scale bars: 10 μm (Insets: b, c, h; f-g), 25 μm (i insets), and 50 μm (a-e, i).
Figure 2
Figure 2. Hopx is restricted to Type I cells in the adult alveolus
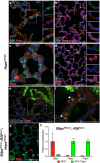
a-f, Hopx expression in the adult lung (Hopx3XFlag/+). Hopx is expressed in Pdpn+ cells (a, P133) and AGER+ cells (b, P38). Individual channels of boxed areas are shown as insets (a, b; merge is bottom inset in each panel). c-d, Hopx is excluded from Sftpc+ cells (c, P90 d, P38). Red arrowheads highlight Hopx+, Type I cell nuclei. (e-f) Sftpc+ Scgb1a1+ cells (arrowheads in f) do not express Hopx (boxed area in e magnified in f, P133). g, SftpcERCre/+; R26Tom/+; Hopx3XFlag/+, P167, were dosed with tamoxifen every fifth day for 15 days total (4 doses total) and sacrificed at P186. GFP expression is distinct from Tomato expression. h, As assayed by RT-PCR, Hopx and Pdpn are significantly enriched in the non-lineage labeled, FACS sorted Type I cell population compared to the lineage-labeled, Type II cell population. (Relative quantification (RQ) was normalized to 1 for Hopx and Pdpn in Type I cell population; RQ 0.046 and 0.029 for Hopx, Pdpn respectively in Type II cell population.) Sftpc expression is significantly lower in the Type I cell population. (RQ normalized to 1 for Sftpc in Type II cell population; RQ 0.11 for Sftpc in Type I cell population.) Error bars: ± 95% CI. Scale bars: 10 μm (insets a, b, d) and 50 μm (a-g).
Figure 3
Figure 3. Hopx+ cells give rise to Sftpc+ cells after pneumonectomy
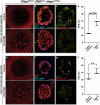
a, Schema of tamoxifen administration, pneumonectomy, and sacrifice of mice. b-f, HopxERCre/+; R26mT-mG/+ mice were treated with tamoxifen at P90 and pneumonectomy or sham was performed at P109. Mice were sacrificed 7 days (b-g, n=1 mouse for each pneumonectomy and sham). Whole mount immunofluorescence (b) and GFP expression in lungs pre- and post-pneumonectomy (c and d, respectively). e-i, Post-pneumonectomy, Hopx-derived Type I (red arrowhead) and Type II (white arrowhead) cells were identified. Individual channels and merged image of a pair of adjacent Hopx-derived Type II cells is shown in (e), including a 3D volume rendering of a Z-stack through them (e, right panel). (f,g) Two more examples of Hopx-derived Sftpc+ cells post-pneumonectomy. (h,i) HopxERCre/+; R26Tom/+ mice (n=3 each for sham and pneumonectomy) were pulsed with a single dose of tamoxifen (50 mg/kg) at P102, pneumonectomy was performed at P118-121 and mice were sacrificed 21 days later. Insets in g and i shows high magnification of cell highlighted by white arrowhead. Scale bars: 10 μm (e, i; g and i inset), 50 μm (c, d, f-h).
Figure 4
Figure 4. Sftpc+ cells give rise to type I cells after pneumonectomy
a-d, Sham (a) or day 21 post-pneumonectomy (b-d) images from SftpcERCre/+; R26Tom/+ (a) and SftpcERCre/+; R26Tom/+; Hopx3XFlag/+ mice (b-d). White arrowheads in (d) point to lineage labeled, GFP+ Type I cells. Green arrowheads in d point to non-lineage labeled Hopx+ cells. DC-LAMP is a glycoprotein found in lamellar bodies in mature Type II cells. n=3 mice for each sham and pneumonectomy experiments. Scale bars: 50 μm (a and b insets; d), 100 μm (c), 200 μm (a, b).
Figure 5
Figure 5. Isolated Hopx+, Type I cells give rise to Type II cells in organoid culture
a, b, Organoids grown from SftpcERCre/+; Hopx3XFlag/+; R26Tom/+ lineage-labeled Type II cells (b) were dissociated and sorted into Type I (Tom+ Pdpn+) and Type II (Tom+ Pdpn) cells. Arrowheads in (b, inset) point out RFP+ Hopx+ cell body. GFP only nuclei represent Pdgfrα+ cells. c-e, Type II-derived spheres. f-h, Type I-derived organoids were composed of Sftpc+ Type II cells and Hopx/GFP+ Type I cells. i-m, Organoids from Type I cells (EpCAM+ Tom+ Pdpn+) from HopxERCre/+; R26Tom/+ lineage labeled alveoli. Rare mosaic spheres containing Tom+ cells were observed on day 14. (k-m) Tom+ cells co-express Sftpc (k-l, arrowheads). and Pdpn (m). l, High magnification of boxed area in (k). n-q, Organoids were generated from Type I cells (Tom EpCAM+ Pdpn+ GFP+) from SftpcERCre/+; Hopx3XFlag/+; R26Tom/+ lineage labeled alveoli. (o) Most spheres (mean = 65/well) were Tom on day 14, and 12.9% of those were Hopx/GFP+. GFP spheres likely derived from epithelial cells contaminating the stromal population. (p-q) Type I cell-derived organoid composed of Sftpc+ Type II cells and Pdpn+ Hopx/GFP+ Type I cells. Note the cytoplasmic GFP expressed in Pdpn+ cells, demonstrating the organoid is not derived from the stromal population (Inset p). Scale bars: 10 μm (b inset; l), 50 μm (b, d, g, k, m, p, q), 100 μm (j), and 1000 μm (c, f, o).
Figure 6
Figure 6. Inhibition of TGFβ increases the rate of conversion of Type I to Type II cells in organoid culture
As in Fig. 4, organoids grown from SftpcERCre/+; Hopx3XFlag/+; R26Tom/+ lineage-labeled Type II cells were dissociated and separated into lineage-labeled Type I cells (Tom+Pdpn+GFP+) (a-d) and Type II cells (Tom+PdpnGFP) (e-h). a-d, Type I cell derived organoids were grown in the presence of vehicle or the TGFβ inhibitor LY2157299 (LY). (b,c) Day 16 vehicle-treated organoids contain both Type II cells (DC-LAMP+) and Type I cells (HopxGFP+). Many GFP+ Type I cells are also pSMAD2/3+, suggesting active TGFβ signaling (white arrowheads). LY-treated organoids also contain both Type II and Type I cells, but they have reduced pSmad 2/3. (d) Day 14 CFE of LY-treated Type I cells is significantly higher than vehicle control (n=3 replicates). e-h, Type II cell organoids grown in the presence of LY also contain Type II and Type I cells (f), although there is no difference in the Day 14 CFE between LY-treated organoids and control (h, n=3 replicates). Scale bars: 50 μm (b, c, f, g) and 1000 μm (a, e).
Figure 7
Figure 7. Hopx+ cells give rise to tumors in the lung
a-e, HopxERCre/+;K-RasG12D mice were pulsed with a single dose of tamoxifen between P90 and P100. (a, b) Within 28 days, peripheral tumors formed. (c, d) Longer chases revealed tumors with aggressive features including atypical cells and high mitotic index (d). (e) Hopx-derived tumor cells (GFP+) in HopxERCre/+; R26mT-mG/+; K-RasG12D express Sftpc. Individual channels of highlighted area are shown as insets. Arrowhead indicates a Hopx-derived cell that is also Sftpc+. The mouse was pulsed with tamoxifen at P100 and sacrificed 175 days later. Scale Bars: 10 μm (e inset), 50 μm (d, e), and 1000 μm.

References

    1. Evans MJ, Cabral LJ, Stephens RJ, Freeman G. Transformation of alveolar type 2 cells to type 1 cells following exposure to NO2. Exp Mol Pathol. 1975;22:142–150. - PubMed
    1. Kaplan HP, Robinson FR, Kapanci Y, Weibel ER. Pathogenesis and reversibility of the pulmonary lesions of oxygen toxicity in monkeys. I. Clinical and light microscopic studies. Lab Invest. 1969;20:94–100. - PubMed
    1. Barkauskas CE, et al. Type 2 alveolar cells are stem cells in adult lung. J Clin Invest. 2013;123:3025–3036. - PMC - PubMed
    1. Desai TJ, Brownfield DG, Krasnow MA. Alveolar progenitor and stem cells in lung development, renewal and cancer. Nature. 2014;507:190–194. - PMC - PubMed
    1. Blanpain C, Fuchs E. Stem cell plasticity. Plasticity of epithelial stem cells in tissue regeneration. Science. 2014;344:1242281. - PMC - PubMed

Publication types

MeSH terms