. 2015 Apr 23;161(3):569-580.
doi: 10.1016/j.cell.2015.03.041. Epub 2015 Apr 9.

Bending gradients: how the intestinal stem cell gets its home

Affiliations

Bending gradients: how the intestinal stem cell gets its home

Amy E Shyer et al. Cell. .

Abstract

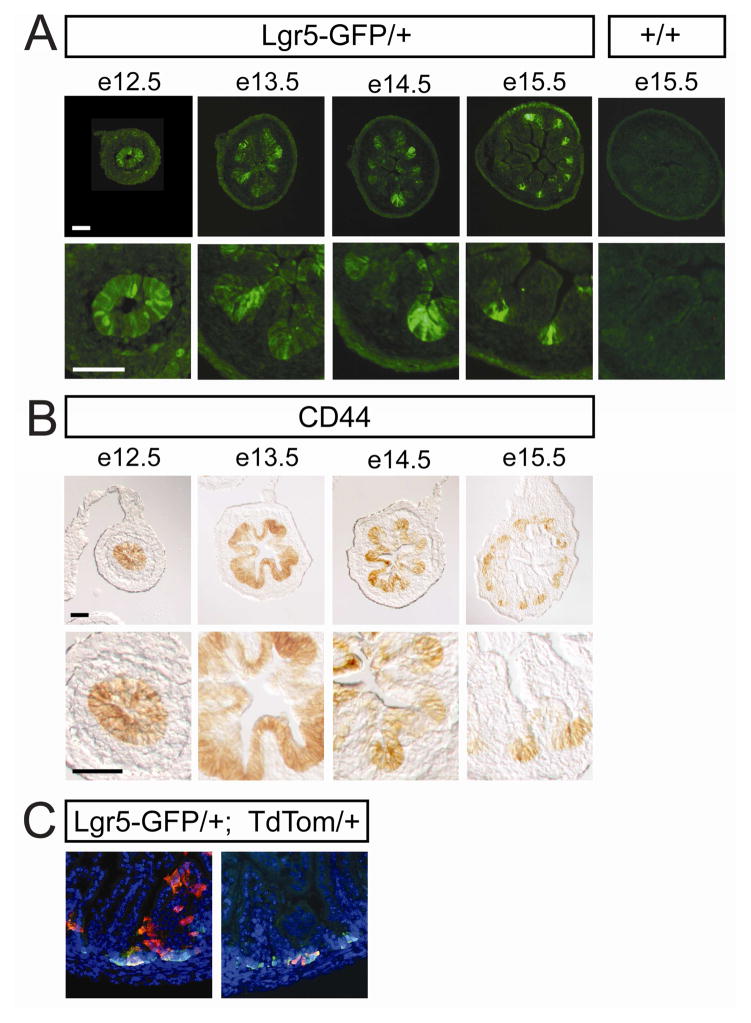
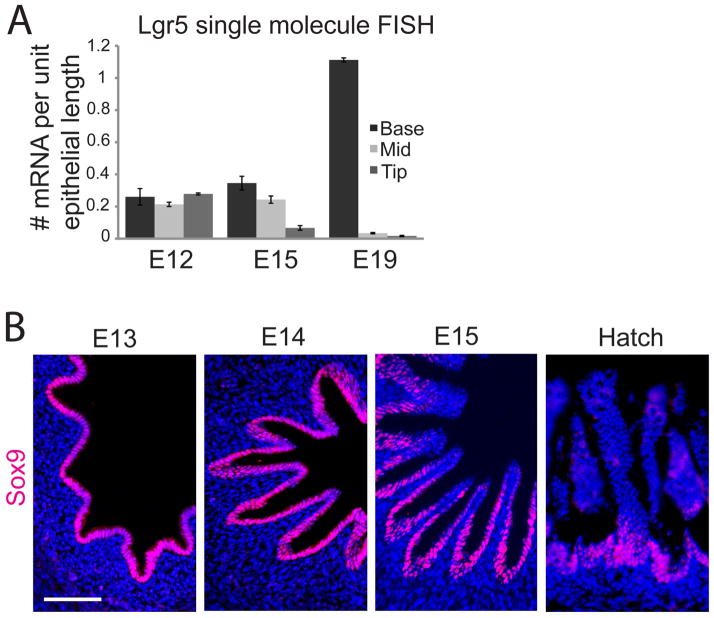
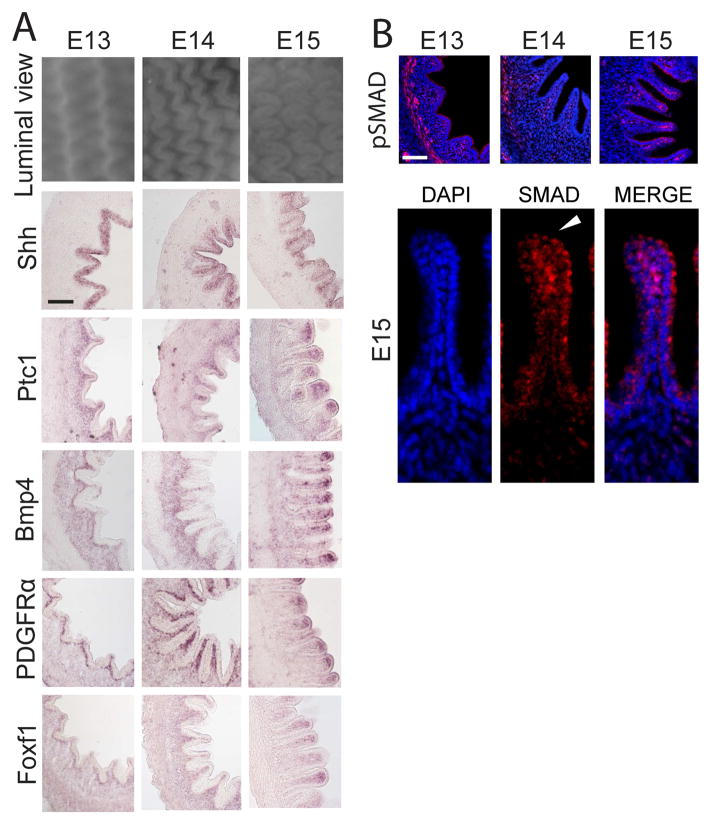
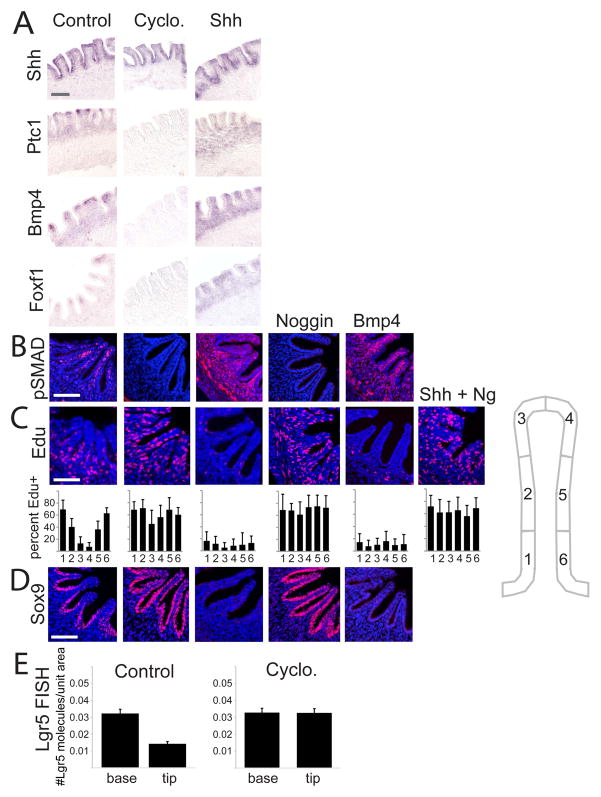
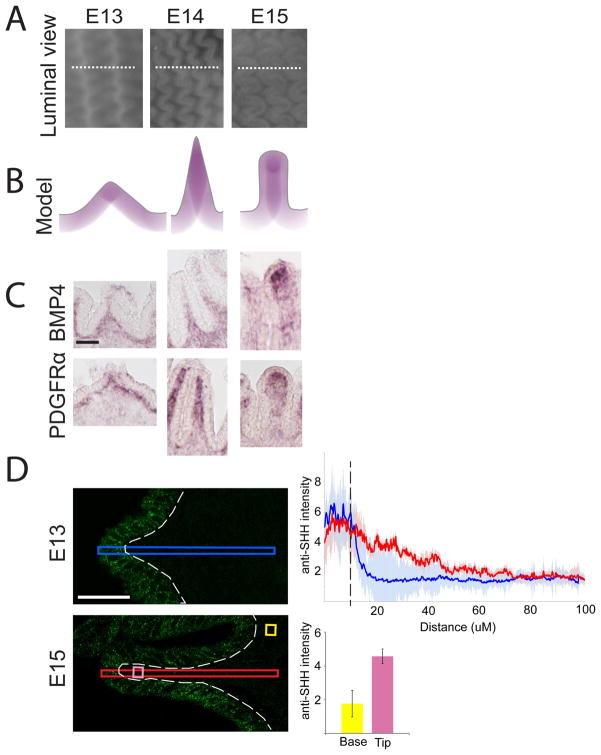
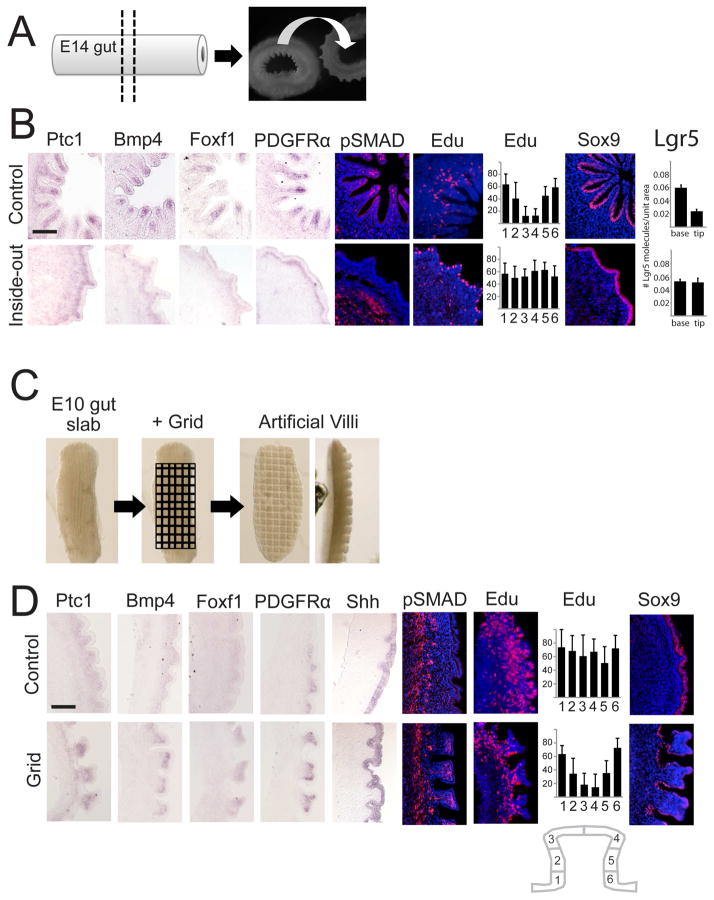
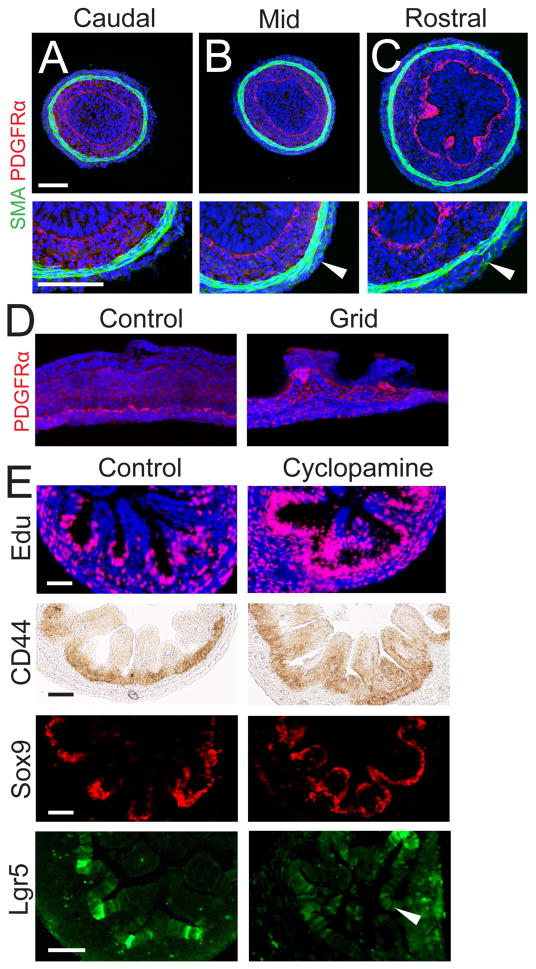
We address the mechanism by which adult intestinal stem cells (ISCs) become localized to the base of each villus during embryonic development. We find that, early in gut development, proliferating progenitors expressing ISC markers are evenly distributed throughout the epithelium, in both the chick and mouse. However, as the villi form, the putative stem cells become restricted to the base of the villi. This shift in the localization is driven by mechanically influenced reciprocal signaling between the epithelium and underlying mesenchyme. Buckling forces physically distort the shape of the morphogenic field, causing local maxima of epithelial signals, in particular Shh, at the tip of each villus. This induces a suite of high-threshold response genes in the underlying mesenchyme to form a signaling center called the "villus cluster." Villus cluster signals, notably Bmp4, feed back on the overlying epithelium to ultimately restrict the stem cells to the base of each villus.


Figures

Figure 1
Figure 1. Intestinal stem cell markers are expressed uniformly in the early mammalian embryo and are refined during development
(A) Lgr5-EGFP-positive cells in heterozygous mouse intestines from E12.5 to E15.5. High-magnification views (below) show progressive restriction of expression from the villus tip. Sections from a littermate control lacking the knock-in allele (right column) shows no GFP expression. (B) CD44 immunohistochemistry in mouse intestines from E12.5 to E15.5. High-magnification views (below) show similar progressive restriction of expression from the villus tip. (C) Sections of the intestine from two different P0 mice that resulted from crossing the Lgr5 knock-in allele containing an inducible Cre with a Rosa26-TdTomato floxed reporter, after tamoxifen induction at E13.5. GFP represents Lgr5 expression at P0, tdTomato indicates the location of cells, and their descendants, that expressed Lgr5 during induction at E13.5. Scale bars, 50 μm.
Figure 2
Figure 2. Restriction of progenitor identity is observed during the slower progression of villus formation in chick
(A) Quantification of single LGR5 mRNA molecules per unit length across the base, middle, and tip of epithelial folds over time (quantifications were done on at least 3 gut samples for each stage). Data are represented as mean +/− one standard deviation See also Figure S2. (C) Immunofluorescence for Sox9 in the chick intestine across development, from E13 when expression is uniform in the epithelium, through E15 when Sox9 is restricted from the tips of the folds, and at hatch when Sox9 is expressed predominantly in the intervillous space. Scale bars, 50 μm.
Figure 3
Figure 3. As the proto-villi form from E13 to E15 the villus cluster signaling center forms in the mesenchyme at the distal tip
(A) Luminal views of the zigzag topography from E13 to E15, expression of cluster genes goes from uniform under the wide folds of the epithelium at E13 (left) to predominantly localized to the mesenchyme under the forming villi at E15 (right). (B) PhophoSMAD staining demonstrates high BMP activity in the villus cluster and the adjacent epithelium. Close-up views (below) of a single fold at E15 highlight epithelial staining (arrowhead), which is less intense than staining in the mesenchymal cluster. Scale bars, 50 μm.
Figure 4
Figure 4. ISC localization is regulated by BMP signaling from the underlying mesenchymal villus cluster signaling center
(A) In situ hybridizations of E14 chick intestines cultured for 36 hours without (control) or with cyclopamine or recombinant Shh ligand. (B) PhosphoSMAD staining of cultured samples demonstrates the impact of compounds and recombinant proteins on BMP activity. (C) Edu labeling of E14 chick intestines cultured for 36 hours with the listed compounds and recombinant proteins. Below - quantification of percent Edu-positive cells across the sub-regions of epithelial folds, at least three folds on each of three samples were counted. (D) Sox9 staining of cultured samples demonstrates the effect of compounds and recombinant proteins on Wnt activity. (E) Quantification of single molecule FISH for LGR5 performed on sections from at least 3 E14 chick intestines cultured for 36 hours without (control) or with cyclopamine. See also Figure S2. Data are represented as mean +/− one standard deviation. Scale bars, 50 μm.
Figure 5
Figure 5. Non-uniform mesenchymal signals are downstream of uniform epithelial signal
(A) Luminal views of the chick intestine from E13 to E15, as progenitor identity is lost from the tips of the folds (also shown in Figure 3A). Dotted lines represent the plane of section for transverse views in B, C, D. (B) Schematic of diffusion of signal from an epithelium of the particular shape at each stage, darker color represents more signal. Note the increasing signal overlap in the underlying mesenchyme as the fold narrows. See also Figure S3. (C) In situ hybridization for Bmp4 (above) PDGFRα (below) expression from E13 to E15 matches the predicted pattern in B (also shown in Figure 3A). (D) Distribution of Shh protein in folded tips of the chick intestine at E13 and E15 (left). Antibody staining intensity across the 100μm region boxed on the left was quantified using the Plot Profile function in Fiji (right). Brightness values were normalized to background levels for each image. A comparison of Shh staining intensity in E13 (graphed in blue) versus E15 (graphed in red) shows increased Shh staining in the E15 mesenchyme (dotted line denotes epithelial-mesenchymal border). The staining intensities across the E13 and E15 epithelia are not significantly different (p<0.08). Three different z-slices from each of three samples were averaged for each stage. Below, the staining intensity found in a 5μm by 5μm region, a 5μm distance from the E15 tip epithelium (pink) is significantly brighter than the in the same sized region 5μm from the E15 base epithelium (yellow) (p<0.001). Measurements from two different z-slices from each of three samples were averaged for each E15 region. Data are represented as mean +/− one standard deviation. Scale bars, 25 μm.
Figure 6
Figure 6. Epithelial shape directs cluster formation
(A) Experimental schematic: a ring of E14 intestine (left) is cultured for 36 hours either as a control segment, or after first being flipped inside out (right). (B) After 36 hours in culture, the cluster signal arises in the control rings (top), similar to what would be found in an E15 intestine. The rings that were flipped inside out before culture have an epithelial shape similar to E13 intestine and concomitantly an in situ pattern and phosphoSMAD staining that matches expression at E13. Proliferation (quantified as in Figure 4), Sox9 expression, and Lgr5 expression are all lost from the tips of folds that form in the control rings. See also Figure S2. (C) Experimental schematic: a slab of E10 intestine (left) is cultured for 36 hours either as a control segment (where wide ridges will be maintained), or under a fine grid which induces many small villi-like bumps (right). (D) After 36 hours in culture, the cluster gene expression and phosphoSMAD staining in control segments is nearly uniform under the epithelium. However, samples grown under the grid form villi-like bumps and display non-uniform expression of cluster genes and BMP activity with highest expression in areas of highest curvature. Proliferation and Sox9 expression are uniform in the control epithelium but in the samples cultured under the grid, proliferation and Sox9 expression are lost from the tips of folds that form particularly in areas where the curvature is highest, and where clusters of mesenchymal expression arise. Data are represented as mean +/− one standard deviation. Scale bars, 50 μm.
Figure 7
Figure 7. Epithelial-mesenchymal signaling in a deforming field drives localization of intestinal stem cells in mouse
(A) The caudal-most region of the small intestine exhibits no epithelial projections and no evidence of the outer, longitudinal smooth muscle in this domain, using smooth muscle actin (SMA) as a marker. (B) More rostrally, the first buckling of the endoderm is observed concurrent with the first appearance of the longitudinal smooth muscle staining, however no cluster expression of PDGFα at this rostrocaudal level is seen, demonstrating epithelial morphogenesis precedes villus cluster gene activation. (C) Even more rostrally, where additional longitudinal smooth muscle differentiation has occurred, deeper alcoves display strong villus cluster gene expression at their tips. Close-up views of the developing outer, longitudinal smooth muscle layer (arrowheads) are shown below. (D) Villus-like structures were generated through constraint with a mesh grid, resulting in the up-regulation of the villus cluster marker PDGFRα when compared to control cultures grown without the grid. (E) Application of cyclopamine to E14.5 mouse guts grown in culture for 30 hours results in maintenance of progenitor identity at the tips of forming villi. Proliferation (Edu), Wnt responsiveness (Sox9) and stem cell markers (CD44 and LGR5) are all found along the folded epithelium (arrowhead) when cluster signals are blocked. Control segments show proper restriction to the base of folds. Scale bars, 50 μm.

Comment in

  • Gradients are shaping up.
    Bollenbach T, Heisenberg CP. Bollenbach T, et al. Cell. 2015 Apr 23;161(3):431-432. doi: 10.1016/j.cell.2015.04.009. Cell. 2015. PMID: 25910201

References

    1. Barker N, van Es JH, Kuipers J, Kujala P, van den Born M, Cozijnsen M, Haegebarth A, Korving J, Begthel H, Peters PJ, Clevers H. Identification of stem cells in small intestine and colon by marker gene Lgr5. Nature. 2007;449:1003–7. - PubMed
    1. Batts LE, Polk DB, Dubois RN, Kulessa H. Bmp signaling is required for intestinal growth and morphogenesis. Dev Dyn. 2006;235:1563–70. - PubMed
    1. Blache P, van de Wetering M, Duluc I, Domon C, Berta P, Freund JN, Clevers H, Jay P. SOX9 is an intestine crypt transcription factor, is regulated by the Wnt pathway, and represses the CDX2 and MUC2 genes. J Cell Biol. 2004;5:166, 37–47. - PMC - PubMed
    1. Charité J, de Graaff W, Shen S, Deschamps J. Ectopic expression of Hoxb-8 causes duplication of the ZPA in the forelimb and homeotic transformation of axial structures. Cell. 1994;78:589–601. - PubMed
    1. Coulombre AJ, Coulombre JL. Intestinal development, I. Morphogenesis of the villi and musculature. J Embryol Exp Morphol. 1958;6:403–411. - PubMed

Publication types