

Reappraisal of the glycerol test in patients with suspected Menière's disease
- PMID: 25866475
- PMCID: PMC4392460
- DOI: 10.1186/1472-6815-14-12
Reappraisal of the glycerol test in patients with suspected Menière's disease
Abstract
Background: Recent advances in magnetic resonance imaging make it possible to visualize the presumed pathophysiologic correlate of Menière's disease: endolymphatic hydrops. As traditional diagnostic tests can provide only indirect evidence, they are hardly competitive in this respect and need to be rethought. This is done here for the glycerol test.
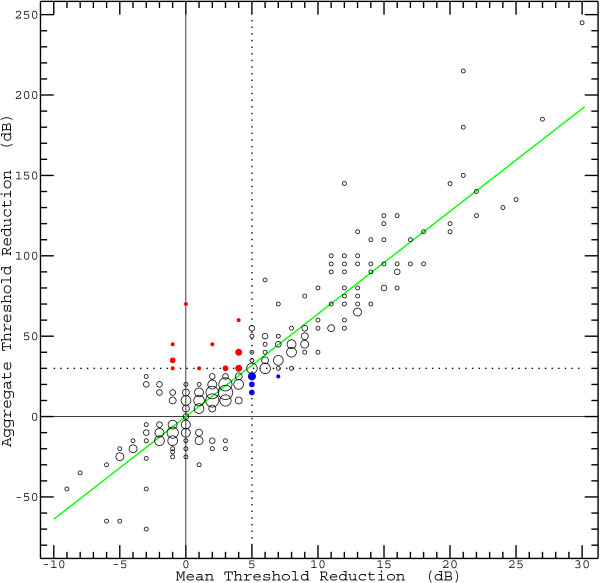
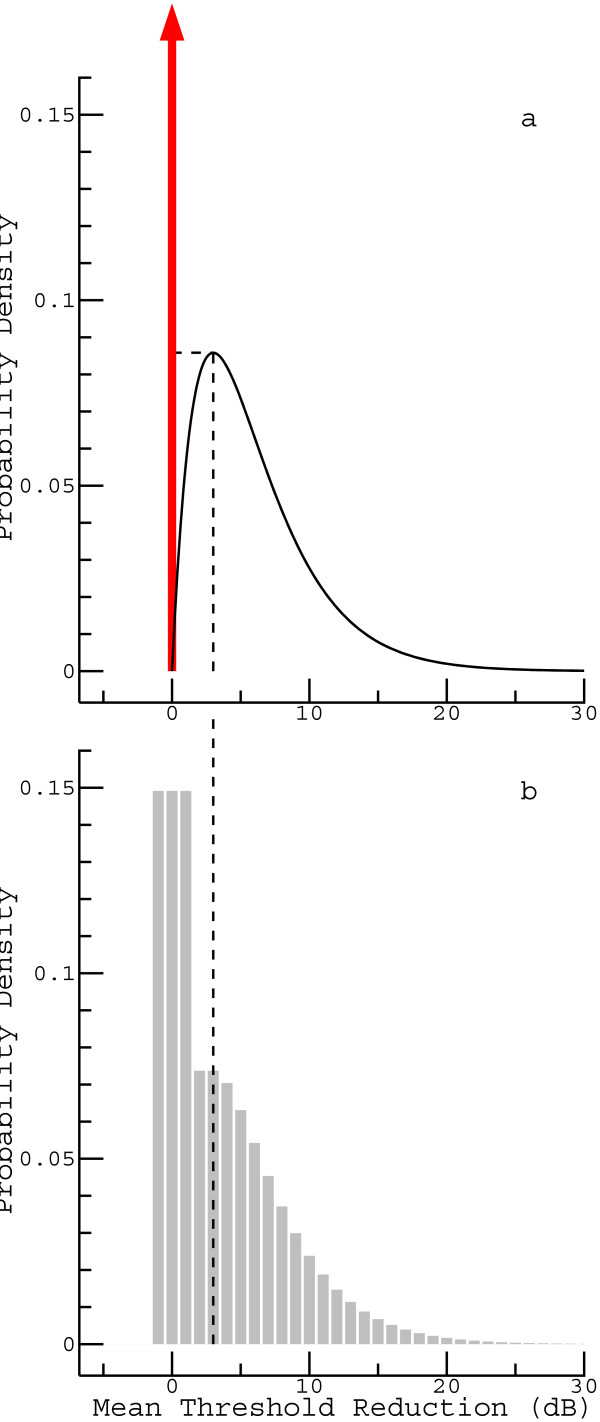
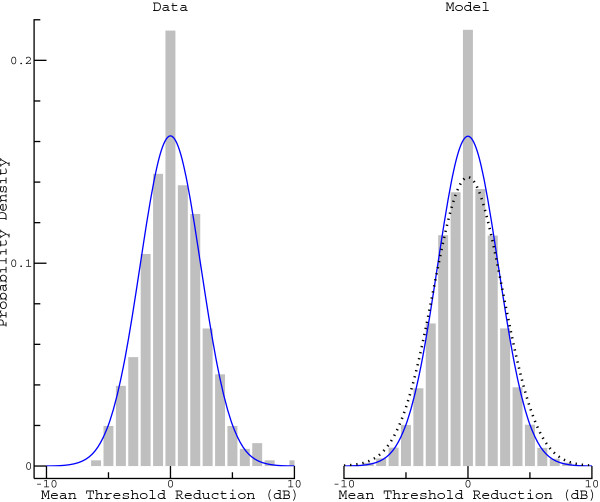
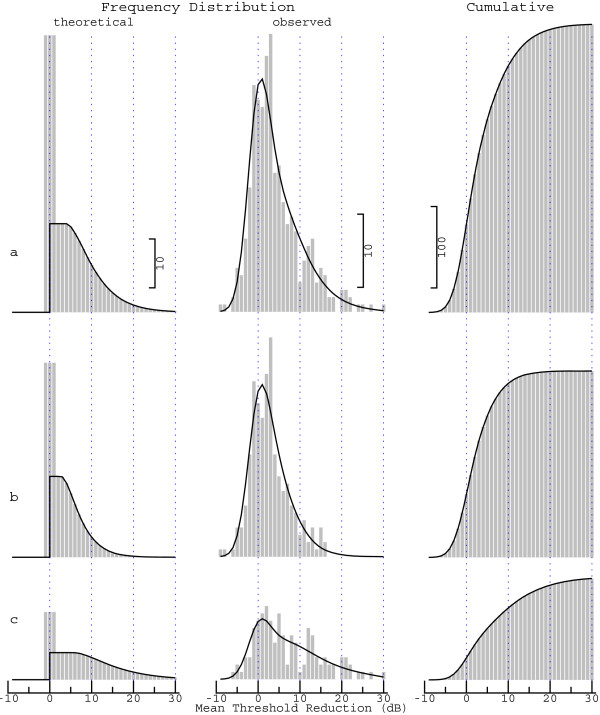
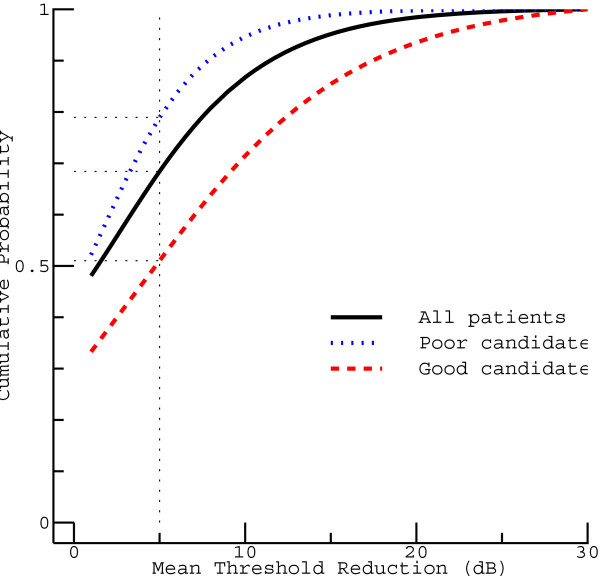
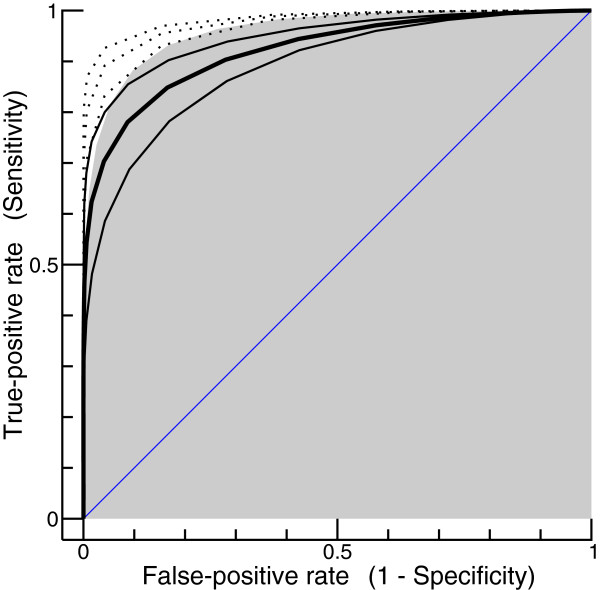
Methods: The data of a previous retrospective analysis of the glycerol test in patients with suspected Menière's disease are reinterpreted using a simple model. The mean threshold reduction (MTR) in the frequency range from 125 to 1500 Hz (calculated from audiograms obtained immediately before and four hours after the glycerol intake) is used as the test statistic. The proposed model explains the frequency distribution of the observed MTR by the convolution of a Gaussian probability density function (representing measurement errors) with a template representing the frequency distribution of the true MTR. The latter is defined in terms of two adjustable parameters. After fitting the model to the data, the performance of the test is evaluated using receiver operating characteristic (ROC) analysis.
Results: The cumulative frequency distribution of the observed MTR can be explained almost perfectly by the model. According to the ROC analysis performed, the capability of the currently used audiometric procedure to detect a glycerol-induced threshold reduction corresponds to a diagnostic test of rather high accuracy (area under the ROC curve greater than 0.9). Simulations show that methodological improvements could further enhance the performance.
Conclusions: Owing to their ability to reveal functional aspects without an obvious morphological correlate, traditional test for Menière's disease could be decisive for defining the stage of the disease. A distinctive feature of the glycerol test is that it is capable of determining, with high accuracy, whether the pathophysiologic condition of the inner ear is partially reversible. Prospectively, this could help to estimate the chances of specific therapies.
Figures
Similar articles
-
Auditory threshold shifts after glycerol administration to patients with suspected Menière's disease: a retrospective analysis.Ear Hear. 2013 May-Jun;34(3):370-84. doi: 10.1097/AUD.0b013e31826d0c08. Ear Hear. 2013. PMID: 23196699
-
Novel Magnetic Resonance Imaging-Based Method for Accurate Diagnosis of Meniere's Disease.Front Surg. 2021 Jun 22;8:671624. doi: 10.3389/fsurg.2021.671624. eCollection 2021. Front Surg. 2021. PMID: 34239892 Free PMC article.
-
A preliminary report on the correlation of vestibular Meniére's disease with electrocochleography and glycerol test.Acta Otolaryngol Suppl. 1995;520 Pt 2:241-6. doi: 10.3109/00016489509125238. Acta Otolaryngol Suppl. 1995. PMID: 8749129
-
What is Menière's disease? A contemporary re-evaluation of endolymphatic hydrops.J Neurol. 2016 Apr;263 Suppl 1:S71-81. doi: 10.1007/s00415-015-7930-1. Epub 2016 Apr 15. J Neurol. 2016. PMID: 27083887 Free PMC article. Review.
-
[Clinical significance of radiological methods for diagnosing endolymphatic hydrops in Ménière's disease].Vestn Otorinolaringol. 2021;86(5):82-89. doi: 10.17116/otorino20218605182. Vestn Otorinolaringol. 2021. PMID: 34783479 Review. Russian.
Cited by
-
Role of Cervical Vestibular Evoked Myogenic Potentials (cVEMP) as Outcome-Measure of Glycerol Test.Indian J Otolaryngol Head Neck Surg. 2019 Oct;71(Suppl 1):425-433. doi: 10.1007/s12070-018-1335-2. Epub 2018 May 27. Indian J Otolaryngol Head Neck Surg. 2019. PMID: 31741998 Free PMC article.
References
-
- Atkinson M. Menière’s original papers; reprinted with an English translation together with commentaries and biographical sketch. Acta Otolaryngo (Stockh) 1961;Suppl. 162:1–78.
-
- Arts HA, Kileny PR, Telian SA. Diagnostic testing for endolymphatic hydrops. Otolaryngol Clin North Am. 1997;30(6):987–1005. - PubMed
Pre-publication history
-
- The pre-publication history for this paper can be accessed here: http://www.biomedcentral.com/1472-6815/14/12/prepub
LinkOut - more resources
Full Text Sources
Other Literature Sources
Research Materials
