. 2016 Jan 14;35(2):148-57.
doi: 10.1038/onc.2015.79. Epub 2015 Apr 13.

mTOR inhibitors induce apoptosis in colon cancer cells via CHOP-dependent DR5 induction on 4E-BP1 dephosphorylation

Affiliations

mTOR inhibitors induce apoptosis in colon cancer cells via CHOP-dependent DR5 induction on 4E-BP1 dephosphorylation

K He et al. Oncogene. .

Abstract

The mammalian target of rapamycin (mTOR) is commonly activated in colon cancer. mTOR complex 1 (mTORC1) is a major downstream target of the PI3K/ATK pathway and activates protein synthesis by phosphorylating key regulators of messenger RNA translation and ribosome synthesis. Rapamycin analogs Everolimus and Temsirolimus are non-ATP-competitive mTORC1 inhibitors, and suppress proliferation and tumor angiogenesis and invasion. We now show that apoptosis plays a key role in their anti-tumor activities in colon cancer cells and xenografts through the DR5, FADD and caspase-8 axis, and is strongly enhanced by tumor necrosis factor-related apoptosis-inducing ligand (TRAIL) and 5-fluorouracil. The induction of DR5 by rapalogs is mediated by the ER stress regulator and transcription factor CHOP, but not the tumor suppressor p53, on rapid and sustained inhibition of 4E-BP1 phosphorylation, and attenuated by eIF4E expression. ATP-competitive mTOR/PI3K inhibitors also promote DR5 induction and FADD-dependent apoptosis in colon cancer cells. These results establish activation of ER stress and the death receptor pathway as a novel anticancer mechanism of mTOR inhibitors.


Figures
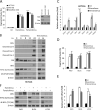
Figure 1
Figure 1. mTOR inhibitors activate apoptosis and expression of extrinsic apoptotic regulators. A-C
HCT 116 cells or derivatives were treated with vehicle (untreated, Un), 20 μmol/L Everolimus or Temsirolimus and analyzed at indicated times. A, apoptosis in the indicated HCT116 lines at 48 hours was analyzed by counting condensed and fragmented nuclei. Right, lack of protein expression in KO cells confirmed by western blotting. B, the indicated proteins were analyzed by western blotting. β-actin is a loading control. C, mRNA levels of the indicated genes at 24 hours were analyzed by real-time RT-PCR. The levels in vehicle (UN) treated cells were set at 1. D, RKO, DLD1 and HT29 cells were treated with 25 μmol/L Everolimus or 20 μmol/L Temsirolimus. Apoptosis was analyzed at 48 hours by counting condensed and fragmented nuclei. E, cells were treated as in D. mRNA levels of DR5 at 24 hours were analyzed by RT-PCR. F, cells were treated as in D. The indicated proteins were analyzed by western blotting. β-actin is a loading control. A,C, D and E, values represent means + s.d. (n=3). *P < 0.05, **P < 0.01, ***P < 0.001 [Student's t-test, two-tailed]. Drugs vs. Un.
Figure 2
Figure 2. Induction of ER stress and CHOP-mediated DR5 and apoptosis by rapalogs
A, HCT116 cells were treated with various concentrations of Everolimus and analyzed for indicated proteins and times by western blotting. B, HCT116 cells were transfected with HA-eIF4E or vector for 24 hours, treated with 20 μmol/L Everolimus for 24 hours, and analyzed for indicated proteins by western blotting. C, chromatin immunoprecipitation (ChIP) was performed using a CHOP-specific antibody on cells treated with 20 μmol/L Everolimus for 24 hours. IgG was used to control for specificity. PCR was carried out using primers surrounding the CHOP binding sites in the DR5 promoter. D, cells were transfected with either scramble or CHOP siRNA 24 hours prior to drug treatment. mRNA level of DR5 at 24 hours were analyzed by RT-PCR. Values represent means + s.d. (n=3). **P < 0.01 [Student's t-test, two-tailed]. Scramble vs. CHOP siRNA. E, cells treated as in D for 48 hours and analyzed for the indicated proteins by western blotting. F, ER stress markers were analyzed at 24 hours with 20 μmol/L Everolimus or Temsirolimus. Splicing of XBP-1 was determined by PCR, and other markers by western blotting.
Figure 3
Figure 3. DR5 and Caspase-8 are required for mTOR inhibitors-induced apoptosis
HCT 116 cells or derivatives were treated with vehicle (Un), 20 μmol/L Everolimus or Temsirolimus and analyzed at indicated times. A, HCT116 cells were transfected with either a scramble siRNA or DR5 siRNA for 24 hours prior to 48 hours of drug treatment. Apoptosis was analyzed by counting condensed and fragmented nuclei. B, active caspase-3 and −8, and DR5 were analyzed at 24 hours of drug treatment by western blotting. C, Apoptosis was analyzed in HCT116 cells stably expressed scramble shRNA or caspase-8 shRNA at 48 hours of drug treatment by counting condensed and fragmented nuclei. Right, caspase-8 knockdown confirmed by western blotting. D. Cells treated as in C were analyzed for apoptosis by flow cytometry following staining with Annexin V/propidium iodide. E, Colony formation assay of indicated cells treated for 24 hours, and the attached cells were stained with crystal violet after 14 days. Representative pictures are shown. F, quantification of colonies in E. A, C and F, values in represent means + s.d. (n=3). **P < 0.01, [Student's t-test, two-tailed]. WT vs. DR5 siRNA or Caspase-8 shRNA cells.
Figure 4
Figure 4. FADD is required for mTOR inhibitors-induced apoptosis
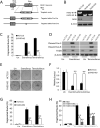
A, Schematic representation of the FADD genomic locus and the FADD targeting construct. P1 and P2 are PCR primers (sequences in Table S2) for identifying knockout clones. B, FADD knockout (KO) HCT116 clones were confirmed by genomic PCR and western blotting. C, Indicated cells were treated with 20 μmol/L Everolimus or Temsirolimus for 48 hours. Apoptosis was analyzed by counting condensed and fragmented nuclei. D, active caspase-3 and −8 was analyzed in cells treated as in C by western blotting. E, colony formation of WT and FADD-KO HCT116 cells treated with 20 μmol/L Everolimus or Temsirolimus for 24 hours, and stained at14 days after treatment. Representative pictures are shown. F, quantification of colonies in E. G, WT and dominant negative FADD (FADD-DN) stable HCT116 cells were treated with 20 μmol/L Everolimus or Temsirolimus for 48 hours. Apoptosis was analyzed by counting condensed and fragmented nuclei. H, WT, FADD-DN stable RKO cells (clone 1 and clone 4) were treated with 25 μmol/L Everolimus or 20 μmol/L Temsirolimus for 48 hours. Apoptosis was analyzed by counting condensed and fragmented nuclei. β-actin is a loading control for all western blots. C, F, G and H, values represent means + s.d. (n=3). **P < 0.01 [Student's t-test, two-tailed]. WT vs. FADD-KO or FADD-DN cells.
Figure 5
Figure 5. Induction of CHOP, DR4 and DR5, and FADD-dependent apoptosis by Torin 1
WT and FADD-KO HCT116 cells were treated with Torin 1 at indicated concentrations. A, mRNA levels of the indicated gene at 24 hours after 15 μmol/L treatment were analyzed by real-time RT-PCR. B, apoptosis in the indicated cells was analyzed at 48 hours by counting condensed and fragmented nuclei. C, the indicated proteins were analyzed by western blotting at 24 hours. β-actin is a loading control. A and B, values represent means + s.d. (n=3). *P < 0.05, **P < 0.01 [Student's t-test, two-tailed]. A, Torin 1 vs.Un, B, WT vs. FADD KO. D, A model. Selectively blocking 4EBP1 phosphorylation mediated by mTOR or an unidentified kinase inhibits eIF4E, and induces ER stress and CHOP-dependent DR5 upregulation and apoptosis. mTOR inhibitors are predicted to synergize with agents that active or induce DR5/DR4.
Figure 6
Figure 6. Everolimus induces drug sensitization via the extrinsic pathway
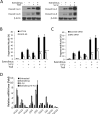
HCT116 cells and derivatives were treated with 18 μmol/L Everolimus, 10 ng/mL TRAIL, 50 μg/mL 5-FU, or indicated combination for 24 hours. A, active caspsae−3 and −8 was analyzed by western blotting. B, apoptosis was analyzed by counting condensed and fragmented nuclei in WT or FADD-KO cells. C, apoptosis was analyzed by counting condensed and fragmented nuclei in WT or DR5 siRNA transfected cells as in B. D, mRNA levels of the indicated genes were analyzed by realtime RT- PCR. β-actin is a loading control for all western blots. B, C, and D, values represent means + s.d. (n=3). *P < 0.05, **P < 0.01, ***P < 0.001 [Student's t-test, two-tailed]. B, C WT vs. FADD KO, or scramble vs. DR5 siRNA. D combination vs. single.
Figure 7
Figure 7. Apoptosis contributes to the antitumor effects of Everolimus in a xenograft model
A, nude mice after 1 week of implantation of 4×10⁶ WT or FADD-KO HCT116 cells were treated with 5 mg/kg of Everolimus or the control buffer (vehicle) for 10 consecutive days. Tumor volume was plotted. N=6 mice/group. *P < 0.05 [Student's t-test, two-tailed]. WT vs. FADD KO. B, HCT116 WT tumors were harvested the day after the last treatment (day 11). The indicated proteins in randomly chosen tumors were analyzed by western blotting. β-actin is a loading control. C and D, WT and FADD-KO tumors were analyzed by TUNEL staining and active caspase-3 staining, respectively. Left, representative pictures; right, quantification. E and F, WT and FADD-KO tumors were analyzed by staining for phosphor-4E-BP1 and CD31 (endothelial cells), respectively. Left, representative pictures; right, quantification. C -F, values represent means + s.d, n=3. **P < 0.01 [Student's t-test, two-tailed]. WT vs. FADD-KO.

References

    1. Siegel R, Naishadham D, Jemal A. Cancer statistics, 2012. CA Cancer J Clin. 2012;62:10–29. - PubMed
    1. Vogelstein B, Papadopoulos N, Velculescu VE, Zhou S, Diaz LA, Jr., Kinzler KW. Cancer genome landscapes. Science. 2013;339:1546–58. - PMC - PubMed
    1. Laplante M, Sabatini DM. mTOR signaling in growth control and disease. Cell. 2012;149:274–93. - PMC - PubMed
    1. Sonenberg N, Hinnebusch AG. Regulation of translation initiation in eukaryotes: mechanisms and biological targets. Cell. 2009;136:731–45. - PMC - PubMed
    1. Zhang YJ, Dai Q, Sun DF, Xiong H, Tian XQ, Gao FH, et al. mTOR signaling pathway is a target for the treatment of colorectal cancer. Ann Surg Oncol. 2009;16:2617–28. - PubMed

Publication types

MeSH terms