

IFN-γ from lymphocytes induces PD-L1 expression and promotes progression of ovarian cancer
- PMID: 25867264
- PMCID: PMC4453666
- DOI: 10.1038/bjc.2015.101
IFN-γ from lymphocytes induces PD-L1 expression and promotes progression of ovarian cancer
Abstract
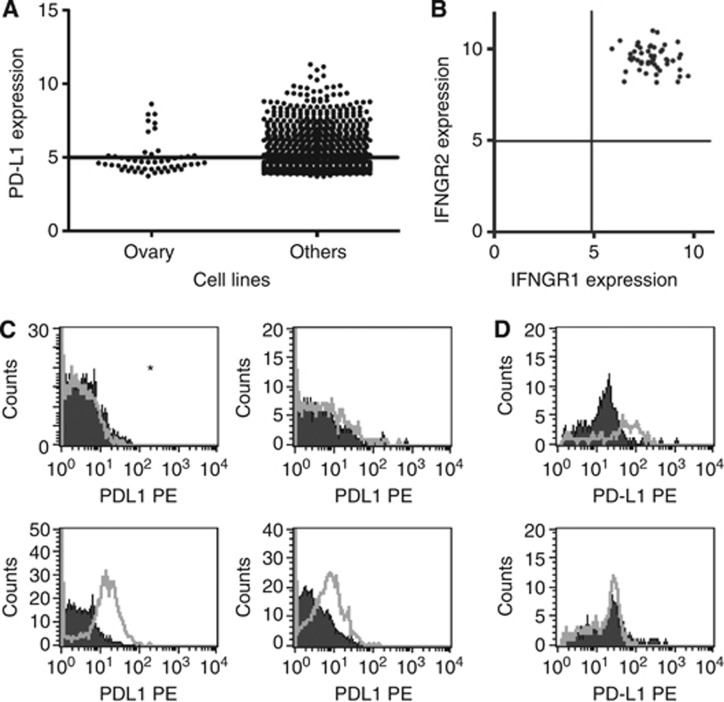
Background: PD-L1 (programmed cell death 1 ligand 1) on tumour cells suppresses host immunity through binding to its receptor PD-1 on lymphocytes, and promotes peritoneal dissemination in mouse models of ovarian cancer. However, how PD-L1 expression is regulated in ovarian cancer microenvironment remains unclear.
Methods: The number of CD8-positive lymphocytes and PD-L1 expression in tumour cells was assessed in ovarian cancer clinical samples. PD-L1 expression and tumour progression in mouse models under conditions of altering IFN-γ signals was assessed.
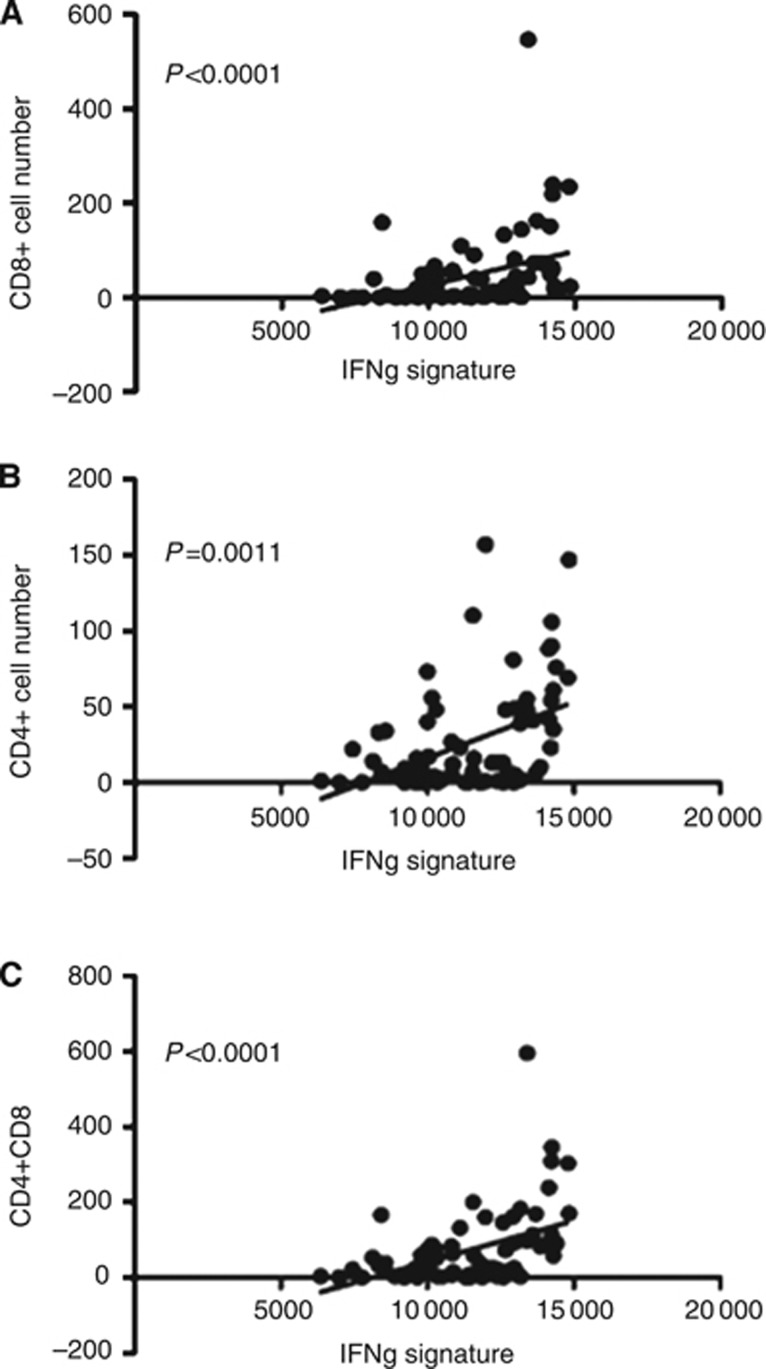
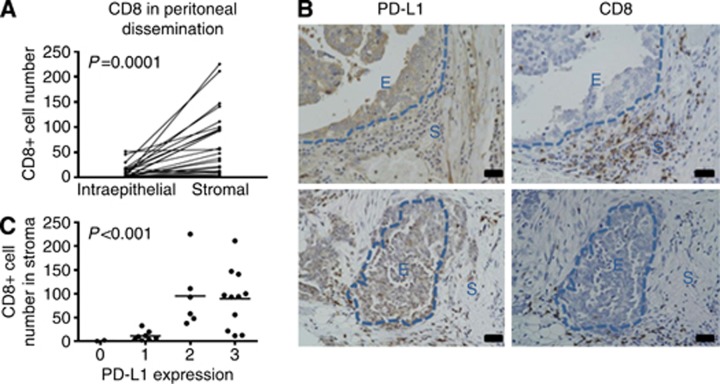
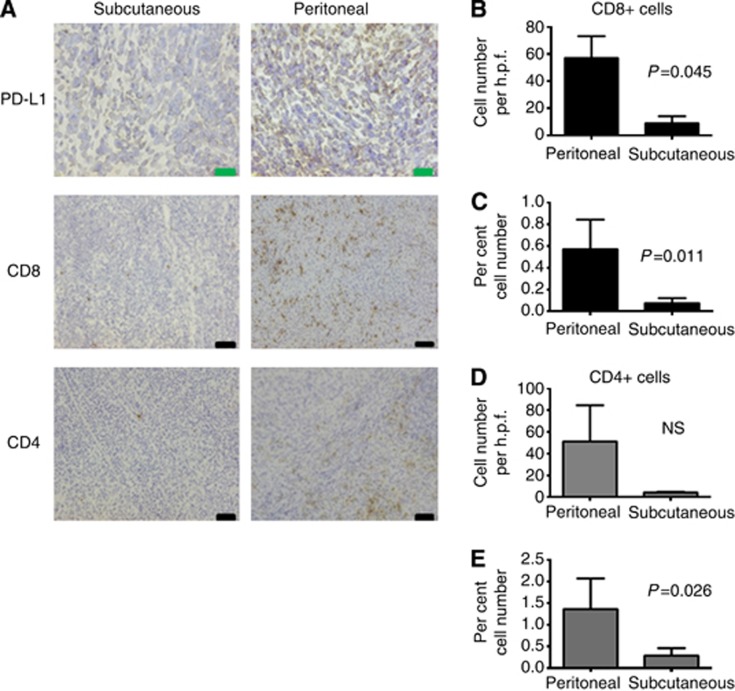
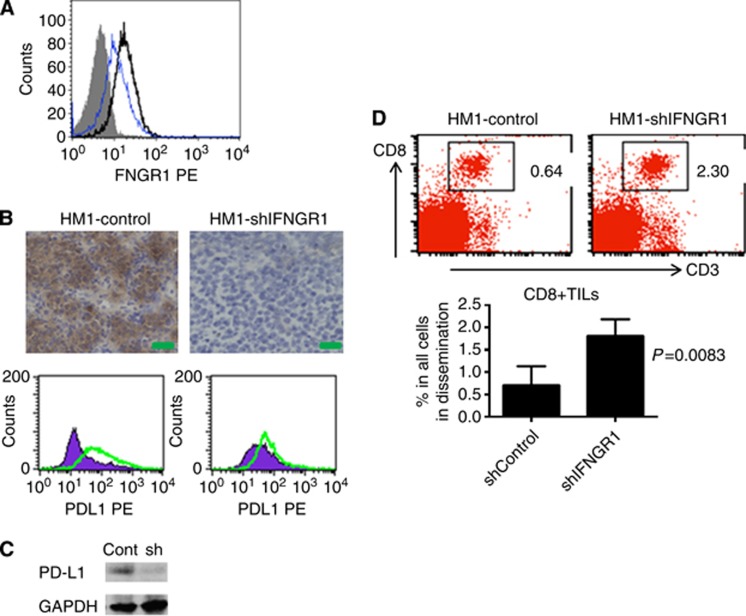
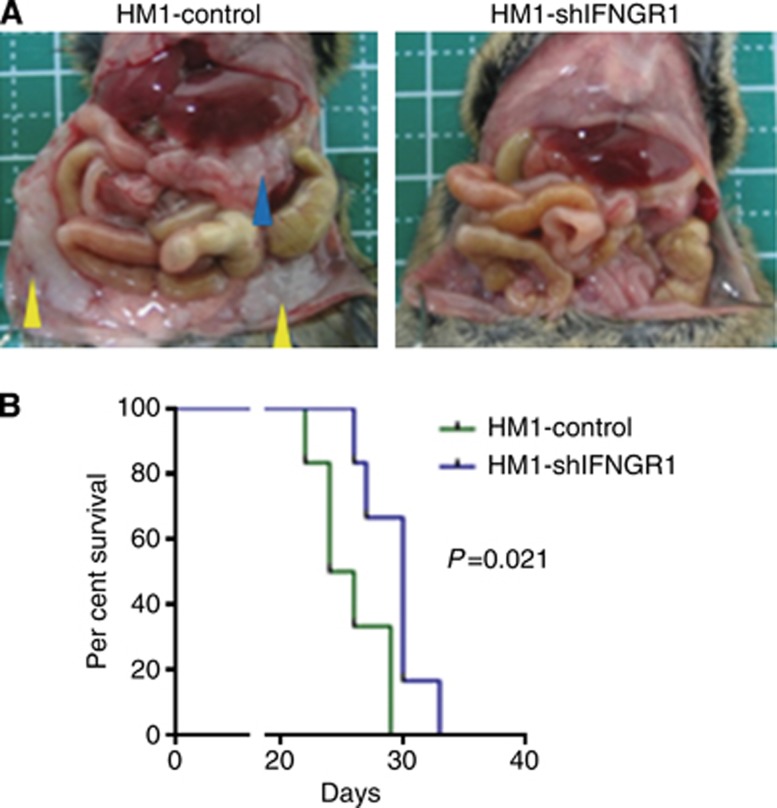
Results: The number of CD8-positive cells in cancer stroma was very high in peritoneally disseminated tumours, and was strongly correlated to PD-L1 expression on the tumour cells (P<0.001). In mouse models, depleting IFNGR1 (interferon-γ receptor 1) resulted in lower level of PD-L1 expression in tumour cells, increased the number of tumour-infiltrating CD8-positive lymphocytes, inhibition of peritoneal disseminated tumour growth and longer survival (P=0.02). The injection of IFN-γ into subcutaneous tumours induced PD-L1 expression and promoted tumour growth, and PD-L1 depletion completely abrogated tumour growth caused by IFN-γ injection (P=0.01).
Conclusions: Interferon-γ secreted by CD8-positive lymphocytes upregulates PD-L1 on ovarian cancer cells and promotes tumour growth. The lymphocyte infiltration and the IFN-γ status may be the key to effective anti-PD-1 or anti-PD-L1 therapy in ovarian cancer.
Figures
References
-
- Abiko K, Mandai M, Hamanishi J, Yoshioka Y, Matsumura N, Baba T, Yamaguchi K, Murakami R, Yamamoto A, Kharma B, Kosaka K, Konishi I. PD-L1 on tumor cells is induced in ascites and promotes peritoneal dissemination of ovarian cancer through CTL dysfunction. Clin Cancer Res. 2013;19 (6:1363–1374. - PubMed
-
- Alberts DS, Marth C, Alvarez RD, Johnson G, Bidzinski M, Kardatzke DR, Bradford WZ, Loutit J, Kirn DH, Clouser MC, Markman M. Randomized phase 3 trial of interferon gamma-1b plus standard carboplatin/paclitaxel versus carboplatin/paclitaxel alone for first-line treatment of advanced ovarian and primary peritoneal carcinomas: results from a prospectively designed analysis of progression-free survival. Gynecol Oncol. 2008;109 (2:174–181. - PubMed
-
- Barbie DA, Tamayo P, Boehm JS, Kim SY, Moody SE, Dunn IF, Schinzel AC, Sandy P, Meylan E, Scholl C, Frohling S, Chan EM, Sos ML, Michel K, Mermel C, Silver SJ, Weir BA, Reiling JH, Sheng Q, Gupta PB, Wadlow RC, Le H, Hoersch S, Wittner BS, Ramaswamy S, Livingston DM, Sabatini DM, Meyerson M, Thomas RK, Lander ES, Mesirov JP, Root DE, Gilliland DG, Jacks T, Hahn WC. Systematic RNA interference reveals that oncogenic KRAS-driven cancers require TBK1. Nature. 2009;462 (7269:108–112. - PMC - PubMed
-
- Barnett JC, Bean SM, Whitaker RS, Kondoh E, Baba T, Fujii S, Marks JR, Dressman HK, Murphy SK, Berchuck A. Ovarian cancer tumor infiltrating T-regulatory (T(reg)) cells are associated with a metastatic phenotype. Gynecol Oncol. 2010;116 (3:556–562. - PubMed
-
- Barretina J, Caponigro G, Stransky N, Venkatesan K, Margolin AA, Kim S, Wilson CJ, Lehar J, Kryukov GV, Sonkin D, Reddy A, Liu M, Murray L, Berger MF, Monahan JE, Morais P, Meltzer J, Korejwa A, Jane-Valbuena J, Mapa FA, Thibault J, Bric-Furlong E, Raman P, Shipway A, Engels IH, Cheng J, Yu GK, Yu J, Aspesi P, Jr, de Silva M, Jagtap K, Jones MD, Wang L, Hatton C, Palescandolo E, Gupta S, Mahan S, Sougnez C, Onofrio RC, Liefeld T, MacConaill L, Winckler W, Reich M, Li N, Mesirov JP, Gabriel SB, Getz G, Ardlie K, Chan V, Myer VE, Weber BL, Porter J, Warmuth M, Finan P, Harris JL, Meyerson M, Golub TR, Morrissey MP, Sellers WR, Schlegel R, Garraway LA. The Cancer Cell Line Encyclopedia enables predictive modelling of anticancer drug sensitivity. Nature. 2012;483 (7391:603–607. - PMC - PubMed
Publication types
MeSH terms
Substances
LinkOut - more resources
Full Text Sources
Other Literature Sources
Medical
Molecular Biology Databases
Research Materials
