Review
. 2015 Apr 13;10(4):e0124360.
doi: 10.1371/journal.pone.0124360. eCollection 2015.

Overview of a surface-ripened cheese community functioning by meta-omics analyses

Affiliations
Review

Overview of a surface-ripened cheese community functioning by meta-omics analyses

Eric Dugat-Bony et al. PLoS One. .

Abstract

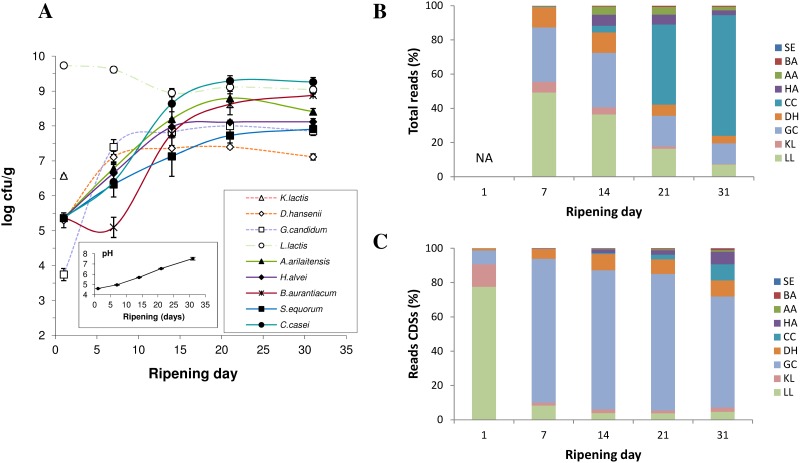
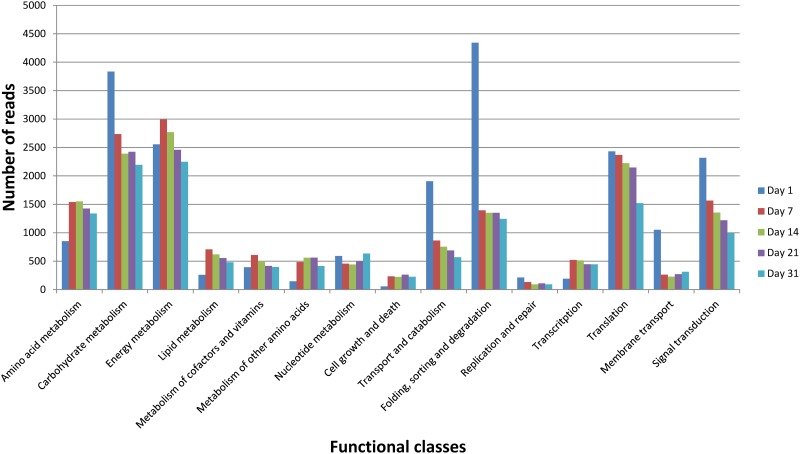
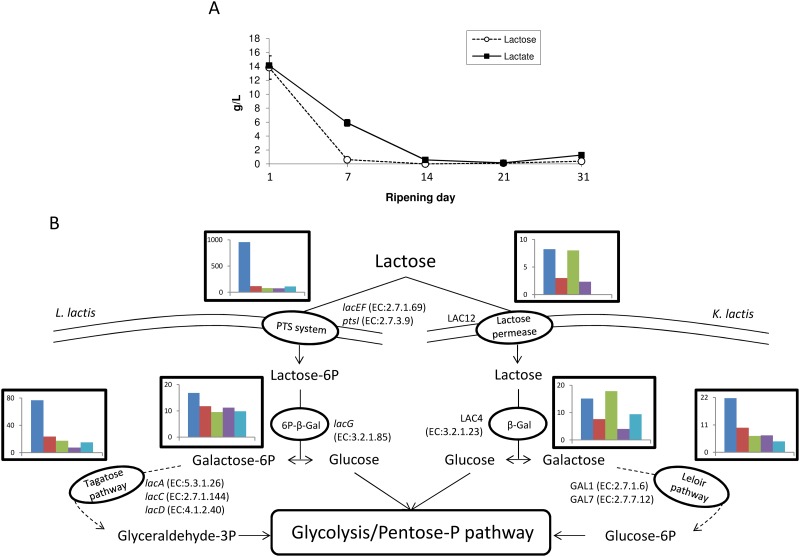
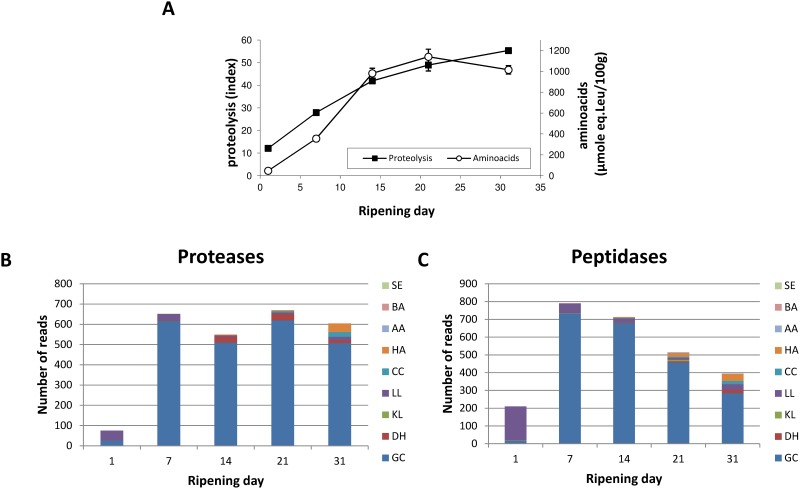
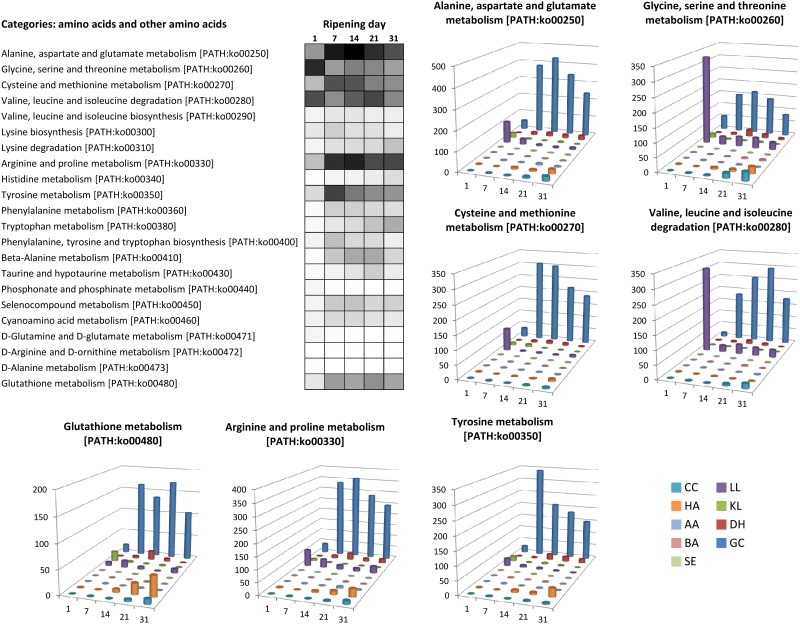
Cheese ripening is a complex biochemical process driven by microbial communities composed of both eukaryotes and prokaryotes. Surface-ripened cheeses are widely consumed all over the world and are appreciated for their characteristic flavor. Microbial community composition has been studied for a long time on surface-ripened cheeses, but only limited knowledge has been acquired about its in situ metabolic activities. We applied metagenomic, metatranscriptomic and biochemical analyses to an experimental surface-ripened cheese composed of nine microbial species during four weeks of ripening. By combining all of the data, we were able to obtain an overview of the cheese maturation process and to better understand the metabolic activities of the different community members and their possible interactions. Furthermore, differential expression analysis was used to select a set of biomarker genes, providing a valuable tool that can be used to monitor the cheese-making process.


Conflict of interest statement

Competing Interests: The authors have declared that no competing interests exist.

Figures

Fig 1
Fig 1. Changes in the microbial community structure during surface-ripened cheese maturation.
(A) Microbiological counts and pH measurements. (B) Distribution of metagenomic data by species. (C) Distribution of metatranscriptomic data by species (only reads mapping CDS features were taken into account). SE: Staphylococcus equorum. BA: Brevibacterium aurantiacum. AA: Arthrobacter arilaitensis. HA: Hafnia alvei. CC: Corynebacterium casei. DH: Debaryomyces hansenii. GC: Geotrichum candidum. KL: Kluyveromyces lactis. LL: Lactococcus lactis. NA: data not available.
Fig 2
Fig 2. Functional classification of the metatranscriptome during surface-ripened cheese maturation.
Functional classes were determined according to KEGG annotations. Read counts corresponding to all species were cumulated. Read numbers were normalized (according to the library size) to 50,000 reads per sampling day.
Fig 3
Fig 3. Lactose metabolism during surface-ripened cheese maturation.
(A) Lactose and lactate concentrations. (B) Expression dynamics of lactose degradation pathways in Lactococcus lactis and Kluyveromyces lactis. Read numbers were normalized (according to the library size) to 50,000 reads per sampling day. For each degradation step, a histogram represents cumulative read numbers when several genes were involved.
Fig 4
Fig 4. Protein degradation during surface-ripened cheese maturation.
(A) Proteolysis and free amino acid concentration. Expression data observed for genes encoding proteases (B) and peptidases (C). Read numbers were normalized (according to the library size) to 50,000 reads per sampling day. SE: Staphylococcus equorum. BA: Brevibacterium aurantiacum. AA: Arthrobacter arilaitensis. HA: Hafnia alvei. CC: Corynebacterium casei. LL: Lactococcus lactis. KL: Kluyveromyces lactis. DH: Debaryomyces hansenii. GC: Geotrichum candidum.
Fig 5
Fig 5. Gene expression related to amino acid metabolism.
For each pathway, the heatmap represents the expression dynamics over time (cumulative number of normalized reads per pathway) using a gray scale bar from 0 read in white to 500 reads in black. For seven pathways, histogram charts detail this dynamic per microbial species. CC: Corynebacterium casei, HA: Hafnia alvei, AA: Arthrobacter arilaitensis, BA: Brevibacterium aurantiacum, SE: Staphylococcus equorum, LL: Lactococcus lactis, KL: Kluyveromyces lactis, DH: Debaryomyces hansenii, GC: Geotrichum candidum.

References

    1. Montel MC, Buchin S, Mallet A, Delbes-Paus C, Vuitton DA, Desmasures N, et al. Traditional cheeses: Rich and diverse microbiota with associated benefits. Int J Food Microbiol. 2014;177: 136–154. 10.1016/j.ijfoodmicro.2014.02.019 - DOI - PubMed
    1. Irlinger F, Mounier J. Microbial interactions in cheese: implications for cheese quality and safety. Curr Opin Biotechnol. 2009;20: 142–148. 10.1016/j.copbio.2009.02.016 - DOI - PubMed
    1. Sousa MJ, Ardö Y, McSweeney PLH. Advances in the study of proteolysis during cheese ripening. Int Dairy J. 2001;11: 327–345.
    1. Collins YF, McSweeney PLH, Wilkinson MG. Lipolysis and free fatty acid catabolism in cheese: a review of current knowledge. Int Dairy J. 2003;13: 841–866. 10.1016/S0958-6946(03)00109-2 - DOI
    1. Yvon M, Rijnen L. Cheese flavour formation by amino acid catabolism. Int Dairy J. 2001;11: 185–201.

Publication types

LinkOut - more resources