. 2015 Apr 14:6:6778.
doi: 10.1038/ncomms7778.

Foxp1-mediated programming of limb-innervating motor neurons from mouse and human embryonic stem cells

Affiliations

Foxp1-mediated programming of limb-innervating motor neurons from mouse and human embryonic stem cells

Katrina L Adams et al. Nat Commun. .

Abstract

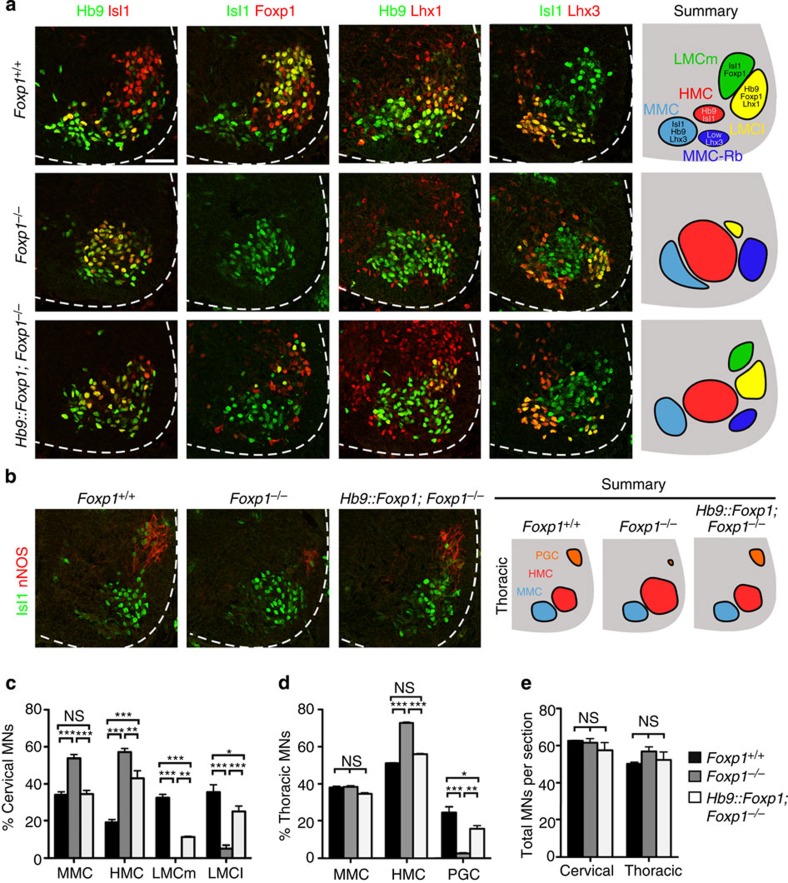
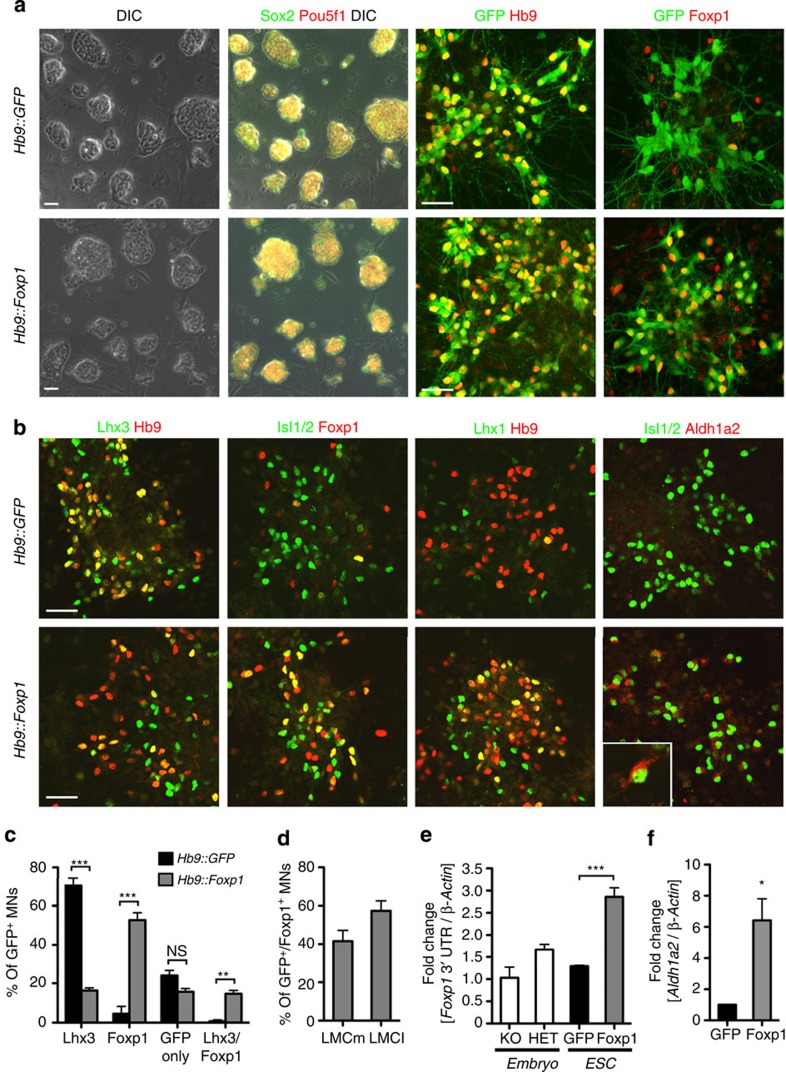
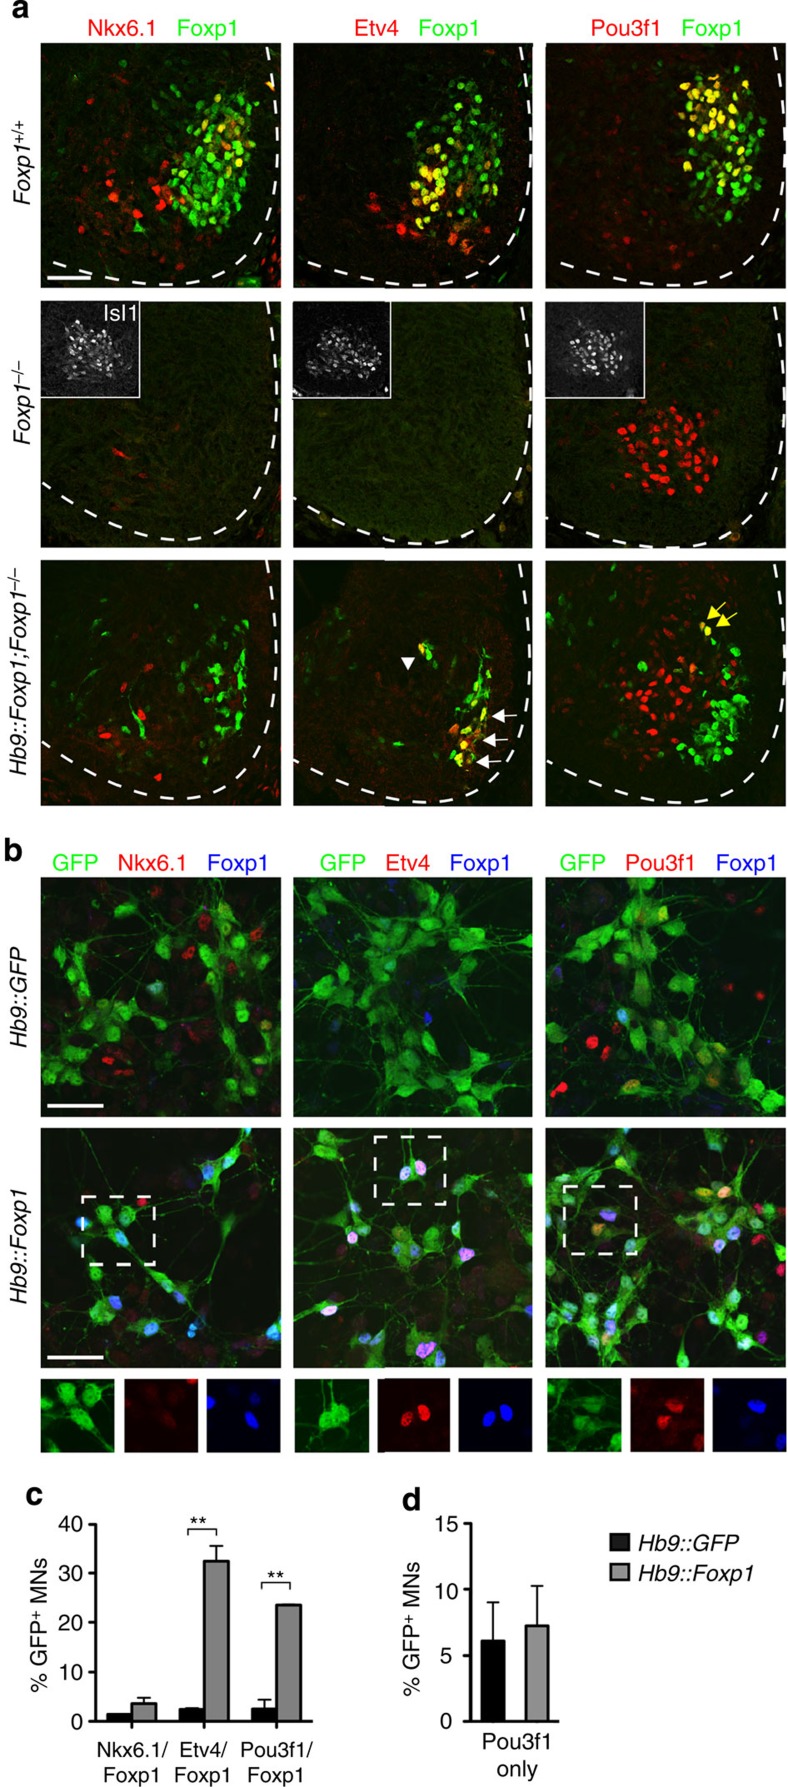
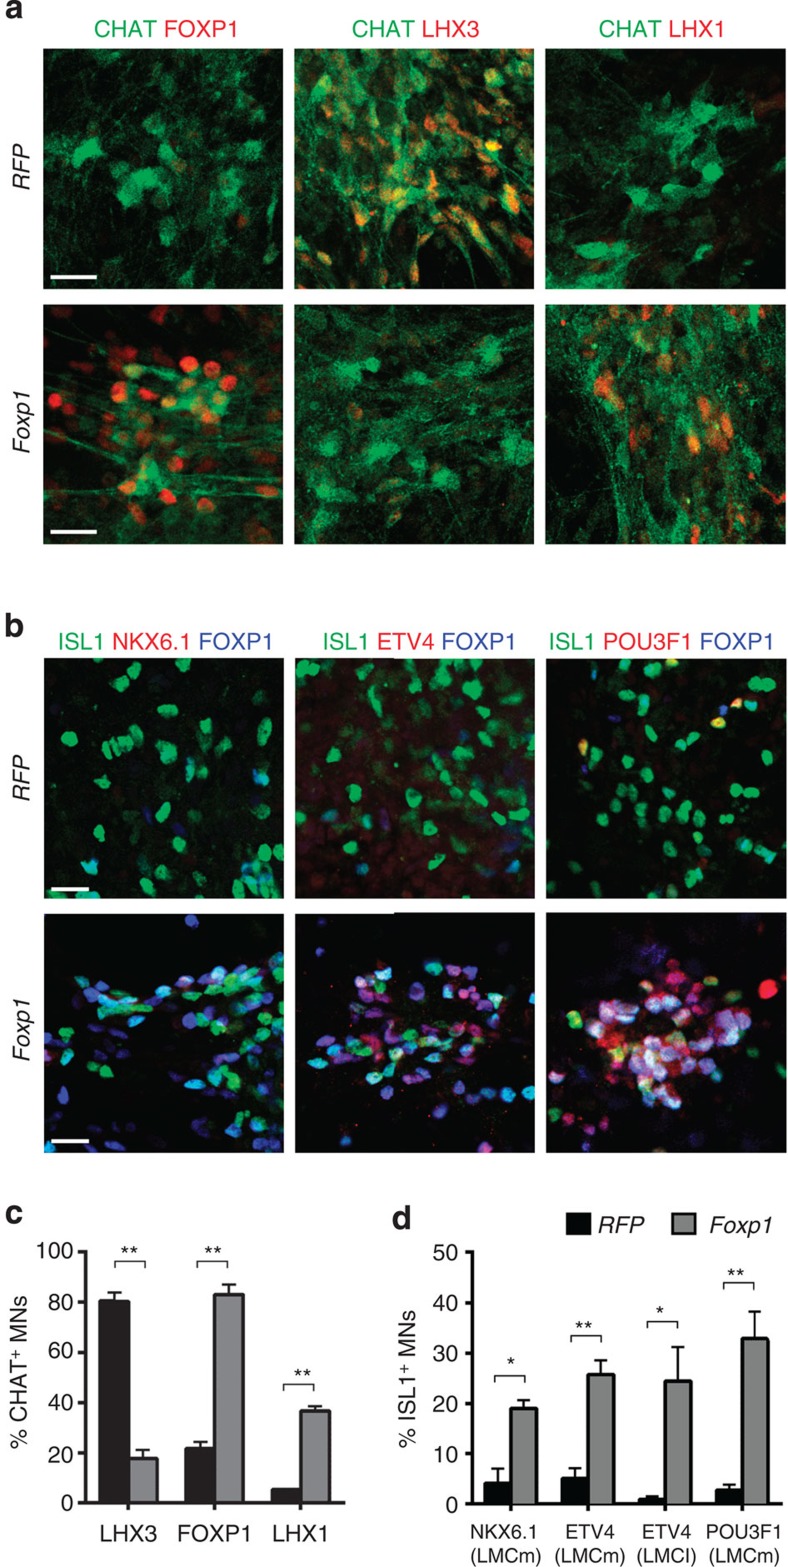
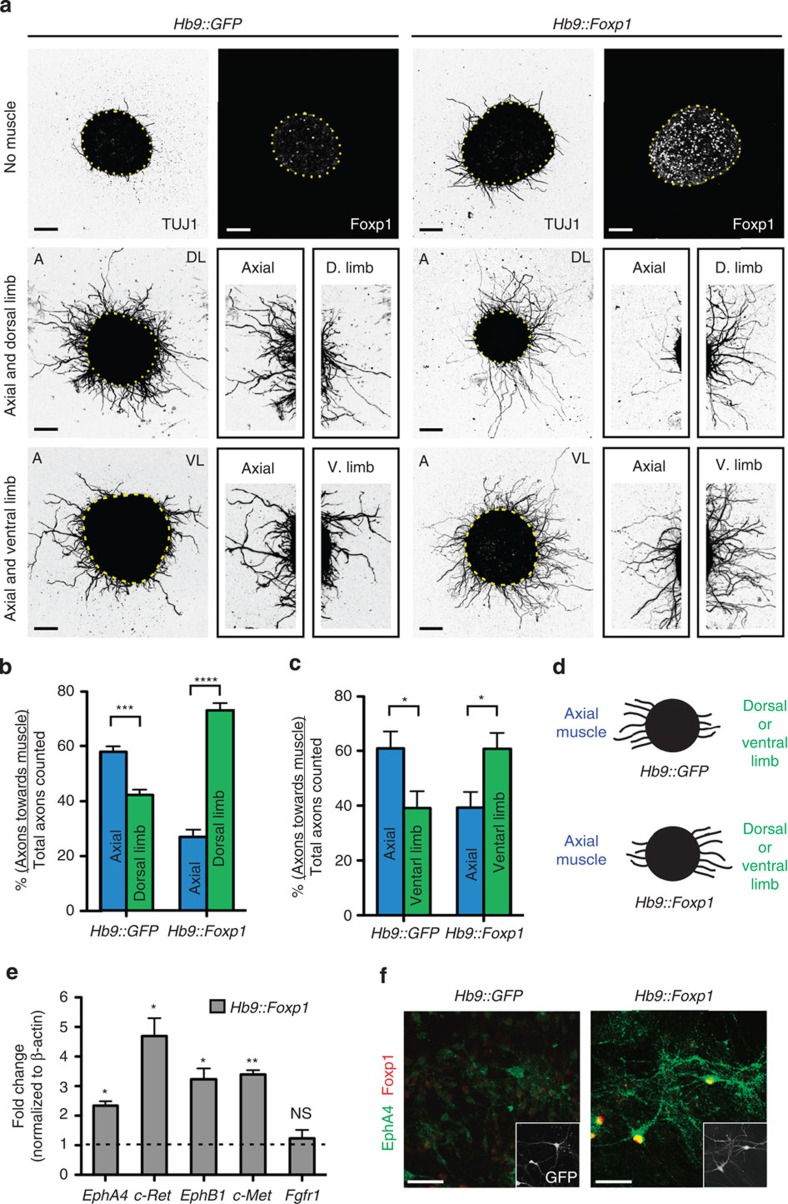
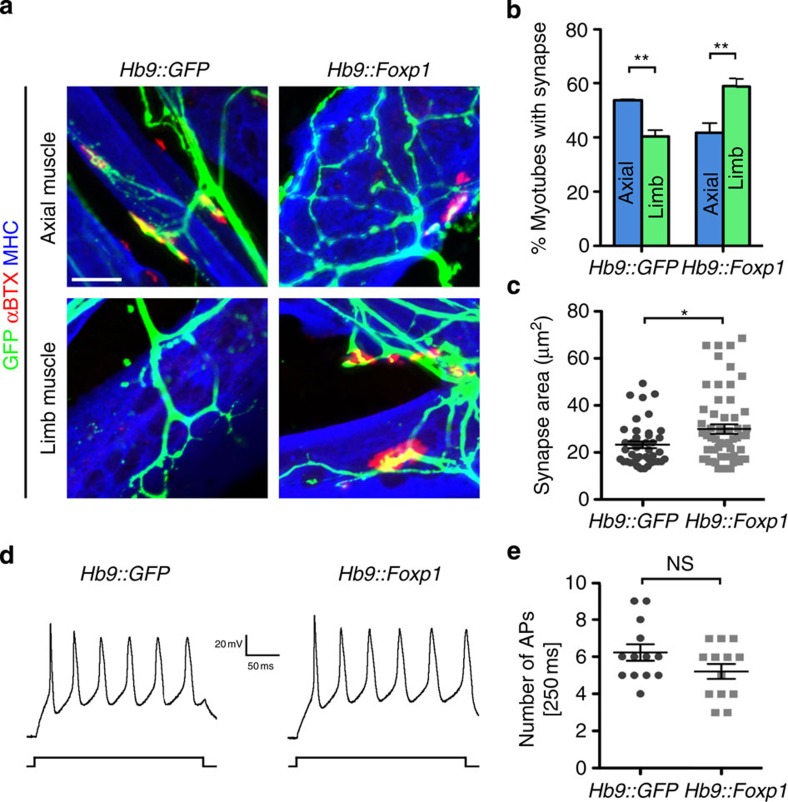
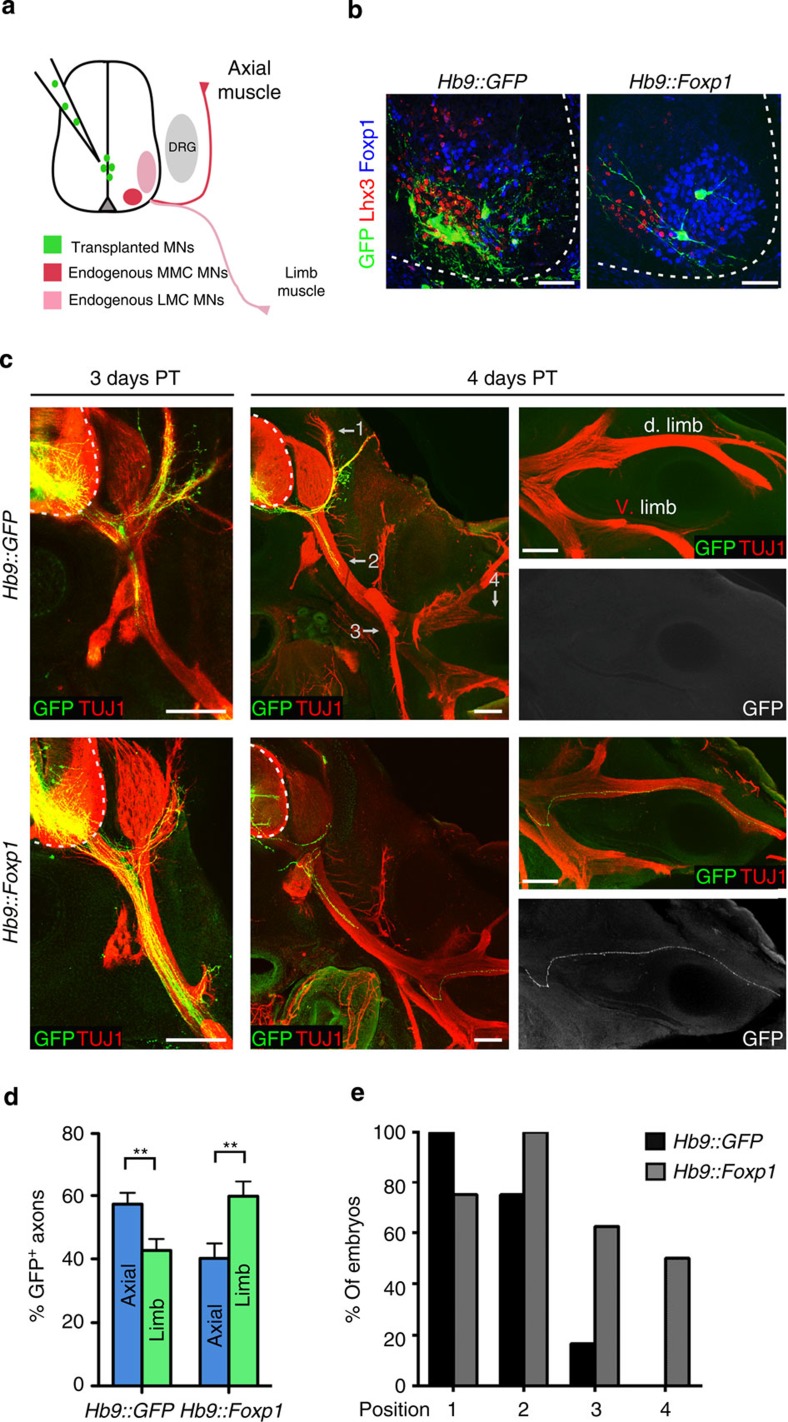
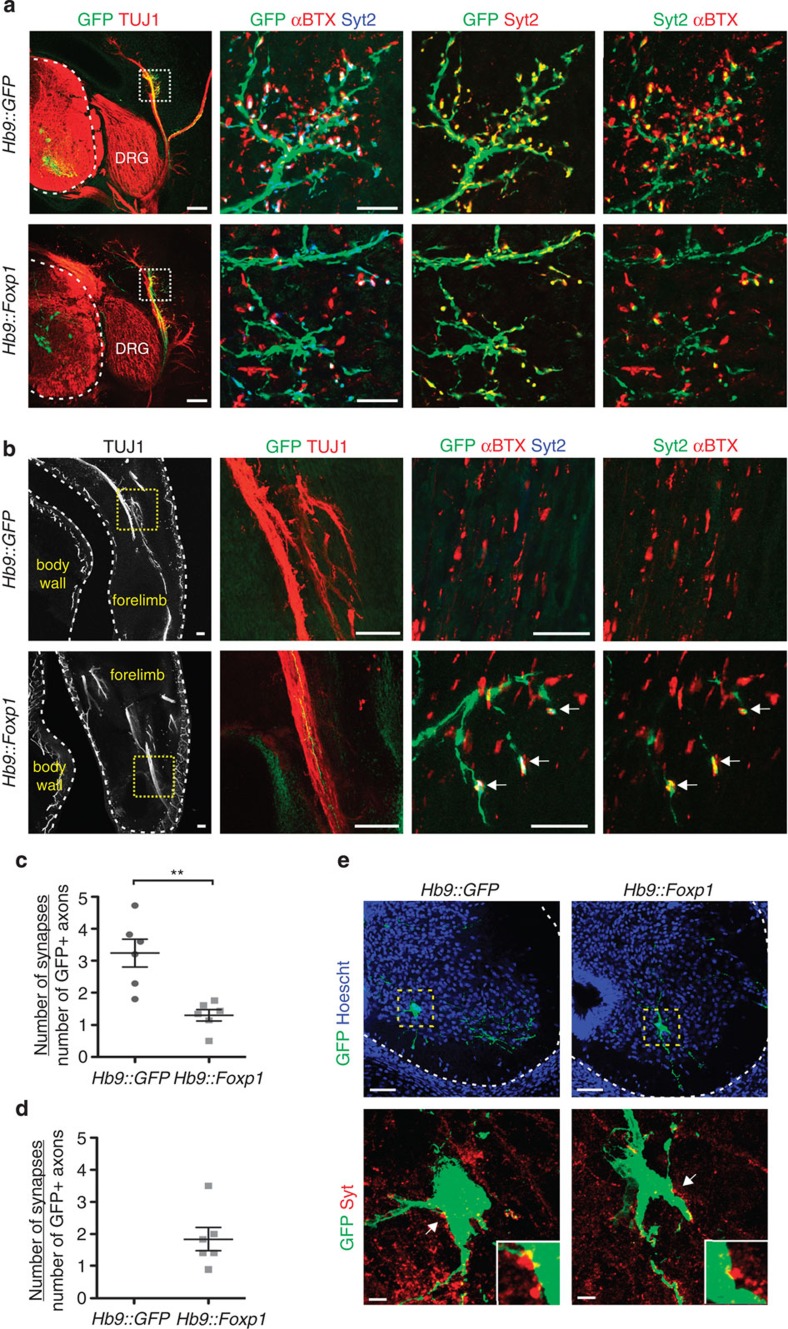
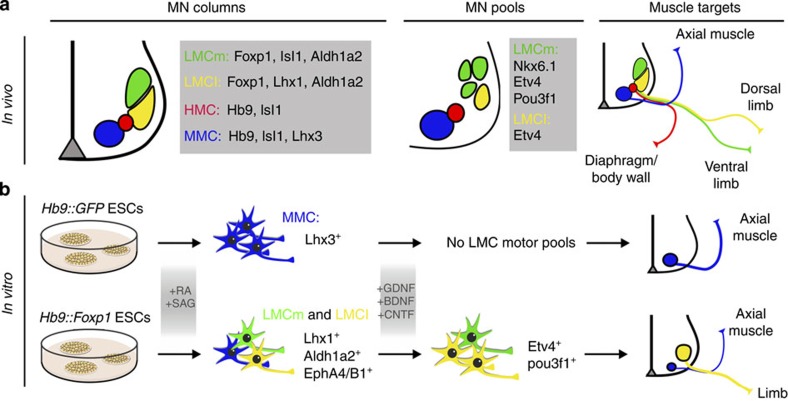
Spinal motor neurons (MNs) control diverse motor tasks including respiration, posture and locomotion that are disrupted by neurodegenerative diseases such as amyotrophic lateral sclerosis and spinal muscular atrophy. Methods directing MN differentiation from stem cells have been developed to enable disease modelling in vitro. However, most protocols produce only a limited subset of endogenous MN subtypes. Here we demonstrate that limb-innervating lateral motor column (LMC) MNs can be efficiently generated from mouse and human embryonic stem cells through manipulation of the transcription factor Foxp1. Foxp1-programmed MNs exhibit features of medial and lateral LMC MNs including expression of specific motor pool markers and axon guidance receptors. Importantly, they preferentially project axons towards limb muscle explants in vitro and distal limb muscles in vivo upon transplantation-hallmarks of bona fide LMC MNs. These results present an effective approach for generating specific MN populations from stem cells for studying MN development and disease.


Figures

Figure 1
Figure 1. Foxp1 misexpression rescues the Foxp1-mutant phenotype.
Analysis of MN subtypes in the ventral horn of E12.5 Foxp+/+, Foxp−/− and Hb9::Foxp1; Foxp1−/− littermate embryo spinal cords. Scale bar, 50 μm. (a) MN subtypes at cervical levels. Foxp1−/− embryos had reduced numbers of LMCm (Isl1+/Foxp1+) and LMCl (Hb9+/Lhx1+) MNs, while HMC (Hb9+/Isl1+) and MMC-rhomboideus (Isl1+/Lhx3low) MNs were expanded compared with Foxp1+/+ embryos. Hb9::Foxp1; Foxp1−/− embryos had partially restored LMCm and LMCl MNs that resided at the correct lateral positions, and reduced numbers of ectopic HMC and MMC-Rb MNs, compared with Foxp1−/− embryos. Rb, rhomboideus. (b) MN subtypes at thoracic levels. The loss of PGC (Isl1+/nNOS+) MNs in Foxp1−/− embryos was rescued in Hb9::Foxp1; Foxp1−/− embryos. (c) Quantification of MN percentages at cervical levels (mean±s.e.m.; n=3 sections averaged per embryo, 3 embryos per genotype; two-way analysis of variance (ANOVA) with Bonferroni adjustment). MMC MNs: ***P<0.0001. HMC MNs: ***P<0.0001 and **P=0.001. LMCm MNs: ***P<0.0001 and **P=0.006. LMCl MNs: ***P<0.0001 and *P=0.01. NS, not significant, P>0.5. (d) Quantification of MN percentages at thoracic levels (mean±s.e.m.; n=3 sections averaged per embryo, 3 embryos per genotype; two-way ANOVA with Bonferroni adjustment). HMC MNs: ***P<0.0001. PGC MNs: ***P<0.0001, **P=0.0001 and *P=0.0023. NS, not significant, P>0.5. (e) Quantification of total number of MNs per section (mean±s.e.m.; n=3 sections averaged per embryo, 3 embryos per genotype; two-way ANOVA with Bonferroni adjustment). NS, not significant. P>0.5.
Figure 2
Figure 2. Hb9::Foxp1 ESCs generate LMCm and LMCl MNs.
(a) Newly derived ESC lines displayed characteristic ESC morphology and expressed pluripotency markers. Both Hb9::GFP and Hb9::Foxp1 ESC lines differentiated into GFP+/Hb9+ MNs, but only Hb9::Foxp1 ESC-derived MNs expressed high levels of Foxp1 protein. Scale bars, 50 μm. (b) Analysis of MN columnar marker expression in ESC-derived MNs. The majority of control Hb9::GFP ESC-derived MNs expressed Lhx3 and low levels of Foxp1, Lhx1 and Aldh1a2. Hb9::Foxp1 ESC-derived MNs expressed reduced levels of Lhx3 and increased levels of LMCm (Isl1+/Foxp1+) and LMCl (Hb9+/Lhx1+) MN markers. Inset shows a single Aldh1a2+ MN. Scale bars, 50 μm. (c) Quantification of MN subtypes generated by each ESC line (mean±s.e.m.; n=3 independent experiments, 373 Hb9::GFP MNs and 403 Hb9::Foxp1 MNs total; Student's t-test). Lhx3: ***P=0.0002. Foxp1: ***P=0.0008. Lhx3/Foxp1: **P=0.002. NS, not significant, P>0.5. (d) Quantification of the percentages of Hb9::Foxp1 ESC-derived Foxp1+ MNs that express markers of LMCm (GFP+/Foxp1+) and LMCl (GFP+/Foxp1+/Lhx1+) MNs (mean±s.e.m.; n=3 independent experiments, 222 Hb9::Foxp1 MNs total). (e) Endogenous Foxp1 mRNA was expressed approximately threefold higher in Hb9::Foxp1 ESC-derived MNs, compared with Hb9::GFP ESC-derived MNs. E11.5 Foxp1+/− and Foxp1−/− purified MNs were used as controls (mean±s.e.m.; n=3 Foxp1+/− embryos, 3 Foxp1−/− embryos, 3 independent RNA collections of Hb9::GFP and Hb9::Foxp1 MNs; one-way analysis of variance with Bonferroni adjustment). ***P=0.001. (f) Aldh1a2 mRNA levels were elevated approximately sixfold higher in Hb9::Foxp1 ESC-derived MNs, compared with Hb9::GFP controls (mean±s.e.m.; n=5 independent RNA collections of Hb9::GFP and Hb9::Foxp1 MNs; paired two-tailed t-test). *P=0.017.
Figure 3
Figure 3. Foxp1 misexpression induces LMC motor pool markers.
(a) Analysis of cervical LMC motor pools in E12.5 Foxp1+/+, Foxp1−/− and Hb9::Foxp1; Foxp1−/− embryos. All LMC motor pools were lost in Foxp1−/− embryos. The Pou3f1+ MNs in Foxp1−/− embryos represent the expanded HMC MN population (identified by their medial position). Insets depict Islet1 co-staining of the same section. The Etv4 motor pool was restored in Hb9::Foxp1; Foxp1−/− embryos (white arrows), with some Foxp1+/Etv4+ MNs located more dorsally (arrowhead). The Nkx6.1 and Pou3f1 motor pools were not restored in Hb9::Foxp1; Foxp1−/− embryos, although a small number of Foxp1+/Pou3f1+ MNs were identified (yellow arrows). Scale bar, 50 μm. (b) Control Hb9::GFP ESC-derived MNs did not express any LMC motor pool markers. Hb9::Foxp1 ESC-derived MNs expressed Etv4 and Pou3f1 at high levels, but did not express Nkx6.1. Boxed regions are depicted as single-colour images below each image. Scale bars, 50 μm. (c) Quantification of motor pool markers in ESC-derived MNs (mean±s.e.m.; n=2 independent experiments, 938 Hb9::GFP MNs and 723 Hb9::Foxp1 MNs total; Student's t-test). Etv4: **P=0.009. Pou3f1: **P=0.008. (d) Foxp1 misexpression did not alter the percentage of Pou3f1+/Foxp1 ESC-derived HMC-like MNs (mean±s.e.m.; n=3 independent experiments, 390 Hb9::GFP MNs and 255 Hb9::Foxp1 MNs total).
Figure 4
Figure 4. FOXP1 promotes LMC MN formation from human ESCs.
(a) Control RFP-transduced human ESC-derived MNs (identified by CHAT expression) expressed high levels of LHX3 and low levels of FOXP1 and LHX1. FOXP1-transduced human ESC-derived MNs expressed increased levels of LHX1 and decreased levels of LHX3. (b) Control RFP-transduced human ESC-derived MNs did not express high levels of known LMC motor pool markers such as ETV4, POU3F1 and NKX6.1. By contrast, many FOXP1-transduced human ESC-derived MNs expressed ETV4 or POU3F1, with a smaller number expressing NKX6.1. (c) Quantification of MN subtype markers in transduced human ESC-derived MNs (mean±s.e.m.; n=2 independent experiments, 700 RFP-transduced MNs and 655 FOXP1-transduced MNs total; Student's t-test). LHX3: **P=0.0055. FOXP1: **P=0.0056. LHX1: **P=0.0035. (d) Quantification of LMC motor pool markers in transduced human ESC-derived MNs (mean±s.e.m.; n=3 independent experiments, 2342 RFP-transduced MNs and 1624 FOXP1-transduced MNs total; Student's t-test). NKX6.1: *P=0.0108. ETV4 (LMCm): **P=0.0042. ETV4 (LMCl): *P=0.0263. POU3F1: **P=0.0053. NKX6.1, ETV4 (LMCm) and POU3F1 motor pools were identified by co-localization of ISL1, FOXP1 and the respective motor pool marker. The ETV4 (LMCl) motor pool was identified by co-localization of FOXP1 and ETV4.
Figure 5
Figure 5. Hb9::Foxp1 MNs project axons towards limb muscle explants in vitro.
(a) Three-dimensional collagen cultures of EBs and different chick muscle explants. Hb9::GFP EBs projected more axons towards axial muscle than dorsal or ventral limb muscle. Hb9::Foxp1 EBs projected more axons towards dorsal and ventral limb muscle than axial muscle explants. Scale bars, 100 μm. ‘A'=axial muscle. ‘DL' and ‘D. limb'=dorsal limb muscle. ‘VL' and ‘V. limb'=ventral limb muscle. (b) Quantification of Hb9::GFP and Hb9::Foxp1 axon projections when cultured between axial and dorsal limb explants (mean±s.e.m.; n=5 cultures per cell line; Student's t-test). ***P=0.0005. ****P<0.0001. (c) Quantification of Hb9::GFP and Hb9::Foxp1 axon projections when cultured between axial and ventral limb explants (mean±s.e.m.; n=5 cultures per cell line; Student's t-test). *P=0.0465 for Hb9::GFP and *P=0.0386 for Hb9::Foxp1. (d) Schematic summary of muscle explant results. (e) Hb9::Foxp1 ESC-derived MNs expressed increased levels of EphA4, c-Ret, EphB1 and c-Met mRNA, compared with Hb9::GFP ESC-derived MNs. There was no change in Fgfr1 expression (mean±s.e.m.; n=3 independent RNA collections of Hb9::GFP and Hb9::Foxp1 MNs; paired two-tailed t-test). *P=0.0115 for EphA4, *P=0.0264 for EphB1, *P=0.0258 for c-Ret, **P=0.0037 for c-Met. NS, not significant, P>0.5. (f) Hb9::Foxp1 ESC-derived MNs expressed higher levels of EphA4 compared with control Hb9::GFP ESC-derived MNs. Insets depict GFP staining of ESC-derived MNs. Scale bars, 50 μm.
Figure 6
Figure 6. Hb9::Foxp1 MNs preferentially form synapses with limb muscles.
(a) Hb9::GFP MNs formed neuromuscular junctions (GFP+/αBTX+) with axial myotubes more frequently than with limb myotubes. By contrast, Hb9::Foxp1 MNs formed synapses with limb-derived myotubes more frequently than with axial myotubes. Scale bar, 20 μm. (b) Quantification of the frequency of synapse formation with primary myotubes in vitro. The percentage of myotubes with GFP+/αBTX+ synapses over the total number of myotubes with GFP+ axon contacts was calculated for each cell line/muscle pairing (mean±s.e.m.; n=3 independent experiments, 20 images per experiment; Student's t-test). **P=0.0046 for Hb9::GFP and **P=0.0081 for Hb9::Foxp1. (c) Hb9::Foxp1 MNs formed significantly larger neuromuscular junctions with limb muscle than Hb9::GFP MNs, as determined by measuring the area of GFP+/αBTX+ synapses (mean±s.e.m.; n=5 images per cell line, 117 total synapses; Student's t-test). *P=0.0143. (d) Representative recordings of Hb9::GFP and Hb9::Foxp1 ESC-derived MNs. Both cell types responded to a +0.1 nA long duration (250 ms) current pulse with multiple action potentials. (e) Quantification of the number of action potentials (APs) fired by ESC-derived MNs during a +0.1 nA, 250 ms current pulse (mean±s.e.m.; n=13 cells per cell line; Student's t-test). NS, not significant, P>0.5.
Figure 7
Figure 7. Hb9::Foxp1 MNs innervate distal limb muscles in vivo.
(a) Transplantation scheme. DRG, dorsal root ganglion. (b) Transverse sections of the ventral horn chick spinal cords showing GFP+ transplanted MNs. Hb9::GFP MNs settled at a medial position associated with endogenous Lhx3+ MMC MNs. Hb9::Foxp1 MNs settled at lateral positions associated with endogenous Foxp1+ LMC MNs. Scale bars, 50 μm. (c) Transverse vibratome sections of transplantations. Hb9::GFP ESC-derived MNs projected axons towards dorsal axial muscles both 3 and 4 days post transplantation (PT). Hb9::GFP axons that projected laterally did not extend into the limb. The majority of Hb9::Foxp1 ESC-derived MNs projected axons laterally towards the limbs 3 days PT and limb projections were maintained at 4 days PT. ‘d. limb'=dorsal limb. ‘v. limb'=ventral limb. ‘DRG'=dorsal root ganglion. Scale bars, 200 μm. (d) Quantification of the percentage of transplanted GFP+ MN axons that projected towards axial and limb muscles at 3 days PT (mean±s.e.m.; n=10 transplants per cell line; Student's t-test). **P=0.008. (e) Quantification of transplanted GFP+ axons at 4 days PT. Graph shows the percentage of chick embryos that had GFP+ axons at positions 1–4. Position 1=axial muscle. Position 2=halfway to brachial plexus. Position 3=brachial plexus. Position 4=distal limb (these are marked in c). n=8 transplants per cell line.
Figure 8
Figure 8. Transplanted ESC-derived MNs form synapses with correct muscles.
Analysis of synapse formation 5 days after transplantation of Hb9::GFP and Hb9::Foxp1 ESC-derived MNs. Scale bars, 100 μm for TUJ1 images and 20 μm for αBTX images. (a) Transplanted GFP+ axons innervating axial muscle. Hb9::GFP axons co-localized with a high density of presynaptic (mouse specific Synaptotagmin 2 (Syt2)) and postsynaptic (αBTX) markers. Hb9::Foxp1 axons displayed fewer synaptic boutons. Boxes represent the areas imaged for synapse markers. DRG, dorsal root ganglion. (b) Transplanted GFP+ axons innervating limb muscle. Hb9::GFP ESC-derived MNs did not innervate and form synapses with limb muscle. Hb9::Foxp1 axons in the distal limb co-localized with Synaptotagmin 2 and αBTX (arrows). Yellow boxes represent the areas shown in GFP/TUJ1 images where GFP+ axons were analysed for synapse markers. (c) Quantification of the number of synapses formed by each cell line with axial muscle in vivo (mean±s.e.m.; n=6 images per cell line; Student's t-test). **P=0.002. (d) Quantification of the number of synapses formed by each cell line with limb muscles in vivo (mean±s.e.m.; n=6 images per cell line; Student's t-test). Hb9::GFP control cells showed no synapses in this assay. (e) Transplanted ESC-derived MNs in the ventral horns of chick spinal cords (outlined in boxes) had bright Synaptotagmin (Syt)+ punctae surrounding their cell body and dendrites. Scale bars, 50 μm in top row and 5 μm in bottom row. Arrows point to regions shown in insets.
Figure 9
Figure 9. Summary of spinal MN diversity in vivo and from ESCs.
(a) At cervical levels in the developing spinal cord, MNs are segregated into different columns that express different transcription factors and proteins. These columns are further organized into motor pools, or groups of MNs that innervate the same muscle. These different MN subtypes innervate and form synapses with distinct muscles. (b) Under standard differentiation conditions with retinoic acid (RA) and smoothened agonist (SAG), the majority of control Hb9::GFP ESC-derived MNs expressed Lhx3—a marker of MMC MNs, and did not express markers of LMC MNs. Hb9::GFP ESC-derived MNs preferentially projected axons towards and formed synapses with axial muscle both in vitro and in vivo. Conversely, Foxp1 misexpression resulted in large numbers of bona fide LMC MNs that expressed multiple LMCm and LMCl molecular markers and preferentially innervated and formed synapses with limb muscle both in vitro and in vivo.

Similar articles

Cited by

References

    1. Faravelli I. et al.. Motor neuron derivation from human embryonic and induced pluripotent stem cells: experimental approaches and clinical perspectives. Stem Cell Res. Ther. 5, 87 (2014) . - PMC - PubMed
    1. Frattini E. et al.. Pluripotent stem cell-based models of spinal muscular atrophy. Mol. Cell. Neurosci. 64C, 44–50 (2014) . - PubMed
    1. Richard J. P. & Maragakis N. J. Induced pluripotent stem cells from ALS patients for disease modelling. Brain Res doi: 10.1016/j.brainres.2014.09.017 (2014) . - PMC - PubMed
    1. Sandoe J. & Eggan K. Opportunities and challenges of pluripotent stem cell neurodegenerative disease models. Nat. Neurosci. 16, 780–789 (2013) . - PubMed
    1. Winner B., Marchetto M. C., Winkler J. & Gage F. H. Human-induced pluripotent stem cells pave the road for a better understanding of motor neuron disease. Hum. Mol. Genet. 23, R27–R34 (2014) . - PubMed

Publication types

MeSH terms

LinkOut - more resources