. 2015 May 29;290(22):13992-4003.
doi: 10.1074/jbc.M114.625343. Epub 2015 Apr 13.

Mechanism of the Association between Na+ Binding and Conformations at the Intracellular Gate in Neurotransmitter:Sodium Symporters

Affiliations

Mechanism of the Association between Na+ Binding and Conformations at the Intracellular Gate in Neurotransmitter:Sodium Symporters

Sebastian Stolzenberg et al. J Biol Chem. .

Abstract

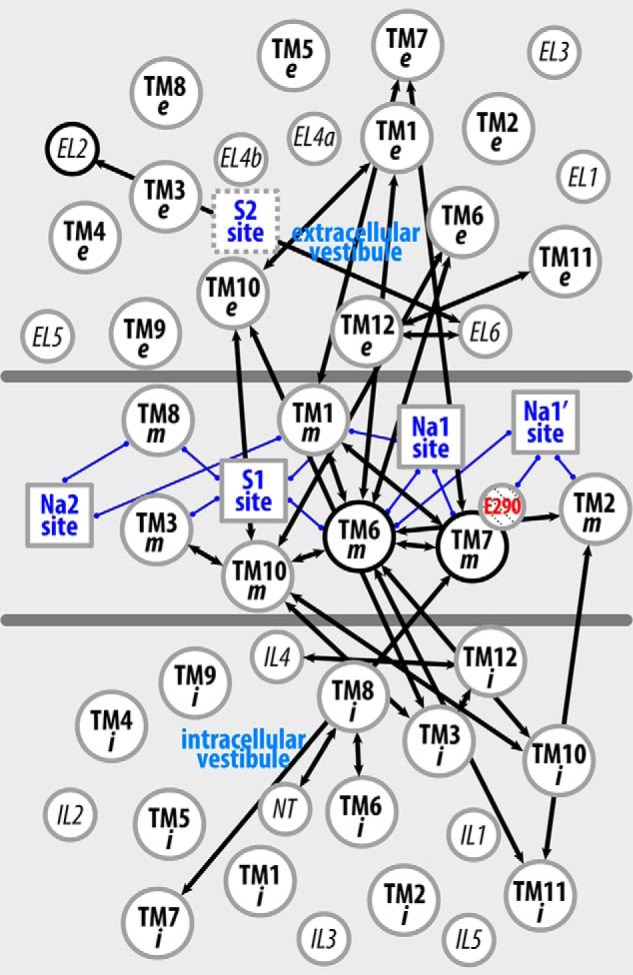
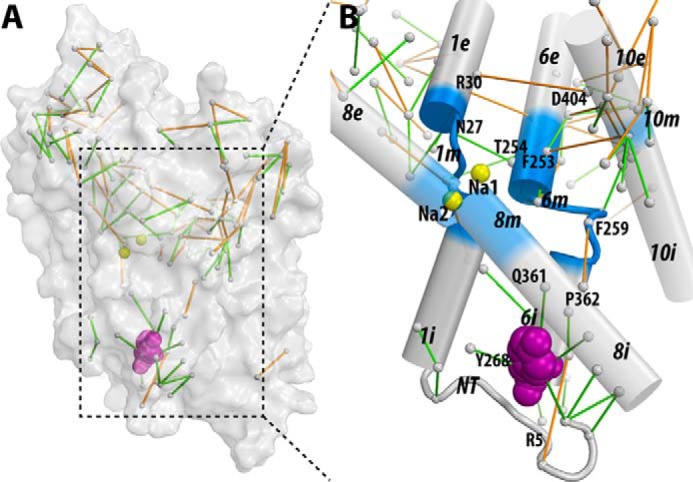
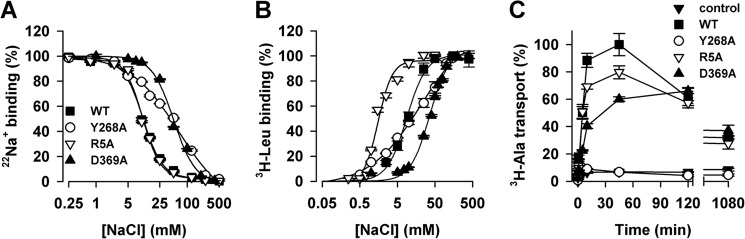
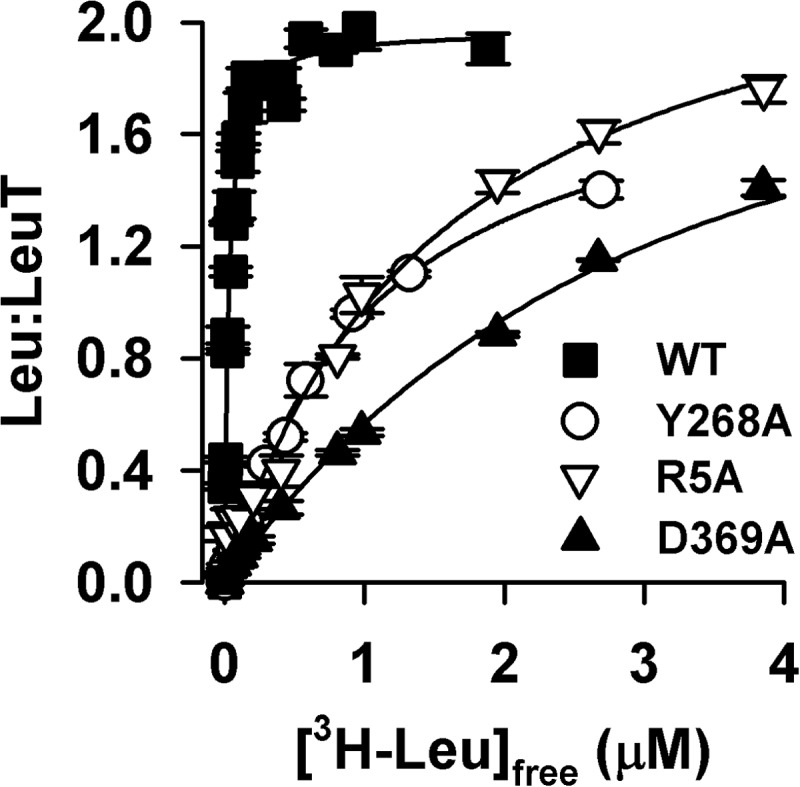
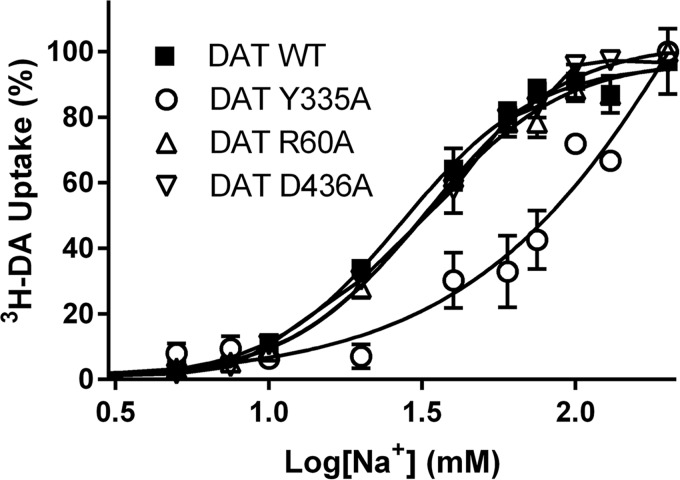
Neurotransmitter:sodium symporters (NSSs) terminate neurotransmission by Na(+)-dependent reuptake of released neurotransmitters. Previous studies suggested that Na(+)-binding reconfigures dynamically coupled structural elements in an allosteric interaction network (AIN) responsible for function-related conformational changes, but the intramolecular pathway of this mechanism has remained uncharted. We describe a new approach for the modeling and analysis of intramolecular dynamics in the bacterial NSS homolog LeuT. From microsecond-scale molecular dynamics simulations and cognate experimental verifications in both LeuT and human dopamine transporter (hDAT), we apply the novel method to identify the composition and the dynamic properties of their conserved AIN. In LeuT, two different perturbations disrupting Na(+) binding and transport (i.e. replacing Na(+) with Li(+) or the Y268A mutation at the intracellular gate) affect the AIN in strikingly similar ways. In contrast, other mutations that affect the intracellular gate (i.e. R5A and D369A) do not significantly impair Na(+) cooperativity and transport. Our analysis shows these perturbations to have much lesser effects on the AIN, underscoring the sensitivity of this novel method to the mechanistic nature of the perturbation. Notably, this set of observations holds as well for hDAT, where the aligned Y335A, R60A, and D436A mutations also produce different impacts on Na(+) dependence. Thus, the detailed AIN generated from our method is shown to connect Na(+) binding with global conformational changes that are critical for the transport mechanism. That the AIN between the Na(+) binding sites and the intracellular gate in bacterial LeuT resembles that in eukaryotic hDAT highlights the conservation of allosteric pathways underlying NSS function.

Keywords: allosteric regulation; dopamine transporter; metal ion-protein interaction; molecular dynamics; neurotransmitter transport; potential of mean force calculation.


Figures

FIGURE 1.
FIGURE 1.
The volume of the EV changes in response to the substrate, ions, and/or Y268A, D369A, or R5A mutations. EV volumes are expressed by the number of water molecules contained in the EV. Normalized distributions are calculated for all of the frames from all of the trajectories for each indicated condition.
FIGURE 2.
FIGURE 2.
Characteristic features of the Na1 and Na1′ binding sites. A and B, Na+ binding in the Na1 site (A) and in the Na1′ site (B) in the absence of substrate. The residues forming the binding sites are shown as sticks, and the bound Na+ are represented by yellow spheres. C, time traces of the binding position of cation (Na+ or Li+) near Na1 and Na1′ sites in each trajectory. Trajectory segments are colored according to the distance between the cation near Na1/Na1′ sites and that bound in the Na2 site. This distance allows us to determine if Na+ is bound in the Na1 site (< 8.3 Å; orange), in transition (>8.3 and <10.7 Å; cyan), or in the Na1′ state (>10.5 Å; purple). As a reference, the distance between the Na1 and Na2 in the crystal structure of LeuT (PDB code 2A65) is 7.0 Å.
FIGURE 3.
FIGURE 3.
The Na1′ is a stable Na+ binding site in the simulated Y268A.Na.ns condition. PMF computations for a cation positioned along the membrane normal (z) indicate the relative energetics of binding in the Na1 site (at z = ∼0 Å) versus in the Na1′ site (at z = ∼4 Å). PMF profiles are colored differently for different trajectories, as indicated. Each PMF was started from a representative snapshot (see “Experimental Procedures”) with minimum average root mean square deviation from any other conformation in the equilibrated stages of a trajectory. The bars represent the error estimated from seven blocks in block-averaging of data from independent PMF computations. Error analysis was performed with a Monte Carlo routine with bootstrapping. Note that the PMF results for WT.Na.Leu and WT.Na.ns are from Ref. .
FIGURE 4.
FIGURE 4.
Coarse-grained mapping of the altered interactions in selected conditions on a two-dimensional representation of LeuT structure. By dividing the LeuT structure into extracellular, middle (blue), and intracellular portions, as shown in A, the TMs are divided into “e”, “m”, and “i” subsegments (see “Experimental Procedures”) in B–F to achieve a two-dimensional representation of the interaction network. In this network, subsegments are represented as circles with their relative positions in each region essentially retaining those in the three-dimensional structure; functional sites are indicated by squares and are connected to the subsegments that form these sites with blue edges; the negatively charged Glu290 is highlighted in red. An arrow is drawn between two subsegments if any of the residue pairs in these subsegments exhibits significant differences in the interaction frequencies in the equilibrated stages of WT.Na.Leu (B), R5A.Na.ns (C), D369A.Na.ns (D), Y268A.Na.ns (E), and WT.Li.ns (F), with respect to the reference condition WT.Na.ns. The arrows are colored in orange if the interactions are significantly more frequent in the investigated condition than in the reference WT.Na.ns, in green if the interactions are less frequent, and in black if the subsegment pair involves both types (orange and green) of interactions.
FIGURE 5.
FIGURE 5.
Li+ substitution and the Y268A mutation produce a similar pattern of perturbation of the interaction network across the TM domain. The two-dimensional representation of LeuT structure is as shown in Fig. 4. A black arrow is drawn between two subsegments if any of the residue pairs in these subsegments exhibits significant differences in the interaction frequencies (either larger or smaller) in the equilibrated stages of both Y268A.Na.ns and WT.Li.ns compared with the reference WT.Na.ns.
FIGURE 6.
FIGURE 6.
The interaction network that propagates the impact of the Y268A mutation from the intracellular gate to the substrate and Na+ binding sites. The pairwise residue interactions that are significantly more frequent in Y268A.Na.ns or WT.Na.ns are identified by orange or green lines, respectively. B, enlarged view of the marked area in A. Note that the pairwise residue interactions that were also affected by the R5A mutation (comparing R5A.Na.ns to WT.Na.ns) are probably less important for Na+-coupled transport and are not shown.
FIGURE 7.
FIGURE 7.
Experimental measures of the interaction of Na+ with LeuT: effects of the perturbations. A, the binding of 1.92 μm [22Na]Cl by 0.8 pmol of LeuT-WT, LeuT-Y268A, LeuT-R5A, or LeuT-D369A was measured with 0–500 mm unlabeled NaCl in the absence of Leu. Data were normalized with respect to the maximum binding observed for each LeuT variant in the absence of non-labeled NaCl. Fitting of the isotopic 22Na+ replacement yielded an EC50 of 10.6 ± 0.5, 64.4 ± 17.2, 10.8 ± 0.6, and 49.9 ± 4.2 mm for LeuT-WT, -Y268A, -R5A, and -D369A, respectively, with Hill coefficients of 2.0 ± 0.2, 0.8 ± 0.1, 2.0 ± 0.2, and 1.8 ± 0.3. B, specific binding of [3H]Leu to LeuT-WT, -Y268A, -R5A, and -D369A was assayed in the presence of increasing NaCl concentrations. [3H]Leu concentrations were chosen to correspond to the Kd (see Fig. 8) and were 25 nm for LeuT-WT, 1 μm for LeuT-R5A and -Y268A, and 2 μm for LeuT-D369A. Fitting the data to the Hill equation revealed an EC50 of 8.9 ± 0.6, 12.3 ± 1.3, 1.5 ± 0.2, and 36.2 ± 2.1 mm with a Hill coefficient of 1.7 ± 0.2, 0.9 ± 0.1, 2.1 ± 0.1, and 1.7 ± 0.1 for LeuT-WT, -Y268A, -R5A, and -D369A, respectively. C, time course of 1 μm [3H]Ala uptake in proteoliposomes containing LeuT-WT (■), LeuT-Y268A (○), LeuT-R5A (▿), or LeuT-D369A (▴) and control liposomes lacking LeuT (▾) measured in the presence of 150 mm NaCl. Panels show representative experiments (n ≥ 2) performed in parallel; data points represent the mean ± S.E. of triplicate determinations. Kinetic constants were determined from the shown experiments with appropriate algorithms in GraphPad Prism version 5.01 or in Systat Software SigmaPlot version 10.0 and expressed as the mean ± S.E. of the fits.
FIGURE 8.
FIGURE 8.
Leu binding kinetics. Equilibrium binding of [3H]Leu (9 Ci/mmol) was performed by means of the scintillation proximity assay with 0.8 pmol of LeuT-WT (■), -Y268A (○), -R5A (▿), or -D369A (▴) in the presence of increasing concentrations of [3H]Leu in buffer composed of 50 mm Tris/Mes, pH 7.5, 150 mm NaCl, 20% glycerol, 1 mm tris(2-carboxyethyl)phosphine, and 0.1% (w/v) n-dodecyl-β,d-maltopyranoside (DDM). Fitting the data to a one-site, specific binding model yielded stoichiometries of 1.97 ± 0.03, 2.0 ± 0.1, 2.1 ± 0.1, and 1.82 ± 0.1 for LeuT-WT, -Y268A, -R5A, and -D369A, respectively, with a Kd of 28.5 ± 2.2 nm, 1,082 ± 78.0 nm, 1,084 ± 171.2, and 2,128 ± 209.0 nm. Data (shown as mean ± S.E. of triplicate determinations) are from a representative experiment (n ≥ 2) performed in parallel. Kinetic constants were determined using a single-site fitting model in GraphPad Prism version 5.01 and are expressed as the mean ± S.E. of the fits.
FIGURE 9.
FIGURE 9.
Na+-dependent [3H]DA uptake by DAT-WT and the DAT-R60A, DAT-Y335A, and DAT-D436A mutants. [3H]DA uptake by DAT-WT (■) is increased with increasing [Na+] and reaches saturation with an EC50 = 27 ± 2 mm Na+ and a Hill slope of 2.0 ± 0.23 (n = 6). [3H]DA uptake by DAT-R60A (▵) and DAT-D436A (▿) exhibits Na+ dependence indistinguishable from WT traces (n = 7 and 3, respectively). The uptake by DAT-Y335A (○) also increases with increasing [Na+] but does not saturate within the range of tested Na+ concentrations (n = 4). To obtain a constant ionic strength in the uptake buffer, the NaCl is titrated against choline chloride. Data are means ± S.E. (error bars) of experiments performed in triplicate on COS7 cells transiently expressing DAT-WT or the indicated mutations herein and normalized to their respective uptake in 200 mm Na+. Kinetic constants were determined using a single-site fitting model in GraphPad Prism version 5.0.

References

    1. Krishnamurthy H., Piscitelli C. L., Gouaux E. (2009) Unlocking the molecular secrets of sodium-coupled transporters. Nature 459, 347–355 - PMC - PubMed
    1. Shi L., Quick M., Zhao Y., Weinstein H., Javitch J. A. (2008) The mechanism of a neurotransmitter:sodium symporter: inward release of Na+ and substrate is triggered by substrate in a second binding site. Mol. Cell 30, 667–677 - PMC - PubMed
    1. Forrest L. R., Zhang Y. W., Jacobs M. T., Gesmonde J., Xie L., Honig B. H., Rudnick G. (2008) Mechanism for alternating access in neurotransmitter transporters. Proc. Natl. Acad. Sci. U.S.A. 105, 10338–10343 - PMC - PubMed
    1. Celik L., Schiøtt B., Tajkhorshid E. (2008) Substrate binding and formation of an occluded state in the leucine transporter. Biophys. J. 94, 1600–1612 - PMC - PubMed
    1. Cheng M. H., Bahar I. (2013) Coupled global and local changes direct substrate translocation by neurotransmitter-sodium symporter ortholog LeuT. Biophys. J. 105, 630–639 - PMC - PubMed

Publication types

LinkOut - more resources