. 2015 May 29;290(22):13678-91.
doi: 10.1074/jbc.M114.622415. Epub 2015 Apr 13.

Tricyclic Antidepressant Amitriptyline-induced Glial Cell Line-derived Neurotrophic Factor Production Involves Pertussis Toxin-sensitive Gαi/o Activation in Astroglial Cells

Affiliations

Tricyclic Antidepressant Amitriptyline-induced Glial Cell Line-derived Neurotrophic Factor Production Involves Pertussis Toxin-sensitive Gαi/o Activation in Astroglial Cells

Kazue Hisaoka-Nakashima et al. J Biol Chem. .

Abstract

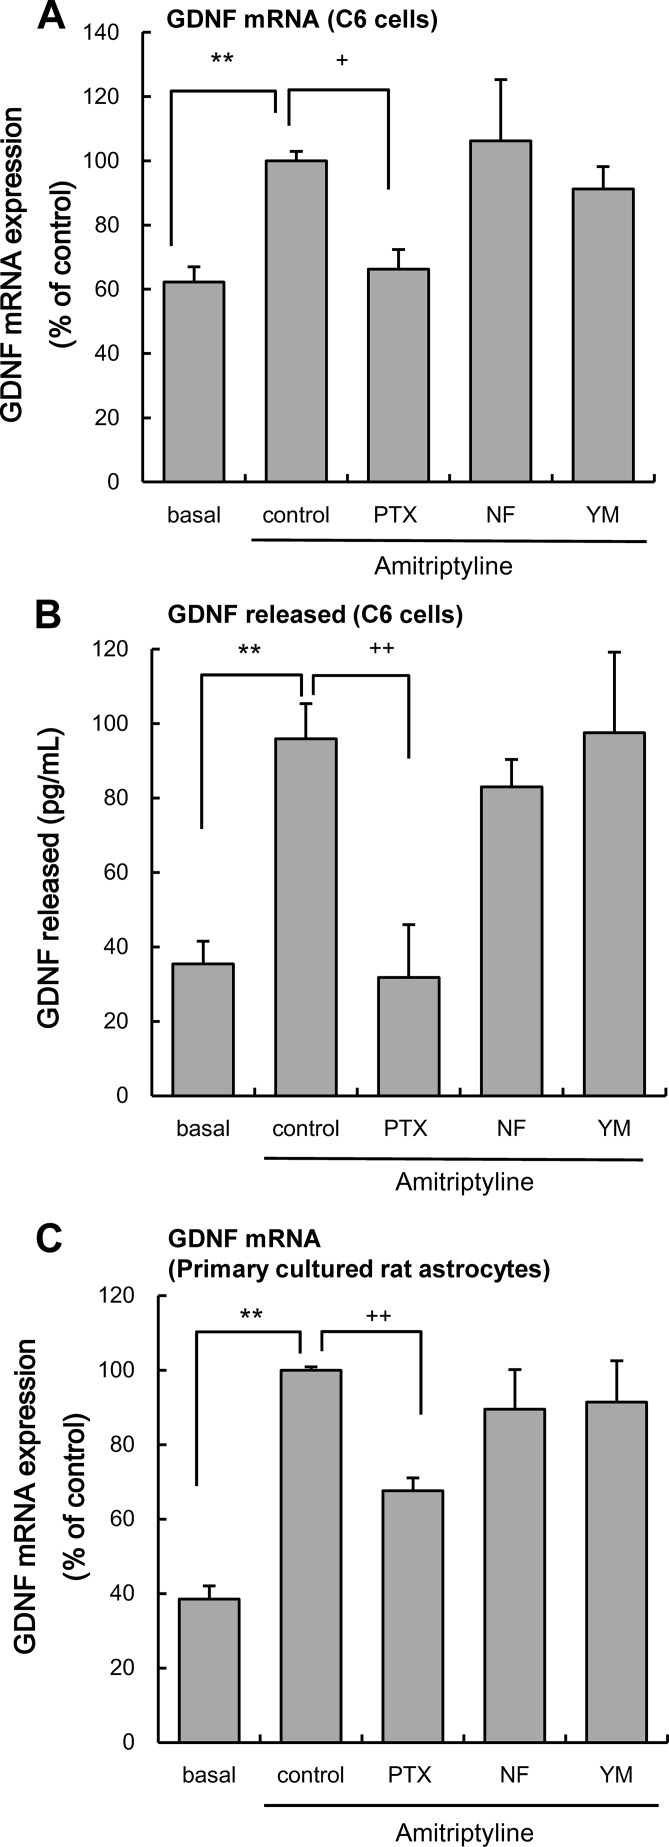
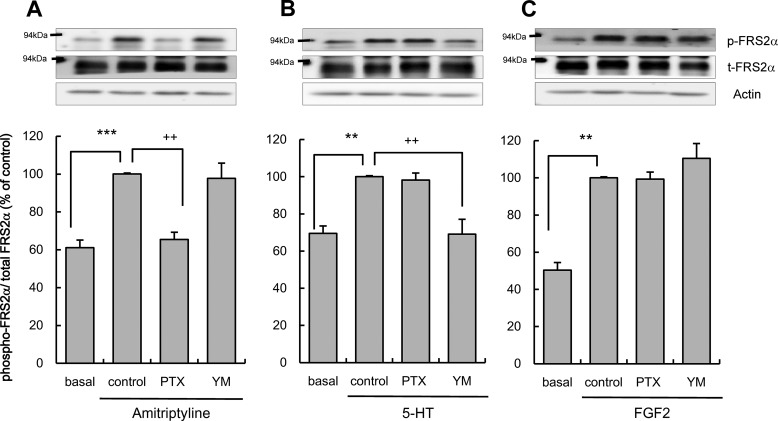
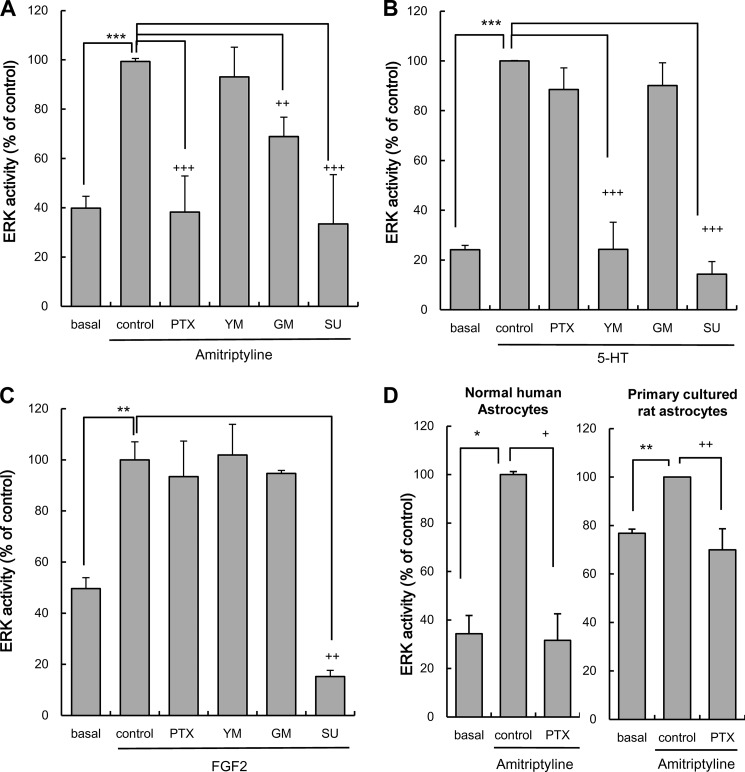
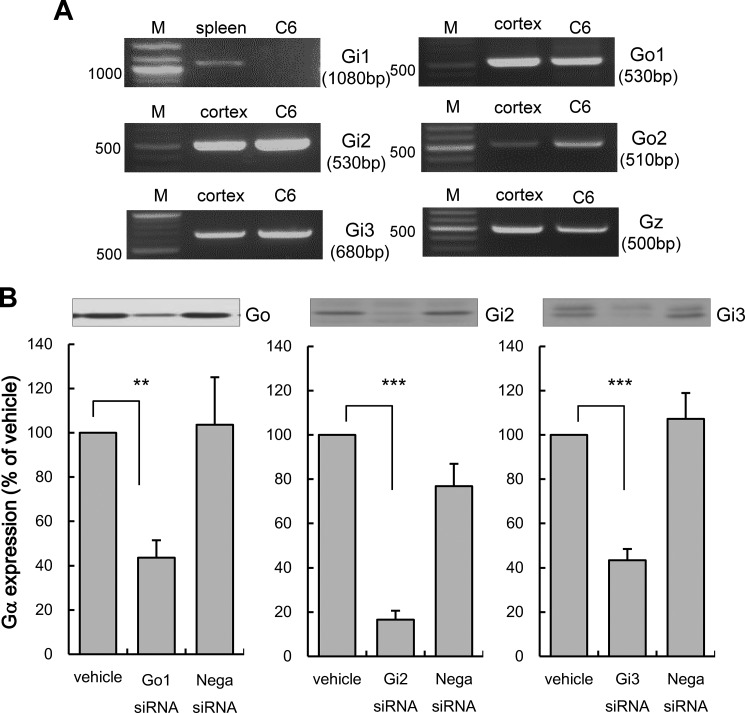
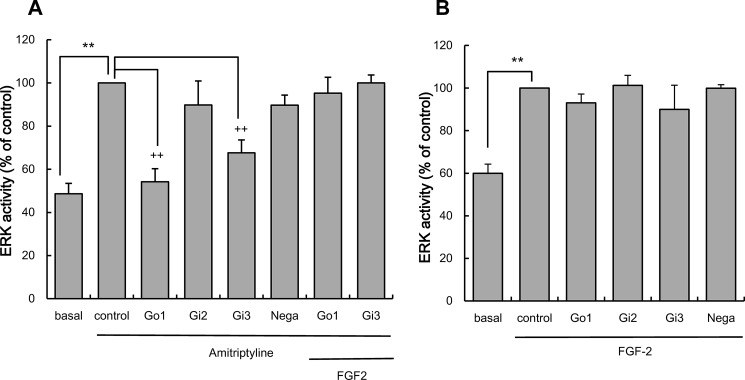
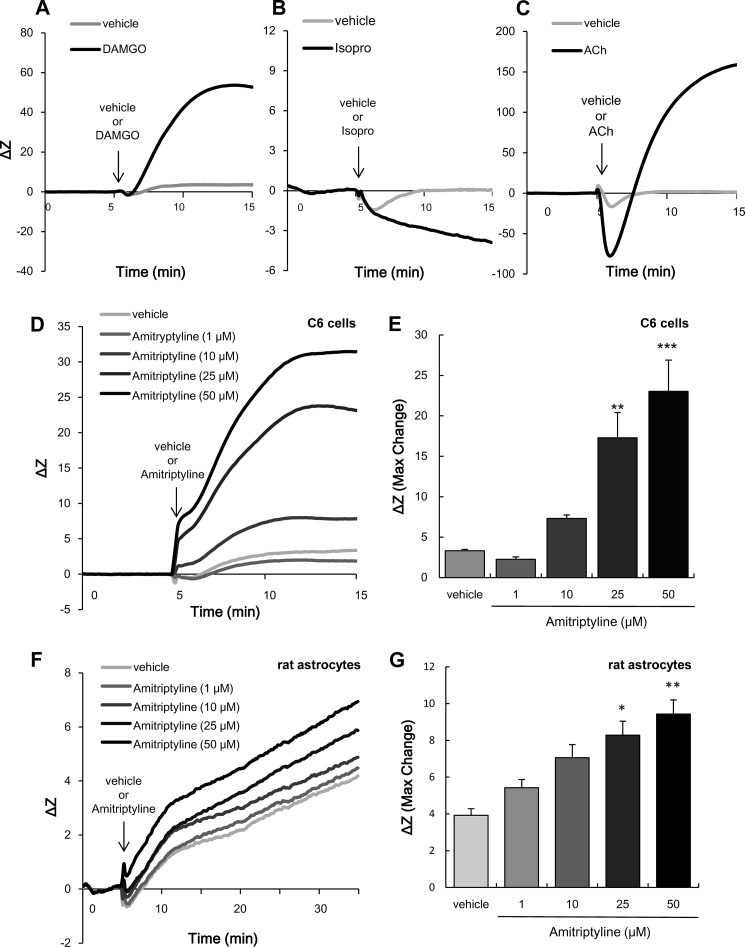
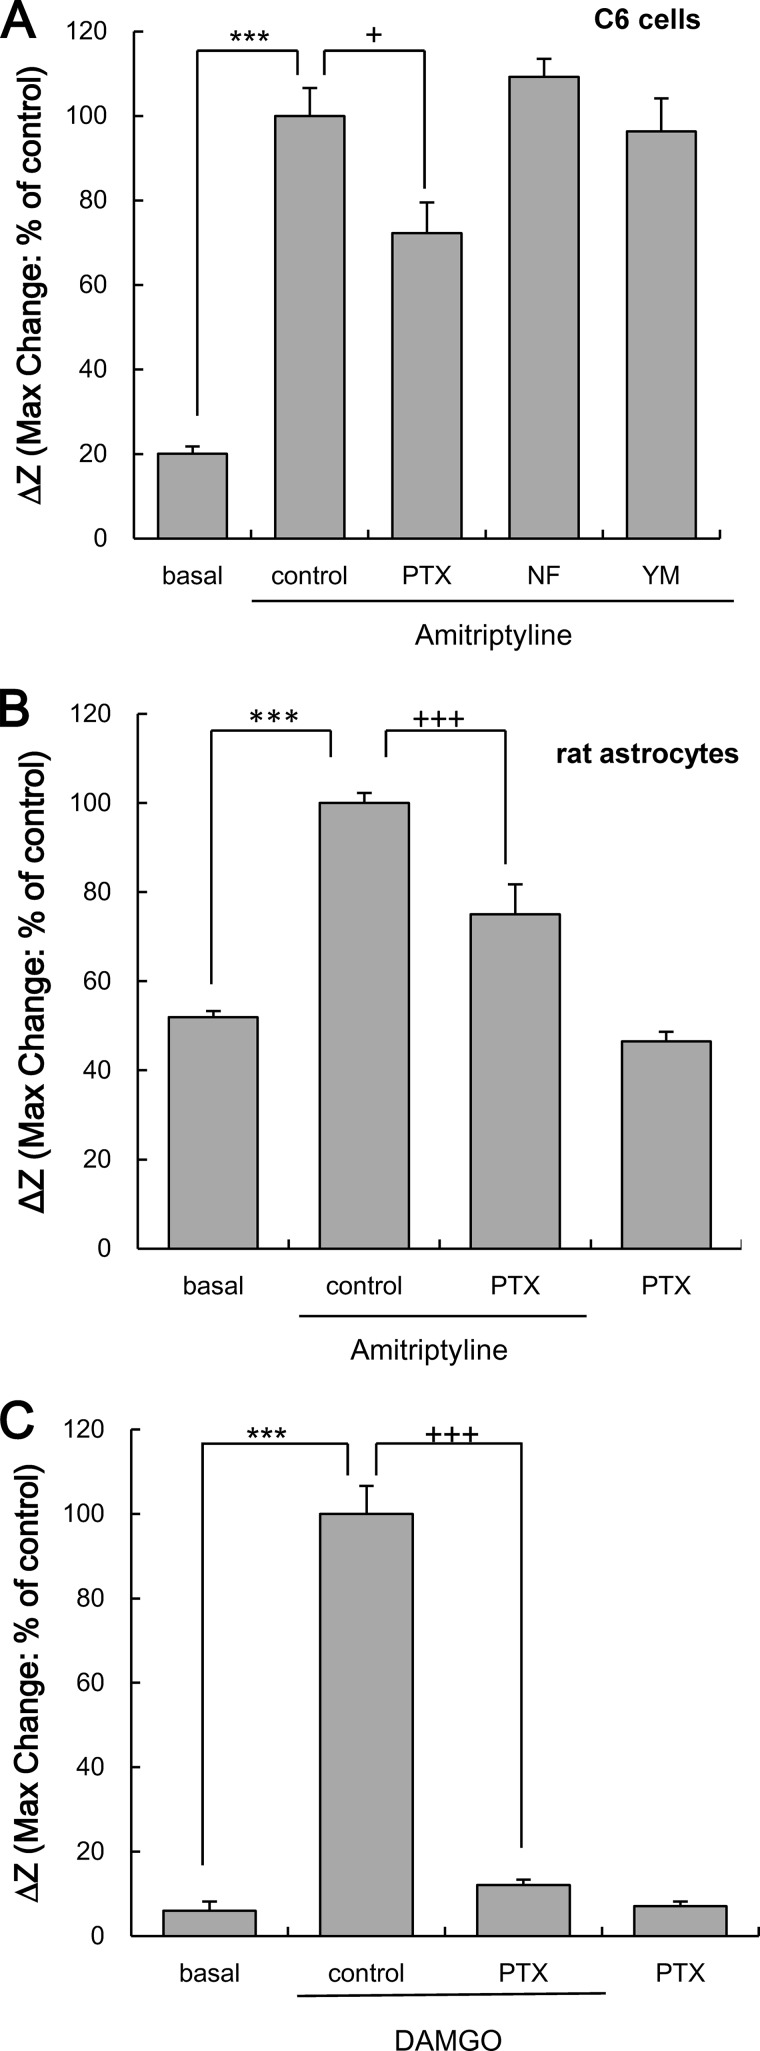
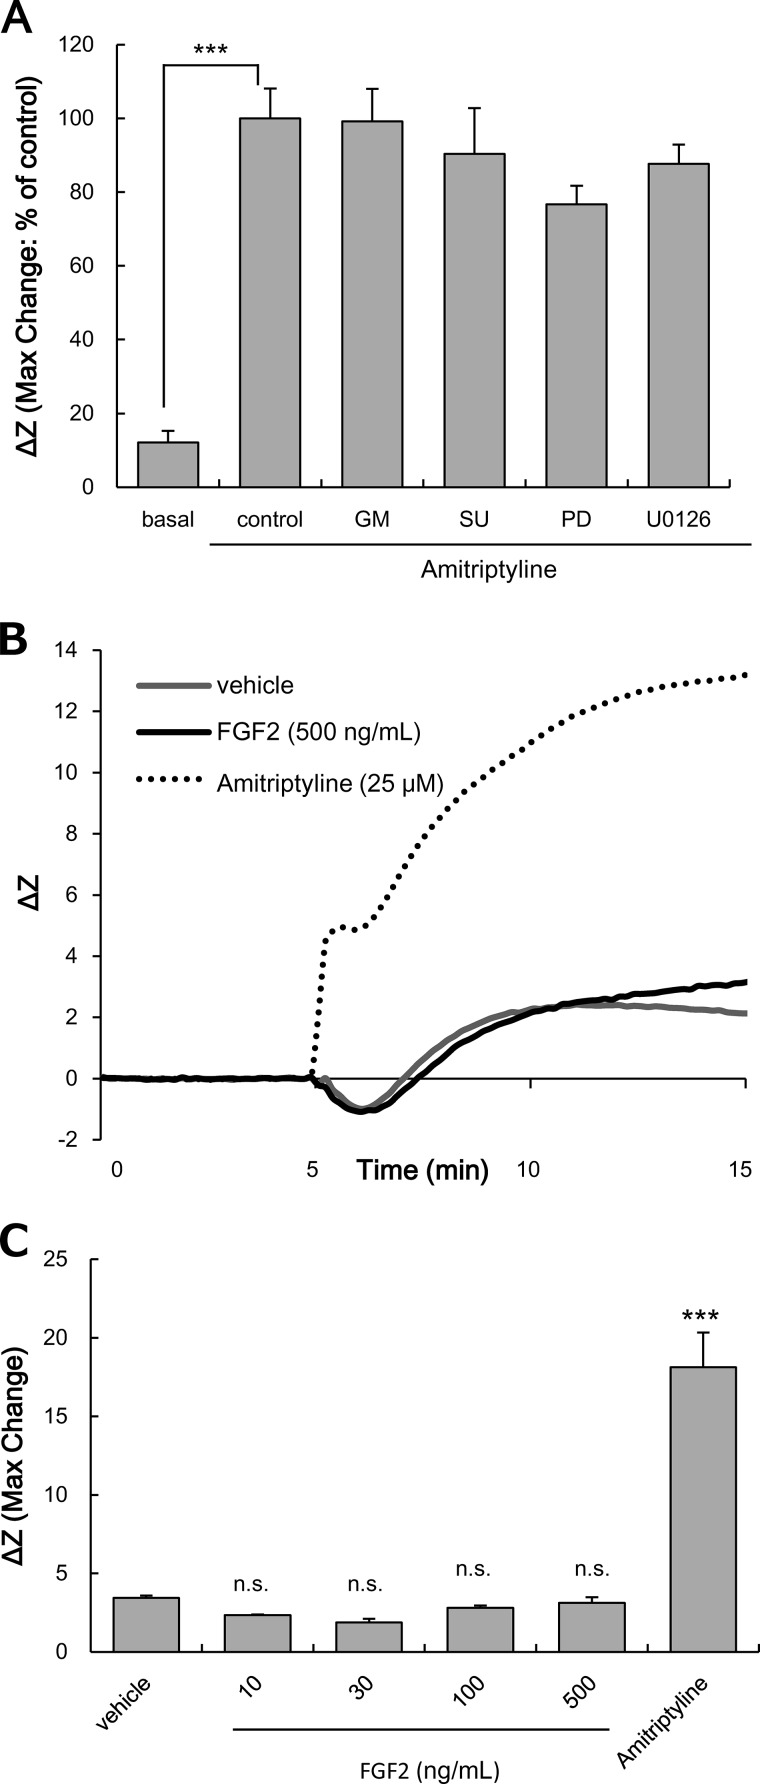
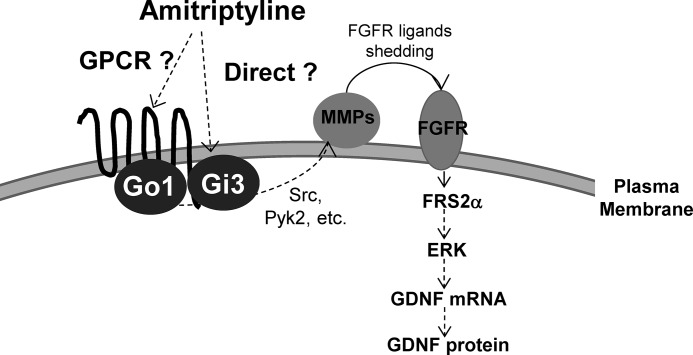
Further elaborating the mechanism of antidepressants, beyond modulation of monoaminergic neurotransmission, this study sought to elucidate the mechanism of amitriptyline-induced production of glial cell line-derived neurotrophic factor (GDNF) in astroglial cells. Previous studies demonstrated that an amitriptyline-evoked matrix metalloproteinase (MMP)/FGF receptor (FGFR)/FGFR substrate 2α (FRS2α)/ERK cascade is crucial for GDNF production, but how amitriptyline triggers this cascade remains unknown. MMP is activated by intracellular mediators such as G proteins, and this study sought to clarify the involvement of G protein signaling in amitriptyline-evoked GDNF production in rat C6 astroglial cells (C6 cells), primary cultured rat astrocytes, and normal human astrocytes. Amitriptyline-evoked GDNF mRNA expression and release were inhibited by pertussis toxin (PTX), a Gα(i/o) inhibitor, but not by NF449, a Gα(s) inhibitor, or YM-254890, a Gαq inhibitor. The activation of the GDNF production cascade (FGFR/FRS2α/ERK) was also inhibited by PTX. Deletion of Gα(ο1) and Gα(i3) by RNAi demonstrated that these G proteins play important roles in amitriptyline signaling. G protein activation was directly analyzed by electrical impedance-based biosensors (CellKey(TM) assay), using a label-free (without use of fluorescent proteins/probes or radioisotopes) and real time approach. Amitriptyline increased impedance, indicating Gα(i/o) activation that was suppressed by PTX treatment. The impedance evoked by amitriptyline was not affected by inhibitors of the GDNF production cascade. Furthermore, FGF2 treatment did not elicit any effect on impedance, indicating that amitriptyline targets PTX-sensitive Gα(i/o) upstream of the MMP/FGFR/FRS2α/ERK cascade. These results suggest novel targeting for the development of antidepressants.

Keywords: Cellkey assay; G protein; antidepressant; astrocyte; biosensor; depression; glial cell.


Figures

FIGURE 1.
FIGURE 1.
Effects of α-subunit of G protein inhibitors on amitriptyline-evoked GDNF production. A, effects of pertussis toxin (PTX), NF449 (NF), and YM-254890 (YM) on the amitriptyline-evoked GDNF mRNA expression. C6 cells were pretreated with 100 ng/ml PTX for 3 h and 1 μm NF449 or 100 nm YM-254890 for 0.5 h and subsequently treated with 25 μm amitriptyline for 3 h. Values are shown as the ratio of GDNF mRNA versus GAPDH mRNA (% of control). Data are expressed as the mean ± S.E. for three to seven independent experiments. **, p < 0.01 in comparison with the basal group; +, p < 0.05 in comparison with the control group (Tukey's test). B, effects of PTX, NF449, and YM-254890 on the amitriptyline-evoked GDNF release. C6 cells were pretreated with 100 ng/ml PTX for 3 h and 1 μm NF449 or 100 nm YM-254890 for 0.5 h and subsequently treated with 25 μm amitriptyline for 48 h. Values are expressed as the mean ± S.E. of released GDNF (pg/ml) for 4–12 independent experiments. **, p < 0.01 in comparison with the basal group; ++, p < 0.01 in comparison with the control group (Tukey's test). C, effects of pertussis toxin, NF449, and YM-254890 on the amitriptyline-evoked GDNF mRNA expression. Primary cultured rat astrocytes were pretreated with 100 ng/ml PTX for 3 h, 1 μm NF449, or 100 nm YM-254890 for 0.5 h and subsequently treated with 25 μm amitriptyline for 6 h. Values are shown as the ratio of GDNF mRNA versus GAPDH mRNA (% of control). Data are expressed as the mean ± S.E. for 8–11 independent experiments. **, p < 0.01 in comparison with the basal group; ++, p < 0.01 in comparison with the control group (Tukey's test).
FIGURE 2.
FIGURE 2.
Effects of pertussis toxin or YM-254890 on FRS2α phosphorylation evoked by amitriptyline, 5-HT, or FGF2. A, effects of pertussis toxin or YM-254890 (YM) on FRS2α phosphorylation evoked by amitriptyline in C6 cells. C6 cells were pretreated with 100 ng/ml PTX for 3 h; 100 nm YM-254890 for 0.5 h and subsequently treated with 25 μm amitriptyline for 5 min. Phosphorylated FRS2α, total FRS2α, and actin were quantified by Western blotting, and representative blots are shown. Values are shown as the ratio of phosphorylated FRS2α to total FRS2α (% of control). Data are expressed as the mean ± S.E. for four to seven independent experiments. ***, p < 0.001 in comparison with the basal group; ++, p < 0.01 in comparison with the control group (Tukey's test). B, effects of PTX or YM-254890 on FRS2α phosphorylation evoked by 5-HT in C6 cells. C6 cells were pretreated with 100 ng/ml PTX for 3 h, 100 nm YM-254890 for 0.5 h, and subsequently treated with 10 μm 5-HT for 5 min. Phosphorylated FRS2α, total FRS2α, and actin were quantified by Western blotting, and representative blots are shown. Values are shown as the ratio of phosphorylated FRS2α to total FRS2α (% of control). Data are expressed as the mean ± S.E. for six independent experiments. **, p < 0.01 in comparison with the basal group; ++, p < 0.01 in comparison with the control group (Tukey's test). C, effects of PTX or YM-254890 on FRS2α phosphorylation evoked by exogenous FGF2 in C6 cells. C6 cells were pretreated with 100 ng/ml PTX for 3 h, 100 nm YM-254890 for 0.5 h, and subsequently treated with 10 ng/ml FGF2 for 5 min. Phosphorylated FRS2α, total FRS2α, and actin were quantified by Western blotting, and representative blots are shown. Values are shown as the ratio of phosphorylated FRS2α to total FRS2α (% of control). Data are expressed as the mean ± S.E. for five to eight independent experiments. **, p < 0.01 in comparison with the basal group (Tukey's test).
FIGURE 3.
FIGURE 3.
Effects of pertussis toxin, YM-254890, GM6001, and SU5402 on ERK activation evoked by amitriptyline, 5-HT, and FGF2. A, effects of pertussis toxin, YM-254890 (YM), GM6001 (GM), or SU5402 (SU) on ERK activation evoked by amitriptyline in C6 cells. C6 cells were pretreated with 100 ng/ml PTX for 3 h, 25 μm SU for 1 h, and 100 nm YM-254890 or 25 μm GM6001 for 0.5 h, and subsequently treated with 25 μm amitriptyline for 5 min. Values are shown as ERK activity (% of control). Data are expressed as the mean ± S.E. for four to five independent experiments. ***, p < 0.001 in comparison with the basal group; ++, p < 0.01; +++, p < 0.001 in comparison with the control group (Tukey's test). B, effects of PTX, YM-254890, GM6001, or SU5402 on ERK activation evoked by 5-HT in C6 cells. C6 cells were pretreated with 100 ng/ml PTX for 3 h, 25 μm SU5402 for 1 h, 100 nm YM-254890 or 25 μm GM6001 for 0.5 h, and subsequently treated with 10 μm 5-HT for 2 min. ERK activity (phosphorylation levels of ERK1/2) was quantified by Western blotting. Values are shown as ERK activity (% of control). Data are expressed as the mean ± S.E. for three independent experiments. ***, p < 0.001 in comparison with the basal group; +++, p < 0.001 in comparison with the control group (Tukey's test). C, effects of PTX, YM-254890, GM6001, and SU5402 on ERK activation evoked by FGF2 in C6 cells. C6 cells were pretreated with 100 ng/ml PTX for 3 h, 25 μm SU5402 for 1 h, 100 nm YM-254890, or 25 μm GM6001 for 0.5 h, and subsequently treated with 10 ng/ml FGF2 for 10 min. ERK activity (phosphorylation levels of ERK1/2) was quantified by Western blotting. Values are shown as ERK activity (% of control). Data are expressed as the mean ± S.E. for three to five independent experiments. **, p < 0.01 in comparison with the basal group; ++, p < 0.01 in comparison with the control group (Tukey's test). D, effects of PTX on ERK activation evoked by amitriptyline in NHA and primary cultured rat astrocytes. Normal human astrocytes were pretreated with 100 ng/ml PTX for 3 h and subsequently treated with 25 μm amitriptyline for 5 min. Primary cultured rat astrocytes were pretreated with 100 ng/ml PTX for 3 h and subsequently treated with 25 μm amitriptyline for 10 min. Values are shown as ERK activity (% of control). Data are expressed as the mean ± S.E. for three or five independent experiments. *, p < 0.05; **, p < 0.01 in comparison with the basal group; +, p < 0.05; ++, p < 0.01 in comparison with the control group (Tukey's test).
FIGURE 4.
FIGURE 4.
Expressions of α-subunits of G protein in C6 cells. A, RT-PCR analysis of α-subunits of G protein mRNA expression in C6 cells. Each lane represents the cDNA fragments of α-subunits of G protein amplified from the RNA of either C6 cells, rat cortex, or rat spleen. Lane M indicates the molecular size marker. B, effects of Go1, Gi2, Gi3, and negative control siRNA transfection on Go1, Gi2, and Gi3 expressions. C6 cells were transfected with either Go1, Gi2, Gi3 siRNA (50 nm) or negative control siRNA (Nega siRNA; 50 nm) for 48 h. The α-subunits of G protein were quantified by Western blotting. Representative blots are shown. Values shown are levels of α-subunits of G protein (% of vehicle). Data are expressed as the mean ± S.E. for 6–12 independent experiments. **, p < 0.01; ***, p < 0.001 in comparison with the vehicle group (Tukey's test).
FIGURE 5.
FIGURE 5.
Effects of the α-subunits of G protein knockdown on amitriptyline and FGF2-evoked ERK activation. A, effect of either Go1, Gi2, or Gi3 knockdown on ERK activation evoked by amitriptyline. C6 cells were transfected with Go1 siRNA, Gi2 siRNA, or Gi3 siRNA (Go1, Gi2, or Gi3; 50 nm) or negative control siRNA (Nega; 50 nm) for 48 h, and subsequently treated with 25 μm amitriptyline alone or in conjunction with 10 ng/ml exogenous FGF2 for 5 min. Values are shown as ERK activity (% of control). Data are expressed as the mean ± S.E. for 3–12 independent experiments. **, p < 0.01 in comparison with the basal group; ++, p < 0.01 in comparison with the control group (Tukey's test). B, effect of either Go1, Gi2, or Gi3 knockdown on ERK activation evoked by FGF2. C6 cells were transfected with Go1 siRNA, Gi2 siRNA, or Gi3 siRNA (Go1, Gi2, or Gi3; 50 nm) or negative control siRNA (Nega; 50 nm) for 48 h, and subsequently treated with 10 ng/ml FGF2 for 10 min. Values are shown as ERK activity (% of control). Data are expressed as the mean ± S.E. for four to six independent experiments. **, p < 0.01 in comparison with the basal group (Tukey's test).
FIGURE 6.
FIGURE 6.
Effects of amitriptyline on impedance (ΔZ) in C6 cells and rat astrocytes using electrical impedance-based biosensors (CellKeyTM assay). A, effects of DAMGO on ΔZ in μ-opioid receptor-expressing HEK293 cells. The cells were treated with vehicle or 1 μm DAMGO for 10 min. The traces shown are representative of the mean increase in ΔZ of cells from each well. Similar results were obtained in at least three independent experiments. B, effects of a β-adrenergic receptor agonist isoproterenol (Isopro) on ΔZ in C6 cells endogenously expressing β-adrenergic receptors. The cells were treated with vehicle or 100 nm isoproterenol (Isopro) for 10 min. The traces shown are representative of the mean increase in ΔZ of cells from each well. Similar results were obtained in at least three independent experiments. C, effects of acetylcholine on ΔZ in HEK293 cells endogenously expressing muscarinic (M3) acetylcholine receptors. The cells were treated with vehicle or 1 μm acetylcholine (ACh) for 10 min. The traces shown are representative of the mean increase in ΔZ of cells from each well. Similar results were obtained in at least three independent experiments. D, effects of amitriptyline on ΔZ in C6 cells. C6 cells were treated with amitriptyline (1, 10, 25, and 50 μm) for 10 min. The traces shown are representative of the mean increase in ΔZ of cells from each well. Similar results were obtained in at least three independent experiments. E, extent of changes in ΔZ was presented as the maximum ΔZ after injection of vehicle or amitriptyline. Values are expressed as the mean ± S.E. of ΔZ (each group; n = 6). **, p < 0.01; ***, p < 0.001 in comparison with the vehicle group (Tukey's test). F, effects of amitriptyline on ΔZ in rat astrocytes. Rat astrocytes were treated with amitriptyline (1, 10, 25, and 50 μm) for 30 min. The traces shown are representative of the mean increase in ΔZ of cells from each well. Similar results were obtained in at least three independent experiments. G, extent of changes in ΔZ was presented as the maximum ΔZ after injection of vehicle or amitriptyline. Values are expressed as the mean ± S.E. of ΔZ (all each group; n = 12). *, p < 0.05; **, p < 0.01 in comparison with the vehicle group (Tukey's test).
FIGURE 7.
FIGURE 7.
Effects of G protein inhibitors on the increase in ΔZ evoked by amitriptyline in C6 cells and rat astrocytes or μ-opioid receptor agonist DAMGO in HEK293 cells expressing μ-opioid receptors. A, effects of PTX, NF449 (NF), and YM-254890 (YM) on amitriptyline-evoked increase in ΔZ in C6 cells. C6 cells were pretreated with 100 ng/ml PTX for 3 h, 1 μm NF449 or 100 nm YM-254890 for 0.5 h, and subsequently treated with 25 μm of amitriptyline for 10 min. Values are expressed as the mean ± S.E. of ΔZ (basal, n = 21; control, n = 21; PTX, n = 9; NF449, n = 12; YM-254890, n = 9). ***, p < 0.001 in comparison with the basal group; +, p < 0.05 in comparison with the control group (Tukey's test). B, effects of PTX on amitriptyline-evoked increase in ΔZ in rat astrocytes. Rat astrocytes were pretreated with 100 ng/ml PTX for 3 h and subsequently treated with 25 μm amitriptyline for 30 min. Values are expressed as the mean ± S.E. of ΔZ (all each group; n = 6). ***, p < 0.001 in comparison with the basal group; +++, p < 0.001 in comparison with the control group (Tukey's test). C, effects of PTX on the increase in ΔZ evoked by the μ-opioid receptor agonist in HEK293 cells expressing μ-opioid receptors. HEK293 cells expressing μ-opioid receptors were pretreated with 100 ng/ml PTX for 3 h and subsequently treated with 1 μm DAMGO for 10 min. Values are expressed as the mean ± S.E. of ΔZ (all each group; n = 12). ***, p < 0.001 in comparison with the basal group; +++, p < 0.001 in comparison with the control group (Tukey's test).
FIGURE 8.
FIGURE 8.
Effects of inhibitors related to the GDNF production cascade on the amitriptyline-evoked increase of ΔZ in C6 cells. A, effects of GM6001 (GM), SU5420 (SU), PD173074 (PD), and U0126 on the increase of ΔZ evoked by amitriptyline in C6 cells. C6 cells were pretreated with 25 μm GM6001, 25 μm SU5402, 1 μm PD173074, or 10 μm U0126 for 0.5 h and subsequently treated with 25 μm amitriptyline for 10 min. Values are expressed as the mean ± S.E. of ΔZ (basal, n = 23; control, n = 23; GM6001, n = 9; SU5402, n = 5; PD173074, n = 10; U0126, n = 6). ***, p < 0.001 in comparison with the basal group (Tukey's test). B, changes in ΔZ evoked by incubation in vehicle, FGF2 (10, 30, 100, and 500 ng/ml), or amitriptyline (25 μm) for 10 min in C6 cells. The traces shown are representative of the mean increase in ΔZ of cells from each well. Similar results were obtained in at least three independent experiments. C, extent of changes in ΔZ was presented as the maximum ΔZ after injection of vehicle, FGF2, or amitriptyline. Values are expressed as the mean ± S.E. of ΔZ (vehicle, n = 9; FGF2 (each dose), n = 3; amitriptyline, n = 9). ***, p < 0.001 in comparison with the vehicle group (Tukey's test). n.s., no significant difference.
FIGURE 9.
FIGURE 9.
Hypothesized monoamine-independent mode of action of amitriptyline-induced GDNF production in astroglial cells. Amitriptyline either directly or indirectly activates PTX-sensitive Gi/o (Gi3 or Go1) and MMP/FGFR/FRS2α/ERK cascade, leading to GDNF production in astroglial cells.

References

    1. Belmaker R. H., Agam G. (2008) Major depressive disorder. N. Engl. J. Med. 358, 55–68 - PubMed
    1. Rajkowska G., Stockmeier C. A. (2013) Astrocyte pathology in major depressive disorder: insights from human postmortem brain tissue. Curr. Drug Targets 14, 1225–1236 - PMC - PubMed
    1. Allen N. J., Barres B. A. (2009) Neuroscience: Glia–more than just brain glue. Nature 457, 675–677 - PubMed
    1. Schmidt H. D., Banasr M., Duman R. S. (2008) Future antidepressant targets: neurotrophic factors and related signaling cascades. Drug Discov. Today Ther. Strateg. 5, 151–156 - PMC - PubMed
    1. Bespalov M. M., Saarma M. (2007) GDNF family receptor complexes are emerging drug targets. Trends Pharmacol. Sci. 28, 68–74 - PubMed

Publication types

MeSH terms