. 2016 May;221(4):2231-49.
doi: 10.1007/s00429-015-1040-9. Epub 2015 Apr 14.

Transgene expression in the Nop-tTA driver line is not inherently restricted to the entorhinal cortex

Affiliations

Transgene expression in the Nop-tTA driver line is not inherently restricted to the entorhinal cortex

Michael J Yetman et al. Brain Struct Funct. 2016 May.

Abstract

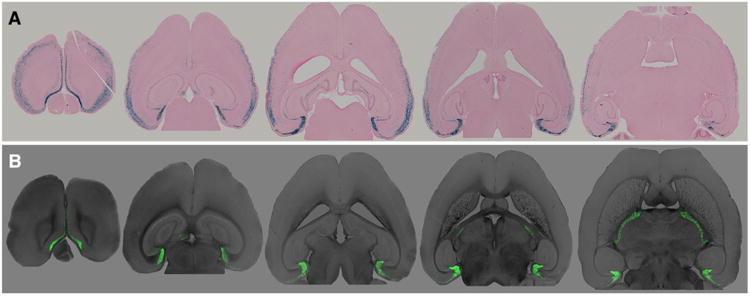
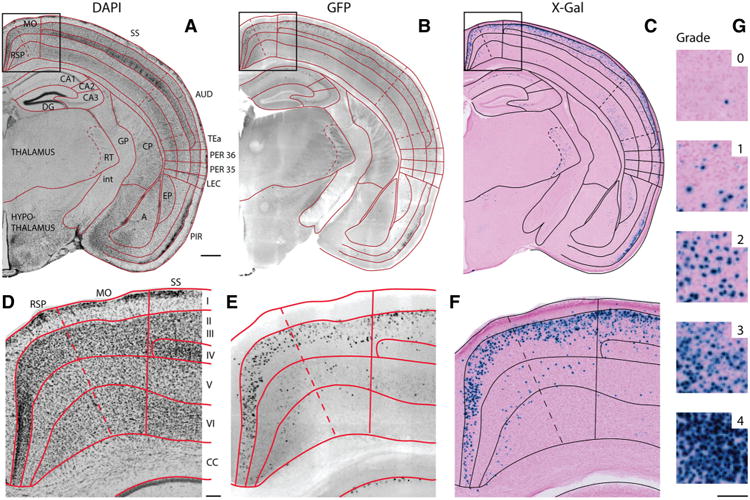
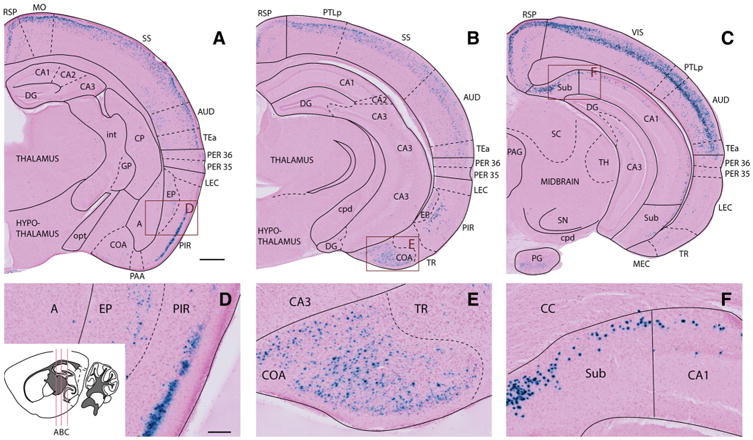
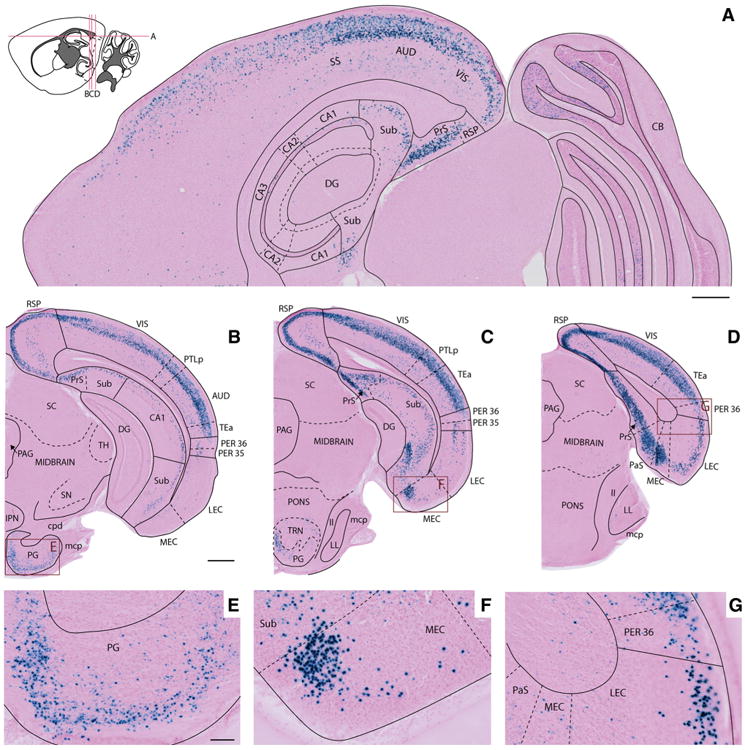
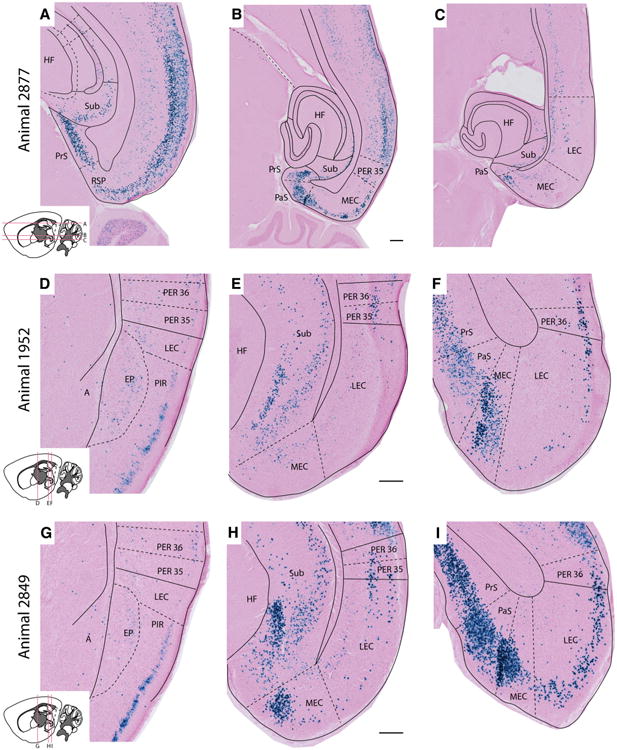
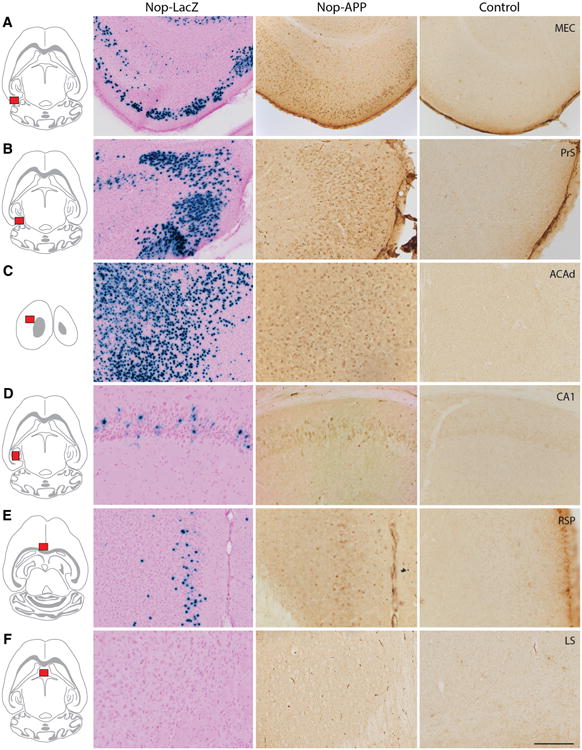
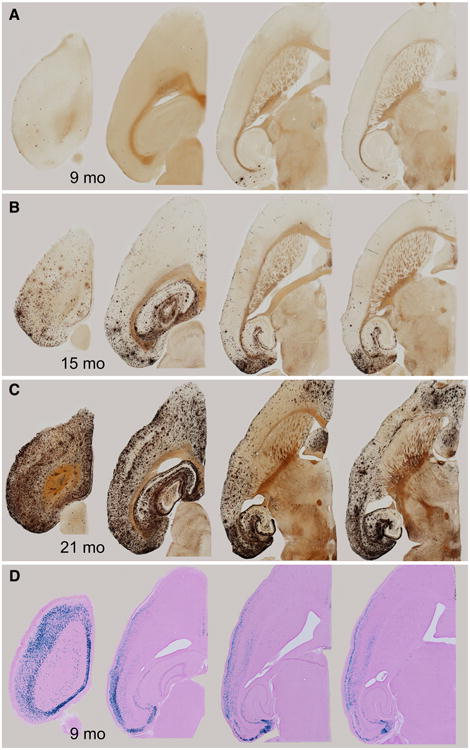
The entorhinal cortex (EC) plays a central role in episodic memory and is among the earliest sites of neurodegeneration and neurofibrillary tangle formation in Alzheimer's disease. Given its importance in memory and dementia, the ability to selectively modulate gene expression or neuronal function in the EC is of widespread interest. To this end, several recent studies have taken advantage of a transgenic line in which the tetracycline transactivator (tTA) was placed under control of the neuropsin (Nop) promoter to limit transgene expression within the medial EC and pre-/parasubiculum. Although the utility of this driver is contingent on its spatial specificity, no detailed neuroanatomical analysis of its expression has yet been conducted. We therefore undertook a systematic analysis of Nop-tTA expression using a lacZ reporter and have made the complete set of histological sections available through the Rodent Brain Workbench tTA atlas, www.rbwb.org . Our findings confirm that the highest density of tTA expression is found in the EC and pre-/parasubiculum, but also reveal considerable expression in several other cortical areas. Promiscuous transgene expression may account for the appearance of pathological protein aggregates outside of the EC in mouse models of Alzheimer's disease using this driver, as we find considerable overlap between sites of delayed amyloid deposition and regions with sparse β-galactosidase reporter labeling. While different tet-responsive lines can display individual expression characteristics, our results suggest caution when designing experiments that depend on precise localization of gene products controlled by the Nop-tTA or other spatially restrictive transgenic drivers.

Keywords: Ectopic expression; Rodent brain atlas; Tet-lacZ reporter; Tet-off transgenic; Tetracycline transactivator.


Conflict of interest statement

Conflict of interest The authors declare no conflict of interest.

Figures

Fig 1
Fig 1
Two distinct responder lines reveal Nop-tTA expression beyond the entorhinal cortex. a Using a nuclear localized lacZ reporter, we detected substantial expression outside the areas where the Nop-tTA driver was known to be active. b Using an H2B-GFP reporter, expression was detected in many of the same areas as in the lacZ animals. Sections were taken from a male Nop-lacZ and a female Nop-H2B-GFP harvested at 2.5 months of age. A high resolution version of this figure is provided in the online Supplementary Information
Fig 2
Fig 2
Anatomical delineations and semi-quantitative grading system. af Adjacent coronal sections from the Nop-lacZ mice used in the online atlas show fluorescent GFP expression and DAPI counterstain (a, b) alongside colorimetric X-gal staining and nuclear fast red counterstain (c). Both markers can be used for visualization because the tetO-lacZ reporter line included the coding sequence for GFP following that for β-galactosidase. df Show enlarged details of the sections in (ac). g Sample regions illustrate the 5-point semi-quantitative grading system used to describe the density of X-gal-positive cells in each subregion (see “Materials and methods” for additional detail). IVI layers of the cerebral cortex, A amygdalar nuclei, AUD auditory area, CA1 cornu ammonis 1, CA2 cornu ammonis 2, CA3 cornu ammonis 3, CC corpus callosum, CP caudoputamen, DG dentate gyrus, EP endopiriform nucleus, GP globus pallidus, int internal capsule, LEC lateral entorhinal area, MO motor areas, PER 35 perirhinal area 35, PER36 perirhinal area 36, PIR piriform area, RSP retrosplenial area, RT reticular nucleus of the thalamus, SS somatosensory areas, TEa temporal association areas. Scale bar 500 μm (ac), 100 μm (dg)
Fig 3
Fig 3
X-gal labeling in the cerebral cortex and anterior hippocampal region. ac Images from three coronal sections show the distribution of X-gal staining at different levels of the brain from a 7-month-old female Nop-lacZ animal. All images are taken from the right hemisphere at the anterio-posterior levels indicated by the inset illustration (redrawn and modified from the Allen Brain Institute mouse brain atlas). df High-magnification images of the boxed areas in (ac). Images show labeling in layer 2/3 of the piriform cortex (d), the cortical amygdalar nuclei (e), and parts of the subiculum and cornu ammonis subfields of the hippocampus (f). Note the absence of labeling in the lateral entorhinal cortex (LEC) at this level (c). A amygdalar nuclei, AUD auditory area, CA1 cornu ammonis 1, CA2 cornu ammonis 2, CA3 cornu ammonis 3, CC corpus callosum, COA cortical amygdalar area, CP caudoputamen, cpd cerebral peduncle, DG dentate gyrus, EP endopiriform nucleus, GP globus pallidus, int internal capsule, LEC lateral entorhinal cortex, MEC medial entorhi-nal cortex, MO motor areas, opt optic tract, PAA piriform-amygdalar area, PAG periaqueductal gray, PER 35 perirhinal area 35, PER 36 perirhinal area 36, PG pontine gray, PIR piriform area, PTLp posterior parietal association areas, RSP retrosplenial area, SC superior colliculus, SN substantia nigra, SS somatosensory areas, Sub subiculum, TEa temporal association areas, TH thalamus, TR postpiriform transition areas, VIS visual areas. Scale bar 500 μm (ac), 100 μm (df)
Fig 4
Fig 4
X-gal labeling in cerebral cortex and posterior hippocampal region. ad Horizontal (a) and coronal sections (bd) illustrate X-gal staining in a 7-month-old female Nop-lacZ animal at dorsal and posterior levels of the brain. The density of X-gal labeled cells increases from anterior to posterior across the parietal and occipital cerebral cortex (a), the hippocampal region (ad), and the entorhinal cortex (bd). eg High-magnification images of the boxed areas in bd illustrate labeling in the pontine gray (e), the medial entorhinal cortex close to the subicular boundary (f), and the perirhinal area (g). AUD auditory area, CAi1 cornu ammonis 1, CA2 cornu ammonis 2, CA3 cornu ammonis 3, CB cerebellum, cpd cerebral peduncle, DG dentate gyrus, IPN interpeduncular nucleus, LEC lateral entorhinal cortex, ll lateral lemniscus, LL nucleus of the lateral lemniscus, mcp middle cerebellar peduncle, MEC medial entorhinal cortex, PAG periaqueductal gray, PaS parasubiculum, PER 35 perirhinal area 35, PER 36 perirhinal area 36, PG pontine gray, PrS presubiculum, PTLp posterior parietal association areas, RSP retrosplenial area, SC superior colliculus, SN substantia nigra, SS somatosensory areas, Sub subiculum, TEa temporal association areas, TH thalamus, TRN tegmental reticular nucleus, VIS visual areas. Scale bars a, bd 500 μm, eg 100 μm
Fig 5
Fig 5
X-gal labeling in the parahippocampal region. Images show the distribution of X-gal staining in the parahippocampal region of three Nop-lacZ mice (two male, one female, 7–9 months of age), prepared as horizontal (ac), and coronal sections (df and gi). The location of each section is indicated in the inset drawings. The sections illustrate a distinct gradient in the density of X-gal stained cells, increasing from anterior to posterior (ac, df, gi), and from medial to lateral entorhinal cortex (f, i). A high resolution version of this figure is provided in the online Supplementary Information. A Amygdala, EP endopiriform nucleus, HF hippocampal formation, LEC lateral entorhinal cortex, MEC medial entorhinal cortex, PaS parasubiculum, PER 35 perirhinal area 35, PER 36 perirhinal area 36, PIR piriform cortex, PrS presubiculum, RSP retrosplenial cortex, Sub subiculum. Scale bar 200 μm
Fig 6
Fig 6
Expression of transgenic APP under control of Nop-tTA matches the pattern of β-galactosidase staining in lacZ reporter mice. Immunostaining for transgenic APP in Nop-APP mice harvested at 6 months of age (middle column) matches the density and pattern of X-gal labeling in Nop-lacZ tissue (left column). Tissue from Nop-tTA single transgenic animals demonstrates that the antibody does not cross react with endogenous mouse APP (right column). a Medial entorhinal cortex. b Presubiculum. c Dorsal anterior cingulate cortex. d Cornu ammonis 1. e Retrosplenial cortex. f Lateral septum. Scale bar 200 μm (a), 100 μm (bf)
Fig 7
Fig 7
The progression of amyloid pathology in aged Nop-APP mice largely matches the density and pattern of β-galactosidase staining in the Nop-lacZ reporter. ac Silver staining reveals the expansion of amyloid pathology over time in Nop-APP mice. d Sections from the online atlas showing X-gal staining in Nop-lacZ mice at levels of the brain corresponding to the amyloidstained sections above. A high resolution version of this figure is provided in the online Supplementary Information

Similar articles

Cited by

References

    1. Akitake CM, Macurak M, Halpern ME, Goll MG. Transgenerational analysis of transcriptional silencing in zebrafish. Dev Biol. 2011;352:191–201. doi: 10.1016/j.ydbio.2011.01.002. - DOI - PMC - PubMed
    1. Bjaalie JG, Leergaard TB. Three-dimensional computerized reconstruction from serial sections: cell populations, regions, and whole brain. In: Zaborszky L, Wouterlood FG, Lanciego JL, editors. Neuroanatomical tract tracing: molecules, neurons and systems. 3rd. Springer/Kluwer/Plenum; 2006. pp. 530–565.
    1. Bjaalie JG, Leergaard TB, Lillehaug S, Odeh F, Moene IA, Kjode JO, Darin D. Database and tools for analysis of topographic organization and map transformations in major projection systems of the brain. Neuroscience. 2005;136:681–695. doi: 10.1016/j.neuroscience.2005.06.036. - DOI - PubMed
    1. Boy J, et al. Expression mapping of tetracycline-responsive prion protein promoter: digital atlasing for generating cell-specific disease models. NeuroImage. 2006;33:449–462. doi: 10.1016/j.neuroimage.2006.05.055. - DOI - PubMed
    1. Braak H, Braak E. Neuropathological stageing of Alzheimer-related changes. Acta Neuropathol (Berl) 1991;82:239–259. - PubMed

Publication types